Sanitary Valves Market Analysis, Size, and Forecast 2026-2030: APAC (China, Japan, and India), Europe (Germany, UK, and France), North America (US, Canada, and Mexico), South America (Brazil, Argentina, and Colombia), Middle East and Africa (UAE, Saudi Arabia, and South Africa), and Rest of World (ROW)

Sanitary Valves Market Analysis, Size, and Forecast 2026-2030:
APAC (China, Japan, and India), Europe (Germany, UK, and France), North America (US, Canada, and Mexico), South America (Brazil, Argentina, and Colombia), Middle East and Africa (UAE, Saudi Arabia, and South Africa), and Rest of World (ROW)

Published: Mar 2026 307 Pages SKU: IRTNTR45487

Market Overview at a Glance

$868.4 Mn
Market Opportunity
6.4%
CAGR 2025 - 2030
50.4%
APAC Growth
$779 Mn
Pharmaceutical segment 2024

Sanitary Valves Market Size 2026-2030

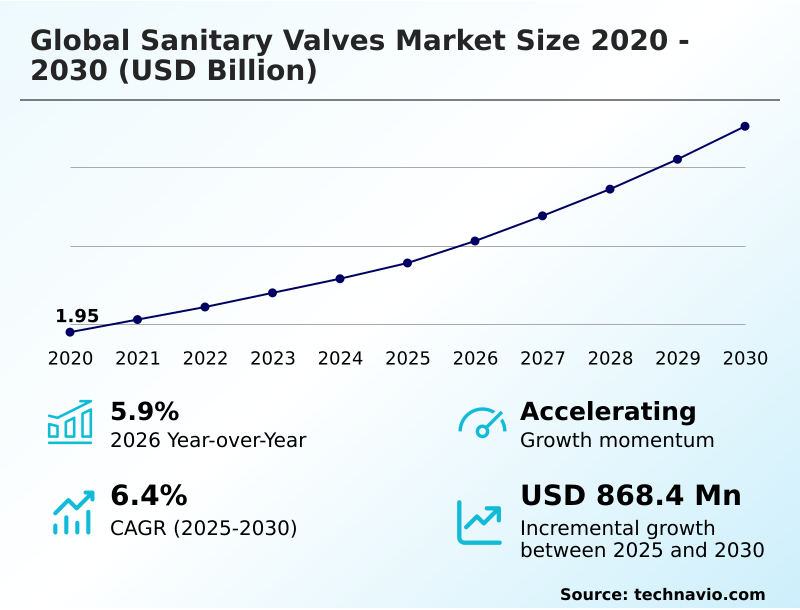
The sanitary valves market size is valued to increase by USD 868.4 million, at a CAGR of 6.4% from 2025 to 2030. Integration of industry 4.0 and smart valve automation technologies will drive the sanitary valves market.

Major Market Trends & Insights

  • APAC dominated the market and accounted for a 50.4% growth during the forecast period.
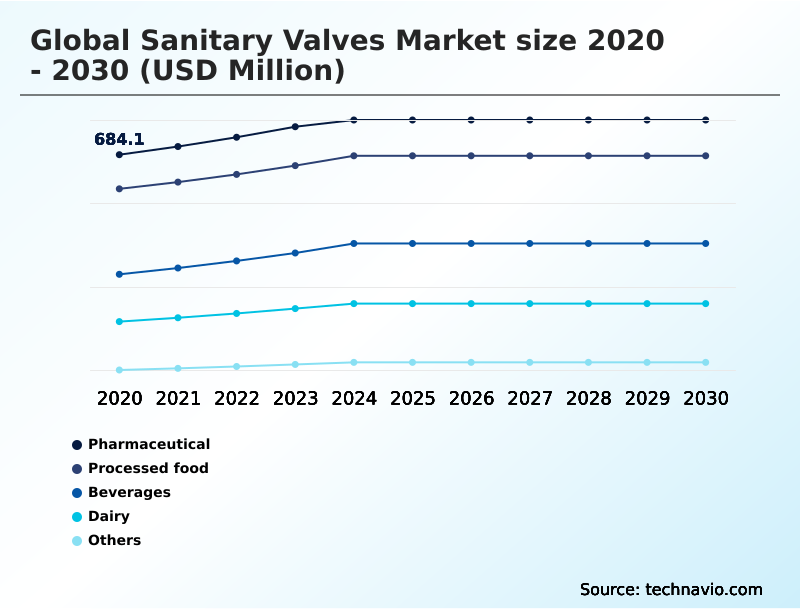
  • By End-user - Pharmaceutical segment was valued at USD 779 million in 2024
  • By Product - Control valves segment accounted for the largest market revenue share in 2024

Market Size & Forecast

  • Market Opportunities: USD 1.31 billion
  • Market Future Opportunities: USD 868.4 million
  • CAGR from 2025 to 2030 : 6.4%

Market Summary

  • The sanitary valves market is undergoing a crucial evolution, driven by heightened regulatory demands for hygiene and the digital transformation of manufacturing. In sectors like pharmaceuticals and food processing, the need to prevent contamination is absolute, making advanced fluid handling solutions essential.
  • This is fueling a shift toward components that not only ensure sterility but also integrate with smart factory ecosystems. For instance, a dairy processing facility can leverage valves with embedded IoT sensors to monitor clean-in-place (CIP) cycles in real-time.
  • This provides auditable data for compliance and allows for the dynamic adjustment of cleaning agent concentrations, reducing resource consumption without compromising safety. This convergence of mechanical precision and digital intelligence, alongside a growing emphasis on sustainability and modular system design, defines the industry's trajectory.
  • As manufacturers navigate supply chain complexities for high-grade materials, the focus remains on delivering reliable, compliant, and efficient solutions that support safe and continuous production.

What will be the Size of the Sanitary Valves Market during the forecast period?

Get Key Insights on Market Forecast (PDF) Request Free Sample

How is the Sanitary Valves Market Segmented?

The sanitary valves industry research report provides comprehensive data (region-wise segment analysis), with forecasts and estimates in "USD million" for the period 2026-2030, as well as historical data from 2020-2024 for the following segments.

  • End-user
    • Pharmaceutical
    • Processed food
    • Beverages
    • Dairy
    • Others
  • Product
    • Control valves
    • Double valves
    • Single valves
    • Butterfly valves
    • Others
  • Material
    • Stainless steel
    • Alloy steel
    • Plastic
  • Geography
    • APAC
      • China
      • Japan
      • India
    • Europe
      • Germany
      • UK
      • France
    • North America
      • US
      • Canada
      • Mexico
    • South America
      • Brazil
      • Argentina
      • Colombia
    • Middle East and Africa
      • UAE
      • Saudi Arabia
      • South Africa
    • Rest of World (ROW)

By End-user Insights

The pharmaceutical segment is estimated to witness significant growth during the forecast period.

The pharmaceutical segment drives significant demand, mandating a sterile processing environment for biopharmaceutical fluid control and aseptic valve for cell therapy production.

This sector requires strict adherence to asme bpe compliance, leading to widespread adoption of components featuring a zero-dead-leg design and electropolished surfaces to ensure sterility.

Innovations in aseptic diaphragm valves and mix-proof valves, typically fabricated from 316l stainless steel, are critical. Facilities are optimizing clean-in-place cip cycles, with advanced valve technology enabling a 15% reduction in water and chemical usage during sanitation.

This focus extends to beverage production line hygiene and dairy processing valve solutions, where food-grade valve maintenance is paramount for ensuring product safety and operational efficiency.

Request Free Sample

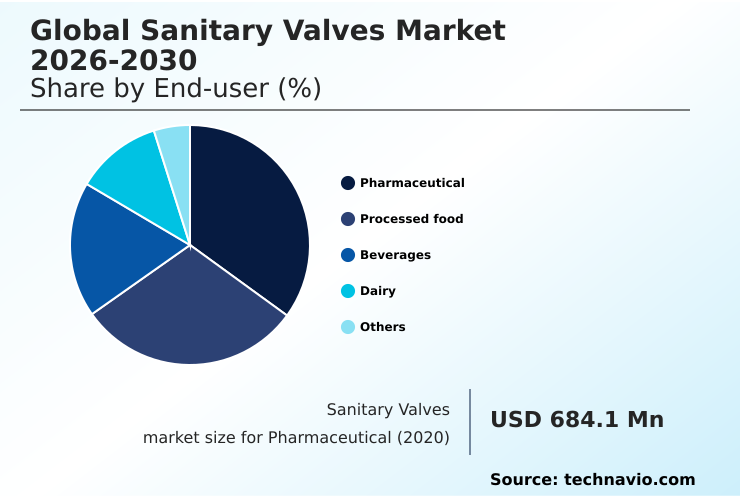
The Pharmaceutical segment was valued at USD 779 million in 2024 and showed a gradual increase during the forecast period.

Request Free Sample

Regional Analysis

APAC is estimated to contribute 50.4% to the growth of the global market during the forecast period.Technavio’s analysts have elaborately explained the regional trends and drivers that shape the market during the forecast period.

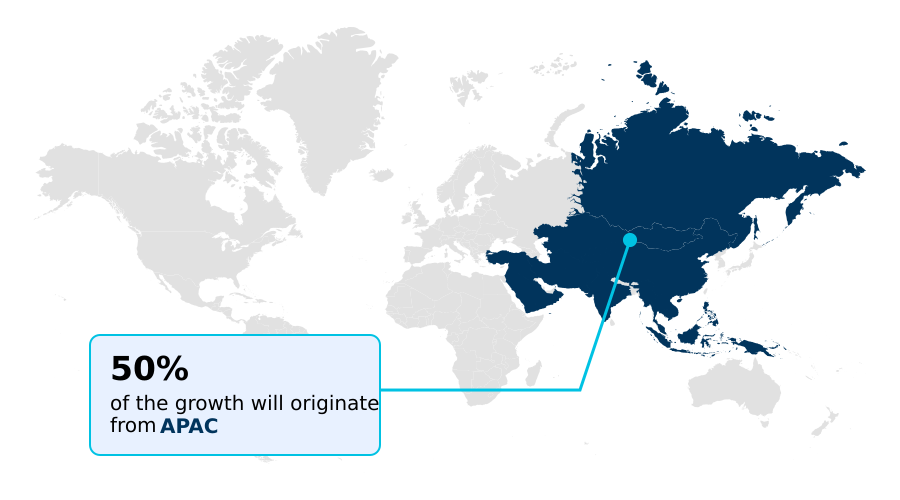
See How Sanitary Valves Market Demand is Rising in APAC Request Free Sample

The geographic landscape is led by APAC, which accounts for over 50% of the incremental growth, fueled by industrialization in China and India.

This region is a major adopter of specialty sanitary valves and positive displacement pump systems for food processing.

In contrast, North America and Europe are mature markets focused on innovation, such as additive manufacturing and selective laser melting for high-purity and abrasive applications and water-hydraulic process valves that reduce energy use by over 20%.

These regions prioritize sustainable lifecycle management and verifiable sustainability data. Europe's 5.8% growth is driven by upgrades to existing systems, while the rapid expansion in APAC also elevates the counterfeit material risk.

Demand is also rising for hygienic manual valves and portable sanitation infrastructure in developing areas.

Market Dynamics

Our researchers analyzed the data with 2025 as the base year, along with the key drivers, trends, and challenges. A holistic analysis of drivers will help companies refine their marketing strategies to gain a competitive advantage.

  • Strategic sourcing in the sanitary valves market requires a detailed evaluation beyond initial price, encompassing total cost of ownership. Key decisions involve comparing 316l vs 304 stainless steel sanitary valves for corrosion resistance and assessing the cip efficiency of diaphragm vs butterfly valves for specific applications.
  • Finding the best sanitary valve for high-viscosity food is critical for preventing product degradation, while concurrently reducing dead legs in pharmaceutical piping is non-negotiable for sterility. The debate between single-use vs reusable bioprocessing valves hinges on balancing operational flexibility with long-term cost.
  • Implementing smart valve automation for dairy processing can improve yields, while adherence to ehedg vs 3-a sanitary standards determines market access. The cost of non-compliance in aseptic processing can be catastrophic, with facilities addressing it seeing audit pass rates improve by over 25% compared to those that don't. A proper sanitary valve selection for craft breweries ensures product consistency.
  • Preventing bio-burden in sterile injectables demands meticulous material traceability for pharma valves and superior impact of surface finish on cleanability. Other crucial considerations include selecting a pressure relief valve for aseptic tanks, ensuring leakage prevention in aseptic connections, and choosing the right valve design for modular skid systems.
  • Proper maintenance of mix-proof valves and selecting elastomers for steam sterilization extend asset life. Automating fluid transfer in wineries, using iot sensor integration in sanitary valves, and managing validation of single-use fluid paths are also vital. Finally, the choice of a sanitary valve for high-pressure homogenization and flow control valves for monoclonal antibodies requires deep technical expertise.

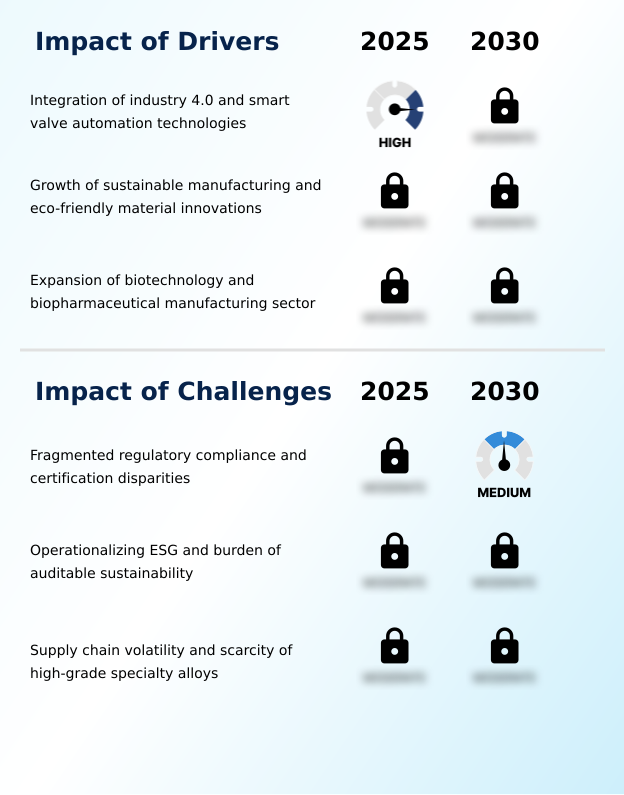
What are the key market drivers leading to the rise in the adoption of Sanitary Valves Industry?

  • The integration of Industry 4.0 principles and smart valve automation technologies is a key driver, enabling real-time monitoring and predictive maintenance in fluid control systems.

  • The integration of industrial internet of things sensors is a major driver, enabling eco-friendly manufacturing processes and auditable sustainability actions. A smart valve positioner allows for real-time monitoring, reducing unplanned downtime in hygienic process applications by up to 30%.
  • This digitalization is supported by the digital product passport framework, which enhances traceability for components like high-purity stainless steel aseptic seat valves.
  • The flow control division of manufacturers is developing modular valve units that incorporate low-torque actuation, lowering energy consumption by 15%.
  • This focus on intelligent, sustainable hardware helps mitigate geopolitical supply chain risk associated with high-grade specialty alloys and meets demands for greater operational transparency and efficiency.

What are the market trends shaping the Sanitary Valves Industry?

  • The adoption of single-use sterile valve technology is an important trend, driven by the need to enhance operational flexibility and eliminate cross-contamination risks in biopharmaceutical processing.

  • A significant trend is the adoption of single-use valve technology, utilizing high-purity polymers for reducing cross-contamination in pharma, which can decrease changeover times by over 40%. This shift prioritizes sterility over hardware longevity, optimizing cip sip cycles.
  • In parallel, the growth in craft beverage production is increasing demand for robust brewery fluid handling equipment, including sanitary ball valves with superior hygienic flow control. Innovations like the leakage detection butterfly valve offer a cost-effective alternative for monitoring pharmaceutical-grade sealing technology. For cosmetic manufacturing process control and handling hygienic valve for viscous fluids, a pneumatic actuator provides reliable performance.
  • Advanced aseptic sampling techniques also ensure product integrity, with some systems improving sample purity by 25%.

What challenges does the Sanitary Valves Industry face during its growth?

  • Fragmented regulatory compliance and disparities in certification standards across regions present a key challenge, increasing development costs and operational complexity for manufacturers.

  • Supply chain volatility for high-grade alloys presents a significant challenge, with price fluctuations exceeding 20% and impacting the production of bioprocessing equipment and fluid handling solutions. This affects sectors from personalized medicine manufacturing and advanced gene therapies to the craft brewery segment.
  • The need for specialized zero-static diaphragm valves and aseptic sampling valves in contract development and manufacturing organizations is intensifying, but sourcing is difficult. Furthermore, valve automation technologies are essential for modular and flexible valve systems, yet integrating them with legacy systems can increase project costs by 15%.
  • The boutique distillery sector and makers of complex valve geometries also face difficulties in procuring materials and specialized components, hindering their growth potential.

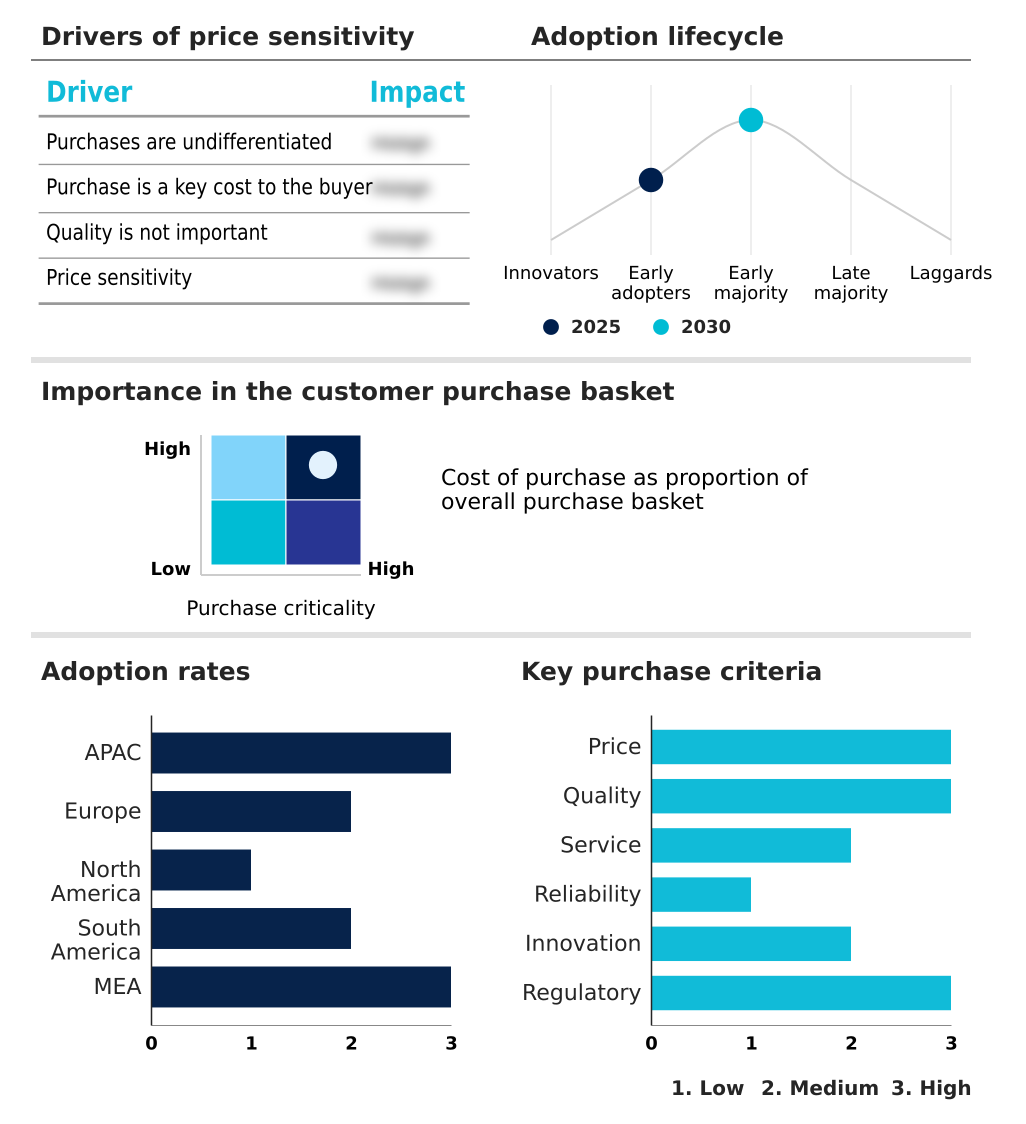
Exclusive Technavio Analysis on Customer Landscape

The sanitary valves market forecasting report includes the adoption lifecycle of the market, covering from the innovator’s stage to the laggard’s stage. It focuses on adoption rates in different regions based on penetration. Furthermore, the sanitary valves market report also includes key purchase criteria and drivers of price sensitivity to help companies evaluate and develop their market growth analysis strategies.

Customer Landscape of Sanitary Valves Industry

Competitive Landscape

Companies are implementing various strategies, such as strategic alliances, sanitary valves market forecast, partnerships, mergers and acquisitions, geographical expansion, and product/service launches, to enhance their presence in the industry.

Adamant Valves - Offers a range of sanitary valves including butterfly, ball, and check valves, along with sight glasses and unions for hygienic applications.

The industry research and growth report includes detailed analyses of the competitive landscape of the market and information about key companies, including:

  • Adamant Valves
  • Alfa Laval AB
  • Ampco Pumps Co.
  • Dover Corp.
  • Evoguard GmbH
  • Flowserve Corp.
  • FRISTAM Pumpen KG GmbH and Co.
  • GEA Group AG
  • GEMU Group
  • Graco Inc.
  • Grundfos Holding AS
  • Habonim Industrial Ltd.
  • IDEX Corp.
  • INOXPA SAU
  • ITT Inc.
  • KSB SE and Co. KGaA
  • Pentair Plc
  • SPX FLOW Inc.
  • Steriflow Valve
  • Valtorc International
  • Verder Group
  • Xylem Inc.

Qualitative and quantitative analysis of companies has been conducted to help clients understand the wider business environment as well as the strengths and weaknesses of key industry players. Data is qualitatively analyzed to categorize companies as pure play, category-focused, industry-focused, and diversified; it is quantitatively analyzed to categorize companies as dominant, leading, strong, tentative, and weak.

Recent Development and News in Sanitary valves market

  • In December 2024, GEA Group AG announced the acquisition of Hydract A/S, a Danish specialist in water-hydraulic process valves, to integrate energy-efficient actuation technology into its portfolio.
  • In January 2025, ITT Inc. revealed a definitive agreement to acquire SPX FLOW Inc. in a transaction valued at approximately USD 4.7 billion, significantly expanding its leadership in high-purity and sanitary flow applications.
  • In February 2025, Eli Lilly and Co. announced a capital investment plan exceeding USD 27 billion to expand its US manufacturing footprint, signaling a substantial future demand for high-purity components like sanitary valves.
  • In March 2025, Alfa Laval AB expanded its hygienic portfolio with the launch of the Unique SSV Pressure Relief Valve and a new leakage detection butterfly valve, enhancing safety in fluid handling systems.

Dive into Technavio’s robust research methodology, blending expert interviews, extensive data synthesis, and validated models for unparalleled Sanitary Valves Market insights. See full methodology.

Market Scope
Page number 307
Base year 2025
Historic period 2020-2024
Forecast period 2026-2030
Growth momentum & CAGR Accelerate at a CAGR of 6.4%
Market growth 2026-2030 USD 868.4 million
Market structure Fragmented
YoY growth 2025-2026(%) 5.9%
Key countries China, Japan, India, South Korea, Australia, Indonesia, Germany, UK, France, Italy, Spain, The Netherlands, US, Canada, Mexico, Brazil, Argentina, Colombia, UAE, Saudi Arabia, South Africa, Egypt and Turkey
Competitive landscape Leading Companies, Market Positioning of Companies, Competitive Strategies, and Industry Risks

Request Free Sample

Research Analyst Overview

  • The sanitary valves market is advancing beyond traditional fluid handling, driven by the integration of intelligent systems and sustainable design principles. Core components such as aseptic diaphragm valves and mix-proof valves are now expected to deliver not just hygienic flow control but also actionable data.
  • The adoption of a smart valve positioner and valve automation technologies transforms bioprocessing equipment into connected assets. For boardroom-level budgeting, this means justifying higher initial capital for a modular valve unit with low-torque actuation, as it promises long-term ROI through reduced energy costs and fewer maintenance cycles. Facilities using this technology have reported a 30% reduction in unplanned maintenance events.
  • The use of high-purity stainless steel, 316l stainless steel, and high-purity polymers remains critical for meeting asme bpe compliance in hygienic process applications. Innovations like the leakage detection butterfly valve and aseptic sampling systems, alongside advances in clean-in-place cip and electropolished surfaces, are essential for achieving a zero-dead-leg design.
  • As the industry's flow control division focuses on specialized solutions like aseptic seat valves and zero-static diaphragm valves, the emphasis is on creating holistic fluid handling solutions.

What are the Key Data Covered in this Sanitary Valves Market Research and Growth Report?

  • What is the expected growth of the Sanitary Valves Market between 2026 and 2030?

    • USD 868.4 million, at a CAGR of 6.4%

  • What segmentation does the market report cover?

    • The report is segmented by End-user (Pharmaceutical, Processed food, Beverages, Dairy, and Others), Product (Control valves, Double valves, Single valves, Butterfly valves, and Others), Material (Stainless steel, Alloy steel, and Plastic) and Geography (APAC, Europe, North America, South America, Middle East and Africa)

  • Which regions are analyzed in the report?

    • APAC, Europe, North America, South America and Middle East and Africa

  • What are the key growth drivers and market challenges?

    • Integration of industry 4.0 and smart valve automation technologies, Fragmented regulatory compliance and certification disparities

  • Who are the major players in the Sanitary Valves Market?

    • Adamant Valves, Alfa Laval AB, Ampco Pumps Co., Dover Corp., Evoguard GmbH, Flowserve Corp., FRISTAM Pumpen KG GmbH and Co., GEA Group AG, GEMU Group, Graco Inc., Grundfos Holding AS, Habonim Industrial Ltd., IDEX Corp., INOXPA SAU, ITT Inc., KSB SE and Co. KGaA, Pentair Plc, SPX FLOW Inc., Steriflow Valve, Valtorc International, Verder Group and Xylem Inc.

Market Research Insights

  • The market is defined by a strategic push toward auditable sustainability actions and advanced process control. The adoption of industrial internet of things sensors allows facilities to gather verifiable sustainability data, with some operations reducing water usage in cleaning cycles by up to 20%. This digital product passport framework enhances traceability, a key factor in biopharmaceutical fluid control.
  • For eco-friendly manufacturing processes, the focus is on energy-efficient pneumatic systems and sustainable lifecycle management. Investments in technologies that address geopolitical supply chain risk for high-grade specialty alloys are increasing, as sourcing disruptions can impact production schedules by over 30%. These dynamics reflect a market prioritizing operational resilience, compliance, and resource efficiency.

We can help! Our analysts can customize this sanitary valves market research report to meet your requirements.

Get in touch

1. Executive Summary

1.1 Market overview

Executive Summary - Chart on Market Overview
Executive Summary - Data Table on Market Overview
Executive Summary - Chart on Global Market Characteristics
Executive Summary - Chart on Market by Geography
Executive Summary - Chart on Market Segmentation by End-user
Executive Summary - Chart on Market Segmentation by Product
Executive Summary - Chart on Market Segmentation by Material
Executive Summary - Chart on Incremental Growth
Executive Summary - Data Table on Incremental Growth
Executive Summary - Chart on Company Market Positioning

2. Technavio Analysis

2.1 Analysis of price sensitivity, lifecycle, customer purchase basket, adoption rates, and purchase criteria

2.2 Criticality of inputs and Factors of differentiation

Chart on Overview on criticality of inputs and factors of differentiation

2.3 Factors of disruption

Chart on Overview on factors of disruption

2.4 Impact of drivers and challenges

Chart on Impact of drivers and challenges in 2025 and 2030

3. Market Landscape

3.1 Market ecosystem

Chart on Parent Market
Data Table on - Parent Market

3.2 Market characteristics

Chart on Market characteristics analysis

3.3 Value chain analysis

Chart on Value chain analysis

4. Market Sizing

4.1 Market definition

Data Table on Offerings of companies included in the market definition

4.2 Market segment analysis

Market segments

4.3 Market size 2025

4.4 Market outlook: Forecast for 2025-2030

Chart on Global - Market size and forecast 2025-2030 ($ million)
Data Table on Global - Market size and forecast 2025-2030 ($ million)
Chart on Global Market: Year-over-year growth 2025-2030 (%)
Data Table on Global Market: Year-over-year growth 2025-2030 (%)

5. Historic Market Size

5.1 Global Sanitary Valves Market 2020 - 2024

Historic Market Size - Data Table on Global Sanitary Valves Market 2020 - 2024 ($ million)

5.2 End-user segment analysis 2020 - 2024

Historic Market Size - End-user Segment 2020 - 2024 ($ million)

5.3 Product segment analysis 2020 - 2024

Historic Market Size - Product Segment 2020 - 2024 ($ million)

5.4 Material segment analysis 2020 - 2024

Historic Market Size - Material Segment 2020 - 2024 ($ million)

5.5 Geography segment analysis 2020 - 2024

Historic Market Size - Geography Segment 2020 - 2024 ($ million)

5.6 Country segment analysis 2020 - 2024

Historic Market Size - Country Segment 2020 - 2024 ($ million)

6. Qualitative Analysis

6.1 Impact of AI in Global Sanitary Valves Market

7. Five Forces Analysis

7.1 Five forces summary

Five forces analysis - Comparison between 2025 and 2030

7.2 Bargaining power of buyers

Bargaining power of buyers - Impact of key factors 2025 and 2030

7.3 Bargaining power of suppliers

Bargaining power of suppliers - Impact of key factors in 2025 and 2030

7.4 Threat of new entrants

Threat of new entrants - Impact of key factors in 2025 and 2030

7.5 Threat of substitutes

Threat of substitutes - Impact of key factors in 2025 and 2030

7.6 Threat of rivalry

Threat of rivalry - Impact of key factors in 2025 and 2030

7.7 Market condition

Chart on Market condition - Five forces 2025 and 2030

8. Market Segmentation by End-user

8.1 Market segments

Chart on End-user - Market share 2025-2030 (%)
Data Table on End-user - Market share 2025-2030 (%)

8.2 Comparison by End-user

Chart on Comparison by End-user
Data Table on Comparison by End-user

8.3 Pharmaceutical - Market size and forecast 2025-2030

Chart on Pharmaceutical - Market size and forecast 2025-2030 ($ million)
Data Table on Pharmaceutical - Market size and forecast 2025-2030 ($ million)
Chart on Pharmaceutical - Year-over-year growth 2025-2030 (%)
Data Table on Pharmaceutical - Year-over-year growth 2025-2030 (%)

8.4 Processed food - Market size and forecast 2025-2030

Chart on Processed food - Market size and forecast 2025-2030 ($ million)
Data Table on Processed food - Market size and forecast 2025-2030 ($ million)
Chart on Processed food - Year-over-year growth 2025-2030 (%)
Data Table on Processed food - Year-over-year growth 2025-2030 (%)

8.5 Beverages - Market size and forecast 2025-2030

Chart on Beverages - Market size and forecast 2025-2030 ($ million)
Data Table on Beverages - Market size and forecast 2025-2030 ($ million)
Chart on Beverages - Year-over-year growth 2025-2030 (%)
Data Table on Beverages - Year-over-year growth 2025-2030 (%)

8.6 Dairy - Market size and forecast 2025-2030

Chart on Dairy - Market size and forecast 2025-2030 ($ million)
Data Table on Dairy - Market size and forecast 2025-2030 ($ million)
Chart on Dairy - Year-over-year growth 2025-2030 (%)
Data Table on Dairy - Year-over-year growth 2025-2030 (%)

8.7 Others - Market size and forecast 2025-2030

Chart on Others - Market size and forecast 2025-2030 ($ million)
Data Table on Others - Market size and forecast 2025-2030 ($ million)
Chart on Others - Year-over-year growth 2025-2030 (%)
Data Table on Others - Year-over-year growth 2025-2030 (%)

8.8 Market opportunity by End-user

Market opportunity by End-user ($ million)
Data Table on Market opportunity by End-user ($ million)

9. Market Segmentation by Product

9.1 Market segments

Chart on Product - Market share 2025-2030 (%)
Data Table on Product - Market share 2025-2030 (%)

9.2 Comparison by Product

Chart on Comparison by Product
Data Table on Comparison by Product

9.3 Control valves - Market size and forecast 2025-2030

Chart on Control valves - Market size and forecast 2025-2030 ($ million)
Data Table on Control valves - Market size and forecast 2025-2030 ($ million)
Chart on Control valves - Year-over-year growth 2025-2030 (%)
Data Table on Control valves - Year-over-year growth 2025-2030 (%)

9.4 Double valves - Market size and forecast 2025-2030

Chart on Double valves - Market size and forecast 2025-2030 ($ million)
Data Table on Double valves - Market size and forecast 2025-2030 ($ million)
Chart on Double valves - Year-over-year growth 2025-2030 (%)
Data Table on Double valves - Year-over-year growth 2025-2030 (%)

9.5 Single valves - Market size and forecast 2025-2030

Chart on Single valves - Market size and forecast 2025-2030 ($ million)
Data Table on Single valves - Market size and forecast 2025-2030 ($ million)
Chart on Single valves - Year-over-year growth 2025-2030 (%)
Data Table on Single valves - Year-over-year growth 2025-2030 (%)

9.6 Butterfly valves - Market size and forecast 2025-2030

Chart on Butterfly valves - Market size and forecast 2025-2030 ($ million)
Data Table on Butterfly valves - Market size and forecast 2025-2030 ($ million)
Chart on Butterfly valves - Year-over-year growth 2025-2030 (%)
Data Table on Butterfly valves - Year-over-year growth 2025-2030 (%)

9.7 Others - Market size and forecast 2025-2030

Chart on Others - Market size and forecast 2025-2030 ($ million)
Data Table on Others - Market size and forecast 2025-2030 ($ million)
Chart on Others - Year-over-year growth 2025-2030 (%)
Data Table on Others - Year-over-year growth 2025-2030 (%)

9.8 Market opportunity by Product

Market opportunity by Product ($ million)
Data Table on Market opportunity by Product ($ million)

10. Market Segmentation by Material

10.1 Market segments

Chart on Material - Market share 2025-2030 (%)
Data Table on Material - Market share 2025-2030 (%)

10.2 Comparison by Material

Chart on Comparison by Material
Data Table on Comparison by Material

10.3 Stainless steel - Market size and forecast 2025-2030

Chart on Stainless steel - Market size and forecast 2025-2030 ($ million)
Data Table on Stainless steel - Market size and forecast 2025-2030 ($ million)
Chart on Stainless steel - Year-over-year growth 2025-2030 (%)
Data Table on Stainless steel - Year-over-year growth 2025-2030 (%)

10.4 Alloy steel - Market size and forecast 2025-2030

Chart on Alloy steel - Market size and forecast 2025-2030 ($ million)
Data Table on Alloy steel - Market size and forecast 2025-2030 ($ million)
Chart on Alloy steel - Year-over-year growth 2025-2030 (%)
Data Table on Alloy steel - Year-over-year growth 2025-2030 (%)

10.5 Plastic - Market size and forecast 2025-2030

Chart on Plastic - Market size and forecast 2025-2030 ($ million)
Data Table on Plastic - Market size and forecast 2025-2030 ($ million)
Chart on Plastic - Year-over-year growth 2025-2030 (%)
Data Table on Plastic - Year-over-year growth 2025-2030 (%)

10.6 Market opportunity by Material

Market opportunity by Material ($ million)
Data Table on Market opportunity by Material ($ million)

11. Customer Landscape

11.1 Customer landscape overview

Analysis of price sensitivity, lifecycle, customer purchase basket, adoption rates, and purchase criteria

12. Geographic Landscape

12.1 Geographic segmentation

Chart on Market share by geography 2025-2030 (%)
Data Table on Market share by geography 2025-2030 (%)

12.2 Geographic comparison

Chart on Geographic comparison
Data Table on Geographic comparison

12.3 APAC - Market size and forecast 2025-2030

Chart on APAC - Market size and forecast 2025-2030 ($ million)
Data Table on APAC - Market size and forecast 2025-2030 ($ million)
Chart on APAC - Year-over-year growth 2025-2030 (%)
Data Table on APAC - Year-over-year growth 2025-2030 (%)
Chart on Regional Comparison - APAC
Data Table on Regional Comparison - APAC

12.3.1 China - Market size and forecast 2025-2030

Chart on China - Market size and forecast 2025-2030 ($ million)
Data Table on China - Market size and forecast 2025-2030 ($ million)
Chart on China - Year-over-year growth 2025-2030 (%)
Data Table on China - Year-over-year growth 2025-2030 (%)

12.3.2 Japan - Market size and forecast 2025-2030

Chart on Japan - Market size and forecast 2025-2030 ($ million)
Data Table on Japan - Market size and forecast 2025-2030 ($ million)
Chart on Japan - Year-over-year growth 2025-2030 (%)
Data Table on Japan - Year-over-year growth 2025-2030 (%)

12.3.3 India - Market size and forecast 2025-2030

Chart on India - Market size and forecast 2025-2030 ($ million)
Data Table on India - Market size and forecast 2025-2030 ($ million)
Chart on India - Year-over-year growth 2025-2030 (%)
Data Table on India - Year-over-year growth 2025-2030 (%)

12.3.4 South Korea - Market size and forecast 2025-2030

Chart on South Korea - Market size and forecast 2025-2030 ($ million)
Data Table on South Korea - Market size and forecast 2025-2030 ($ million)
Chart on South Korea - Year-over-year growth 2025-2030 (%)
Data Table on South Korea - Year-over-year growth 2025-2030 (%)

12.3.5 Australia - Market size and forecast 2025-2030

Chart on Australia - Market size and forecast 2025-2030 ($ million)
Data Table on Australia - Market size and forecast 2025-2030 ($ million)
Chart on Australia - Year-over-year growth 2025-2030 (%)
Data Table on Australia - Year-over-year growth 2025-2030 (%)

12.3.6 Indonesia - Market size and forecast 2025-2030

Chart on Indonesia - Market size and forecast 2025-2030 ($ million)
Data Table on Indonesia - Market size and forecast 2025-2030 ($ million)
Chart on Indonesia - Year-over-year growth 2025-2030 (%)
Data Table on Indonesia - Year-over-year growth 2025-2030 (%)

12.4 Europe - Market size and forecast 2025-2030

Chart on Europe - Market size and forecast 2025-2030 ($ million)
Data Table on Europe - Market size and forecast 2025-2030 ($ million)
Chart on Europe - Year-over-year growth 2025-2030 (%)
Data Table on Europe - Year-over-year growth 2025-2030 (%)
Chart on Regional Comparison - Europe
Data Table on Regional Comparison - Europe

12.4.1 Germany - Market size and forecast 2025-2030

Chart on Germany - Market size and forecast 2025-2030 ($ million)
Data Table on Germany - Market size and forecast 2025-2030 ($ million)
Chart on Germany - Year-over-year growth 2025-2030 (%)
Data Table on Germany - Year-over-year growth 2025-2030 (%)

12.4.2 UK - Market size and forecast 2025-2030

Chart on UK - Market size and forecast 2025-2030 ($ million)
Data Table on UK - Market size and forecast 2025-2030 ($ million)
Chart on UK - Year-over-year growth 2025-2030 (%)
Data Table on UK - Year-over-year growth 2025-2030 (%)

12.4.3 France - Market size and forecast 2025-2030

Chart on France - Market size and forecast 2025-2030 ($ million)
Data Table on France - Market size and forecast 2025-2030 ($ million)
Chart on France - Year-over-year growth 2025-2030 (%)
Data Table on France - Year-over-year growth 2025-2030 (%)

12.4.4 Italy - Market size and forecast 2025-2030

Chart on Italy - Market size and forecast 2025-2030 ($ million)
Data Table on Italy - Market size and forecast 2025-2030 ($ million)
Chart on Italy - Year-over-year growth 2025-2030 (%)
Data Table on Italy - Year-over-year growth 2025-2030 (%)

12.4.5 Spain - Market size and forecast 2025-2030

Chart on Spain - Market size and forecast 2025-2030 ($ million)
Data Table on Spain - Market size and forecast 2025-2030 ($ million)
Chart on Spain - Year-over-year growth 2025-2030 (%)
Data Table on Spain - Year-over-year growth 2025-2030 (%)

12.4.6 The Netherlands - Market size and forecast 2025-2030

Chart on The Netherlands - Market size and forecast 2025-2030 ($ million)
Data Table on The Netherlands - Market size and forecast 2025-2030 ($ million)
Chart on The Netherlands - Year-over-year growth 2025-2030 (%)
Data Table on The Netherlands - Year-over-year growth 2025-2030 (%)

12.5 North America - Market size and forecast 2025-2030

Chart on North America - Market size and forecast 2025-2030 ($ million)
Data Table on North America - Market size and forecast 2025-2030 ($ million)
Chart on North America - Year-over-year growth 2025-2030 (%)
Data Table on North America - Year-over-year growth 2025-2030 (%)
Chart on Regional Comparison - North America
Data Table on Regional Comparison - North America

12.5.1 US - Market size and forecast 2025-2030

Chart on US - Market size and forecast 2025-2030 ($ million)
Data Table on US - Market size and forecast 2025-2030 ($ million)
Chart on US - Year-over-year growth 2025-2030 (%)
Data Table on US - Year-over-year growth 2025-2030 (%)

12.5.2 Canada - Market size and forecast 2025-2030

Chart on Canada - Market size and forecast 2025-2030 ($ million)
Data Table on Canada - Market size and forecast 2025-2030 ($ million)
Chart on Canada - Year-over-year growth 2025-2030 (%)
Data Table on Canada - Year-over-year growth 2025-2030 (%)

12.5.3 Mexico - Market size and forecast 2025-2030

Chart on Mexico - Market size and forecast 2025-2030 ($ million)
Data Table on Mexico - Market size and forecast 2025-2030 ($ million)
Chart on Mexico - Year-over-year growth 2025-2030 (%)
Data Table on Mexico - Year-over-year growth 2025-2030 (%)

12.6 South America - Market size and forecast 2025-2030

Chart on South America - Market size and forecast 2025-2030 ($ million)
Data Table on South America - Market size and forecast 2025-2030 ($ million)
Chart on South America - Year-over-year growth 2025-2030 (%)
Data Table on South America - Year-over-year growth 2025-2030 (%)
Chart on Regional Comparison - South America
Data Table on Regional Comparison - South America

12.6.1 Brazil - Market size and forecast 2025-2030

Chart on Brazil - Market size and forecast 2025-2030 ($ million)
Data Table on Brazil - Market size and forecast 2025-2030 ($ million)
Chart on Brazil - Year-over-year growth 2025-2030 (%)
Data Table on Brazil - Year-over-year growth 2025-2030 (%)

12.6.2 Argentina - Market size and forecast 2025-2030

Chart on Argentina - Market size and forecast 2025-2030 ($ million)
Data Table on Argentina - Market size and forecast 2025-2030 ($ million)
Chart on Argentina - Year-over-year growth 2025-2030 (%)
Data Table on Argentina - Year-over-year growth 2025-2030 (%)

12.6.3 Colombia - Market size and forecast 2025-2030

Chart on Colombia - Market size and forecast 2025-2030 ($ million)
Data Table on Colombia - Market size and forecast 2025-2030 ($ million)
Chart on Colombia - Year-over-year growth 2025-2030 (%)
Data Table on Colombia - Year-over-year growth 2025-2030 (%)

12.7 Middle East and Africa - Market size and forecast 2025-2030

Chart on Middle East and Africa - Market size and forecast 2025-2030 ($ million)
Data Table on Middle East and Africa - Market size and forecast 2025-2030 ($ million)
Chart on Middle East and Africa - Year-over-year growth 2025-2030 (%)
Data Table on Middle East and Africa - Year-over-year growth 2025-2030 (%)
Chart on Regional Comparison - Middle East and Africa
Data Table on Regional Comparison - Middle East and Africa

12.7.1 UAE - Market size and forecast 2025-2030

Chart on UAE - Market size and forecast 2025-2030 ($ million)
Data Table on UAE - Market size and forecast 2025-2030 ($ million)
Chart on UAE - Year-over-year growth 2025-2030 (%)
Data Table on UAE - Year-over-year growth 2025-2030 (%)

12.7.2 Saudi Arabia - Market size and forecast 2025-2030

Chart on Saudi Arabia - Market size and forecast 2025-2030 ($ million)
Data Table on Saudi Arabia - Market size and forecast 2025-2030 ($ million)
Chart on Saudi Arabia - Year-over-year growth 2025-2030 (%)
Data Table on Saudi Arabia - Year-over-year growth 2025-2030 (%)

12.7.3 South Africa - Market size and forecast 2025-2030

Chart on South Africa - Market size and forecast 2025-2030 ($ million)
Data Table on South Africa - Market size and forecast 2025-2030 ($ million)
Chart on South Africa - Year-over-year growth 2025-2030 (%)
Data Table on South Africa - Year-over-year growth 2025-2030 (%)

12.7.4 Egypt - Market size and forecast 2025-2030

Chart on Egypt - Market size and forecast 2025-2030 ($ million)
Data Table on Egypt - Market size and forecast 2025-2030 ($ million)
Chart on Egypt - Year-over-year growth 2025-2030 (%)
Data Table on Egypt - Year-over-year growth 2025-2030 (%)

12.7.5 Turkey - Market size and forecast 2025-2030

Chart on Turkey - Market size and forecast 2025-2030 ($ million)
Data Table on Turkey - Market size and forecast 2025-2030 ($ million)
Chart on Turkey - Year-over-year growth 2025-2030 (%)
Data Table on Turkey - Year-over-year growth 2025-2030 (%)

12.8 Market opportunity by geography

Market opportunity by geography ($ million)
Data Tables on Market opportunity by geography ($ million)

13. Drivers, Challenges, and Opportunity

13.1 Market drivers

Integration of industry 4.0 and smart valve automation technologies
Growth of sustainable manufacturing and eco-friendly material innovations
Expansion of biotechnology and biopharmaceutical manufacturing sector

13.2 Market challenges

Fragmented regulatory compliance and certification disparities
Operationalizing ESG and burden of auditable sustainability
Supply chain volatility and scarcity of high-grade specialty alloys

13.3 Impact of drivers and challenges

Impact of drivers and challenges in 2025 and 2030

13.4 Market opportunities

Adoption of single-use sterile valve technology in biopharmaceutical processing
Growth of craft brewery and boutique distillery segment
Implementation of additive manufacturing for complex valve geometries

14. Competitive Landscape

14.1 Overview

14.2

Overview on criticality of inputs and factors of differentiation

14.3 Landscape disruption

Overview on factors of disruption

14.4 Industry risks

Impact of key risks on business

15. Competitive Analysis

15.1 Companies profiled

Companies covered

15.2 Company ranking index

15.3 Market positioning of companies

Matrix on companies position and classification

15.4 Adamant Valves

Adamant Valves - Overview
Adamant Valves - Product / Service
Adamant Valves - Key offerings
SWOT

15.5 Alfa Laval AB

Alfa Laval AB - Overview
Alfa Laval AB - Business segments
Alfa Laval AB - Key news
Alfa Laval AB - Key offerings
Alfa Laval AB - Segment focus
SWOT

15.6 Ampco Pumps Co.

Ampco Pumps Co. - Overview
Ampco Pumps Co. - Product / Service
Ampco Pumps Co. - Key offerings
SWOT

15.7 Dover Corp.

Dover Corp. - Overview
Dover Corp. - Business segments
Dover Corp. - Key news
Dover Corp. - Key offerings
Dover Corp. - Segment focus
SWOT

15.8 Evoguard GmbH

Evoguard GmbH - Overview
Evoguard GmbH - Product / Service
Evoguard GmbH - Key offerings
SWOT

15.9 Flowserve Corp.

Flowserve Corp. - Overview
Flowserve Corp. - Business segments
Flowserve Corp. - Key offerings
Flowserve Corp. - Segment focus
SWOT

15.10 FRISTAM Pumpen KG GmbH and Co.

FRISTAM Pumpen KG GmbH and Co. - Overview
FRISTAM Pumpen KG GmbH and Co. - Product / Service
FRISTAM Pumpen KG GmbH and Co. - Key offerings
SWOT

15.11 GEA Group AG

GEA Group AG - Overview
GEA Group AG - Business segments
GEA Group AG - Key offerings
GEA Group AG - Segment focus
SWOT

15.12 GEMU Group

GEMU Group - Overview
GEMU Group - Product / Service
GEMU Group - Key offerings
SWOT

15.13 Habonim Industrial Ltd.

Habonim Industrial Ltd. - Overview
Habonim Industrial Ltd. - Product / Service
Habonim Industrial Ltd. - Key offerings
SWOT

15.14 INOXPA SAU

INOXPA SAU - Overview
INOXPA SAU - Product / Service
INOXPA SAU - Key offerings
SWOT

15.15 SPX FLOW Inc.

SPX FLOW Inc. - Overview
SPX FLOW Inc. - Product / Service
SPX FLOW Inc. - Key news
SPX FLOW Inc. - Key offerings
SWOT

15.16 Steriflow Valve

Steriflow Valve - Overview
Steriflow Valve - Product / Service
Steriflow Valve - Key offerings
SWOT

15.17 Valtorc International

Valtorc International - Overview
Valtorc International - Product / Service
Valtorc International - Key offerings
SWOT

15.18 Verder Group

Verder Group - Overview
Verder Group - Product / Service
Verder Group - Key offerings
SWOT

16. Appendix

16.1 Scope of the report

Market definition
Objectives
Notes and caveats

16.2 Inclusions and exclusions checklist

Inclusions checklist
Exclusions checklist

16.3 Currency conversion rates for US$

16.4 Research methodology

16.5 Data procurement

Information sources

16.6 Data validation

16.7 Validation techniques employed for market sizing

16.8 Data synthesis

16.9 360 degree market analysis

16.10 List of abbreviations

Research Methodology

Technavio presents a detailed picture of the market by way of study, synthesis, and summation of data from multiple sources. The analysts have presented the various facets of the market with a particular focus on identifying the key industry influencers. The data thus presented is comprehensive, reliable, and the result of extensive research, both primary and secondary.

INFORMATION SOURCES

Primary sources

  • Manufacturers and suppliers
  • Channel partners
  • Industry experts
  • Strategic decision makers

Secondary sources

  • Industry journals and periodicals
  • Government data
  • Financial reports of key industry players
  • Historical data
  • Press releases

DATA ANALYSIS

Data Synthesis

  • Collation of data
  • Estimation of key figures
  • Analysis of derived insights

Data Validation

  • Triangulation with data models
  • Reference against proprietary databases
  • Corroboration with industry experts

REPORT WRITING

Qualitative

  • Market drivers
  • Market challenges
  • Market trends
  • Five forces analysis

Quantitative

  • Market size and forecast
  • Market segmentation
  • Geographical insights
  • Competitive landscape

Interested in this report?

Get your sample now to see our research methodology and insights!

Download Now

Frequently Asked Questions

Sanitary Valves market growth will increase by USD 868.4 million during 2026-2030.

The Sanitary Valves market is expected to grow at a CAGR of 6.4% during 2026-2030.

Sanitary Valves market is segmented by End-user (Pharmaceutical, Processed food, Beverages, Dairy, Others) Product (Control valves, Double valves, Single valves, Butterfly valves, Others) Material (Stainless steel, Alloy steel, Plastic)

Adamant Valves, Alfa Laval AB, Ampco Pumps Co., Dover Corp., Evoguard GmbH, Flowserve Corp., FRISTAM Pumpen KG GmbH and Co., GEA Group AG, GEMU Group, Graco Inc., Grundfos Holding AS, Habonim Industrial Ltd., IDEX Corp., INOXPA SAU, ITT Inc., KSB SE and Co. KGaA, Pentair Plc, SPX FLOW Inc., Steriflow Valve, Valtorc International, Verder Group, Xylem Inc. are a few of the key vendors in the Sanitary Valves market.

APAC will register the highest growth rate of 50.4% among the other regions. Therefore, the Sanitary Valves market in APAC is expected to garner significant business opportunities for the vendors during the forecast period.

China, Japan, India, South Korea, Australia, Indonesia, Germany, UK, France, Italy, Spain, The Netherlands, US, Canada, Mexico, Brazil, Argentina, Colombia, UAE, Saudi Arabia, South Africa, Egypt, Turkey

  • Integration of industry 4.0 and smart valve automation technologies is the driving factor this market.

The Sanitary Valves market vendors should focus on grabbing business opportunities from the End-user segment as it accounted for the largest market share in the base year.