Europe - Satellite-based Earth Observation (EO) Market by Application and Type - Forecast and Analysis 2024-2028

Europe - Satellite-based Earth Observation (EO) Market by Application and Type - Forecast and Analysis 2024-2028

Published: Oct 2023 166 Pages SKU: IRTNTR72564

Market Overview at a Glance

$1.68 B
Market Opportunity
10.44%
CAGR
9.55
YoY growth 2023-2024(%)

Europe Satellite-based Earth Observation Market Size 2024-2028

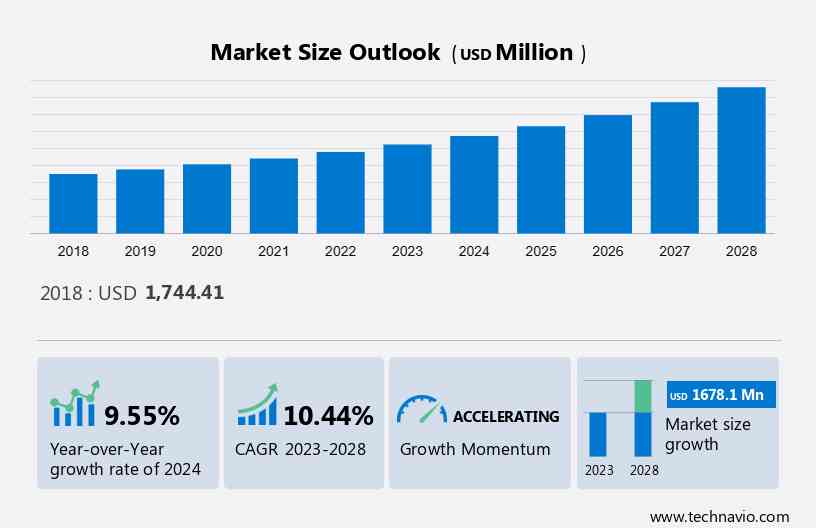
The Europe Satellite-based Earth Observation Market size is estimated to grow by USD 1.67 billion at a CAGR of 10.44% between 2023 and 2028. The market is experiencing significant growth, driven by several key factors. Firstly, the increasing utilization of satellites for environmental monitoring to assess natural resources, climate change, and disaster management is a major catalyst. Secondly, escalating investments in space programs by European governments and private entities are fueling market expansion. Lastly, technological advancements in SatEO, such as high-resolution imaging and real-time data processing, are attracting new players and applications. These factors collectively contribute to the robust growth of the European SatEO market. Our report examines historical data from 2018 - 2022, besides analyzing the current market scenario.

What will be the size of the Europe Satellite-based Earth Observation Market During the Forecast Period?

Satellite-based Earth Observation Market in Europe Size

Europe Satellite-based Earth Observation (EO) Market Forecast 2024-2028

To learn more about this report,  Request Free Sample

Market Segmentation 

Application Segment Analysis:

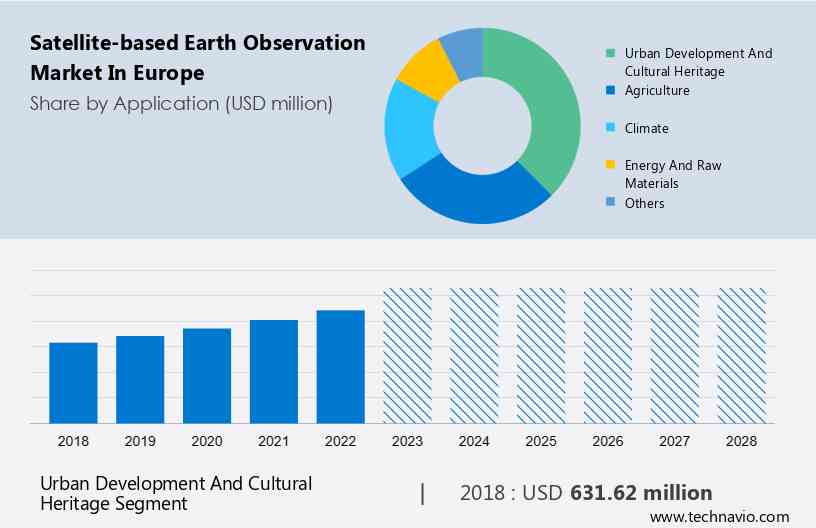
The urban development and cultural heritage segment is estimated to witness significant growth during the forecast period. The urban development and cultural heritage segment plays a crucial role in the earth observation market. Urban development and cultural heritage segments focus on using satellite imagery and data to monitor and manage urban growth, infrastructure expansion, and the preservation of cultural heritage sites.

Satellite-based Earth Observation Market in Europe Size

Get a Customised Report as per your requirements

The urban development and cultural heritage segment was the largest and was valued at USD 631.62 million in 2018.  Additionally, satellite data can be used to monitor and assess the impact of climate change on cultural heritage sites. Rising sea levels, increased flooding, and extreme weather events pose risks to coastal and low-lying cultural sites. Satellite images can provide valuable information on erosion, land subsidence, and encroachment, allowing authorities to implement appropriate measures and mitigate risks. The Cultural Heritage Agency of the Netherlands utilizes satellite-based earth observation to monitor historical sites and landscapes, including fortifications, castles, and archaeological sites which results in Europe - satellite-based earth observation (EO) market expansions . Thus, such advantages are expected to increase the adoption of satellite-based earth observation in the urban development and cultural heritage segment, which will propel the growth of the urban development and cultural heritage segment in the Europe - satellite-based earth observation marke during the forecast period.

Type Segment Analysis:

Based on type, the market has been segmented into VAS and data. The VAS segment will account for the largest share of this segment.?The VAS segment plays a crucial role in the Europe - satellite-based earth observation (EO) market. These services go beyond the provision of raw satellite data and offer additional insights, analysis, and tailored solutions to meet the specific needs of customers. Furthermore, VAS enables the monitoring of solar power plants and wind farms, ensuring optimal performance, fault detection, and maintenance planning. By leveraging these VAS, renewable energy companies can maximize their energy generation capacity and improve overall operational efficiency. Thus, the abovementioned advantages are expected to increase the adoption of VAS in satellite-based earth observation, which will propel the growth of the VAS segment in the satellite-based earth observation market in Europe during the forecast period.

Market Dynamics

The satellite-based Earth observation market employs remote sensing technique to explore various aspects of the planet, including its chemical aspects of earth, physical aspects of earth, and biological aspects of earth. These satellites are instrumental in monitoring environmental change and supporting initiatives like urban development and smart city initiatives. They aid in map making, weather, and terrain mapping, as well as tracking phenomena such as deforestation and monitoring agricultural health. Additionally, they provide valuable data on ocean salinity, ice thickness, and air quality, contributing to environmental monitoring efforts. Utilizing satellite data and open-source data, these systems operate for non-military purposes, serving meteorology, cartography, and more. As they orbit the Earth, they play a crucial role in advancing our understanding of the world and promoting sustainable development across various sectors, including infrastructure facilities, agriculture, and defense. Our researchers studied the data for years, with 2023 as the base year and 2024 as the estimated year, and presented the key drivers, trends, and challenges for the market.   

Key Market Driver - Rise in spending on space programs and entry of private players

The rise in government funding for space programs is expected to be a major factor that will impact the Europe - satellite-based earth observation market t. The entry into force of the Space Regulation brought many structural changes to the EU Space Programme and led to the creation of the EU Agency for the Space Programme (EUSPA). Furthermore, with the entry of various private players in satellite industries, the demand for satellite-based earth observation solutions is expected to increase substantially during the forecast period. Private players, including SpaceX, Orbital Sciences, and Airbus, have made low-cost orbital launches possible.

For instance, In H2 20221, ESA announced a new mission to discover earth-like planets. It's the third exoplanet exploration mission of ESA, with European aerospace company Airbus securing the contract to build the satellite. This makes it easier for service providers and operators to set up satellite-based infrastructure for earth observation which can have a positive impact on market growth. Thus, the above-mentioned factor is expected to increase the demand for satellite-based earth observation, which will drive the growth of the market during the forecast period.

Significant Market Trends - Increased use of satellite-based earth observation in transportation and disaster management

Satellite-based earth observation has found significant applications in aerospace and maritime surveillance and intelligence in the commercial industry. Satellite-based earth observation satellites and SAR instruments are widely used for providing oceanic imagery, traffic data, and route charting. SAR is a form of radar that is used to create 2D and 3D images of objects on the Earth's surface. The instrument is widely used to determine the geographical location of a ship in the open sea, apart from real-time monitoring of ships, critical route identification in case of emergencies, sea ice monitoring, detection of oil spills, and strategic surveillance. Satellites such as TerraS AR-X (Germany), Radarsat-2 (Canada), and Sentinel-1 (ESA) are used to provide images for maritime surveillance globally.

However, with the growing severity of natural disasters globally, governments are increasingly adopting satellite-based earth observation for the early detection of disasters, formulation of disaster management strategies, and relief and assistance efforts. Satellite-based earth observation can be effectively used for detecting floods, droughts, tsunamis, and forest fires which may support market  growth. Thus, the above-mentioned factor is expected to increase the demand for satellite-based earth observation, which will propel the market growth during the forecast period.

Major Market Challenge - Regulatory hurdles and interoperability issues

Satellite operators are required to follow an established regulatory and communication framework set by a country or region. As most countries have their own framework for satellite communication, there is often a lack of standardization or conformity among operators from different countries. This results in interoperability issues when working with cross-country or regional platforms. Most countries implement their own data strategies for sensitive data, such as satellite imaging and geographical features, and may restrict access to competitors. This challenge increases in complexity as the number of intermediaries involved in the generation of observation data and its modification increases.

In addition, the lack of a standardized framework to integrate or share data from various satellites affects the coordination among databases. Though the standards of operation within most EU countries are uniform due to joint project development and launch, which are mainly carried out under the purview of the ESA, data and service providers and satellite operators outside the EU may face challenges when entering the market which can limit earth observation market growth. Thus, such factors are expected to negatively impact the growth of the market in focus during the forecast period.

Who are the Major Europe Satellite-based Earth Observation (EO) Market Companies?

Companies are implementing various strategies, such as strategic alliances, partnerships, mergers and acquisitions, geographical expansion, and product/service launches, to enhance their presence in the market.

ACRI ST - The company offers satellite based earth observation system that provides solutions for satellite mission simulations and environmental forecast prototyping, provides decision making support to public agencies and local authorities, and operates environmental data centers.

We also have detailed analyses of the market’s competitive landscape and offer information on 20 market companies, including:

ACRI ST, Airbus SE, Antrix Corp. Ltd., Assimila Ltd., BAE Systems Plc, BMT Group Ltd., CGI Inc., cloudeo AG, Eagle View Technologies Inc., EarthDaily Analytics, Geoimage, GeoOptics Inc., Global Surface Intelligence Ltd., Imagesat International I.S.I Ltd., Kleos Space S.A., Lockheed Martin Corp., Maxar Technologies Inc., OHB System AG, Orbital Insight Inc., and Thales Group 

Technavio report provides an in-depth analysis of the market and its players through combined qualitative and quantitative data. The analysis classifies companies into categories based on their business approaches, including pure-play, category-focused, industry-focused, and diversified. Companies are specially categorized into dominant, leading, strong, tentative, and weak, based on their quantitative data analysis.  

Segment Overview

The market research report provides comprehensive data (region wise segment analysis), with forecasts and estimates in "USD Billion" for the period 2024 to 2028, as well as historical data from 2018 to 2022 for the following segments

  • Application Outlook
    • Urban development and cultural heritage
    • Agriculture
    • Climate
    • Energy and raw materials
    • Others
  • Type Outlook 
    • VAS
    • Data

You may also be interested in:

  • Satellite-based Earth Observation Market - Satellite-based Earth Observation Market Analysis North America, APAC, Europe, South America, Middle East and Africa - US, Canada, China, Russia, UK - Size and Forecast 
  • Satellite Market - Satellite Market Analysis North America, Europe, APAC, Middle East and Africa, South America - US, China, Japan, Russia, France - Size and Forecast
  • Satellite Manufacturing and Launch Market - Satellite Manufacturing and Launch Market Analysis North America, Europe, APAC, South America, Middle East and Africa - US, China, Canada, UK, Germany - Size and Forecast

Market Analyst Overview

The market in Europe is pivotal in monitoring environmental change and facilitating map making through advanced remote sensing techniques. It provides invaluable insights into the chemical, physical, and biological aspects of the Earth, aiding in weather and terrain mapping and supporting reconnaissance and intelligence missions. Furthermore, it plays a crucial role in agricultural monitoring and management and offers high-resolution imaging services for various sectors, including civil engineering, construction, real estate, and infrastructure planning. With advancements in earth observation technology, such as hyperspectral and multispectral imaging, and the utilization of big data analytics, the market continues to expand, catering to diverse applications in environmental monitoring, defense, agriculture, urban planning, and more.

Additionally, the market offers a comprehensive suite of solutions leveraging remote sensing techniques to monitor the chemical, physical, and biological aspects of the Earth. With advanced technologies like synthetic aperture radar imagery and hyperspectral imaging, it serves diverse sectors including the defense and intelligence communities, facilitating border monitoring and supporting military missions. Enabled by big data technology, the market provides accurate insights on Earth observation data, offering high-resolution imaging services and addressing challenges such as the volume of data in heterogeneous formats. Utilizing small satellites and launch systems technologies, it caters to applications ranging from civil engineering and construction to agriculture and forestry, supporting infrastructure planning, vegetation monitoring, and deforestation prevention. Additionally, the market aids in traffic management, fleet tracking, and real estate and insurance sectors, contributing to smart city initiatives and leveraging open source data to enhance environmental monitoring and surveillance capabilities. With a focus on innovation and mass production of low-cost manufacturing satellites, it continues to drive advancements in satellite analytics and unmanned aircraft systems, catering to various industries and applications worldwide.

The market harnesses remote sensing techniques to explore various aspects of the Earth, including its chemical, physical, and biological compositions. It supports diverse applications such as infrastructure facilities, environmental monitoring, and meteorology through advanced technologies and satellite-based Earth observation systems. These satellites aid in map making, weather and terrain mapping, and monitoring phenomena like deforestation and agricultural health. Additionally, they provide valuable data on ocean salinity, ice thickness, and air quality, contributing to environmental change studies and urban development initiatives such as smart city initiatives. Enabled by open source data and advancements in cartography, the market fosters collaboration across sectors for non-military purposes and promotes sustainable development. As Earth observation satellites orbit the planet, they play a pivotal role in enhancing our understanding of the world, driving innovation, and supporting efforts towards environmental conservation and urban planning.

Europe Satellite-based Earth Observation (EO) Market Scope

Report Coverage

Details

Page number

166

Base year

2023

Historic period

2018-2022

Forecast period

2024-2028

Growth momentum & CAGR

Accelerate at a CAGR of 10.44%

Market Growth 2024-2028

USD 1.67 Billion

Market structure

Fragmented

YoY growth 2023-2024(%)

9.55

Competitive landscape

Leading Companies, Market Positioning of Companies, Competitive Strategies, and Industry Risks

Key companies profiled

ACRI ST, Airbus SE, Antrix Corp. Ltd., Assimila Ltd., BAE Systems Plc, BMT Group Ltd., CGI Inc., cloudeo AG, Eagle View Technologies Inc., EarthDaily Analytics, Geoimage, GeoOptics Inc., Global Surface Intelligence Ltd., Imagesat International I.S.I Ltd., Kleos Space S.A., Lockheed Martin Corp., Maxar Technologies Inc., OHB System AG, Orbital Insight Inc., and Thales Group

Market dynamics

Parent market analysis, market forecasting, Market growth inducers and obstacles, Fast-growing and slow-growing segment analysis, COVID-19 impact and recovery analysis and future consumer dynamics, Market condition analysis for the market forecast period. 

Customization purview

If our market report has not included the data that you are looking for, you can reach out to our analysts and get segments customized.

Request Sample PDF 

What are the Key Data Covered in this Research Report?

  • CAGR of the market during the forecast period
  • Detailed information on factors that will drive the market growth and forecasting of the market between 2024 and 2028
  • Precise estimation of the size of the market size and its contribution to the parent market
  • Accurate predictions about upcoming market trends and analysis and changes in consumer behavior
  • Growth of the market industry across Europe
  • Thorough market growth analysis of the market’s competitive landscape and detailed information about vendors
  • Comprehensive market analysis and report on the factors that will challenge the market research and growth of market companies

We can help! Our analysts can customize this market research report to meet your requirements. Get in touch

1 Executive Summary

  • 1.1 Market overview
    • Exhibit 01: Executive Summary – Chart on Market Overview
    • Exhibit 02: Executive Summary – Data Table on Market Overview
    • Exhibit 03: Executive Summary – Chart on Country Market Characteristics
    • Exhibit 04: Executive Summary – Chart on Market by Geography
    • Exhibit 05: Executive Summary – Chart on Market Segmentation by Application
    • Exhibit 06: Executive Summary – Chart on Market Segmentation by Type
    • Exhibit 07: Executive Summary – Chart on Incremental Growth
    • Exhibit 08: Executive Summary – Data Table on Incremental Growth
    • Exhibit 09: Executive Summary – Chart on Vendor Market Positioning

2 Market Landscape

  • 2.1 Market ecosystem
    • Exhibit 10: Parent market
    • Exhibit 11: Market Characteristics

3 Market Sizing

  • 3.1 Market definition
    • Exhibit 12: Offerings of vendors included in the market definition
  • 3.2 Market segment analysis
    • Exhibit 13: Market segments
  • 3.3 Market size 2023
    • 3.4 Market outlook: Forecast for 2023-2028
      • Exhibit 14: Chart on Europe - Market size and forecast 2023-2028 ($ million)
      • Exhibit 15: Data Table on Regional - Market size and forecast 2023-2028 ($ million)
      • Exhibit 16: Chart on Europe: Year-over-year growth 2023-2028 (%)
      • Exhibit 17: Data Table on Regional - Market size and forecast 2023-2028 ($ million)

    4 Historic Market Size

    • 4.1 Satellite-based earth observation market in Europe 2018 - 2022
      • Exhibit 18: Historic Market Size – Data Table on satellite-based earth observation market in Europe 2018 - 2022 ($ million)
    • 4.2 Application Segment Analysis 2018 - 2022
      • Exhibit 19: Historic Market Size – Application Segment 2018 - 2022 ($ million)
    • 4.3 Type Segment Analysis 2018 - 2022
      • Exhibit 20: Historic Market Size – Type Segment 2018 - 2022 ($ million)
    • 4.4 Geography Segment Analysis 2018 - 2022
      • Exhibit 21: Historic Market Size – Geography Segment 2018 - 2022 ($ million)

    5 Five Forces Analysis

    • 5.1 Five forces summary
      • Exhibit 22: Five forces analysis - Comparison between 2023 and 2028
    • 5.2 Bargaining power of buyers
      • Exhibit 23: Chart on Bargaining power of buyers – Impact of key factors 2023 and 2028
    • 5.3 Bargaining power of suppliers
      • Exhibit 24: Bargaining power of suppliers – Impact of key factors in 2023 and 2028
    • 5.4 Threat of new entrants
      • Exhibit 25: Threat of new entrants – Impact of key factors in 2023 and 2028
    • 5.5 Threat of substitutes
      • Exhibit 26: Threat of substitutes – Impact of key factors in 2023 and 2028
    • 5.6 Threat of rivalry
      • Exhibit 27: Threat of rivalry – Impact of key factors in 2023 and 2028
    • 5.7 Market condition
      • Exhibit 28: Chart on Market condition - Five forces 2023 and 2028

    6 Market Segmentation by Application

    • 6.1 Market segments
      • Exhibit 29: Chart on Application - Market share 2023-2028 (%)
      • Exhibit 30: Data Table on Application - Market share 2023-2028 (%)
    • 6.2 Comparison by Application
      • Exhibit 31: Chart on Comparison by Application
      • Exhibit 32: Data Table on Comparison by Application
    • 6.3 Urban development and cultural heritage - Market size and forecast 2023-2028
      • Exhibit 33: Chart on Urban development and cultural heritage - Market size and forecast 2023-2028 ($ million)
      • Exhibit 34: Data Table on Urban development and cultural heritage - Market size and forecast 2023-2028 ($ million)
      • Exhibit 35: Chart on Urban development and cultural heritage - Year-over-year growth 2023-2028 (%)
      • Exhibit 36: Data Table on Urban development and cultural heritage - Year-over-year growth 2023-2028 (%)
    • 6.4 Agriculture - Market size and forecast 2023-2028
      • Exhibit 37: Chart on Agriculture - Market size and forecast 2023-2028 ($ million)
      • Exhibit 38: Data Table on Agriculture - Market size and forecast 2023-2028 ($ million)
      • Exhibit 39: Chart on Agriculture - Year-over-year growth 2023-2028 (%)
      • Exhibit 40: Data Table on Agriculture - Year-over-year growth 2023-2028 (%)
    • 6.5 Climate - Market size and forecast 2023-2028
      • Exhibit 41: Chart on Climate - Market size and forecast 2023-2028 ($ million)
      • Exhibit 42: Data Table on Climate - Market size and forecast 2023-2028 ($ million)
      • Exhibit 43: Chart on Climate - Year-over-year growth 2023-2028 (%)
      • Exhibit 44: Data Table on Climate - Year-over-year growth 2023-2028 (%)
    • 6.6 Energy and raw materials - Market size and forecast 2023-2028
      • Exhibit 45: Chart on Energy and raw materials - Market size and forecast 2023-2028 ($ million)
      • Exhibit 46: Data Table on Energy and raw materials - Market size and forecast 2023-2028 ($ million)
      • Exhibit 47: Chart on Energy and raw materials - Year-over-year growth 2023-2028 (%)
      • Exhibit 48: Data Table on Energy and raw materials - Year-over-year growth 2023-2028 (%)
    • 6.7 Others - Market size and forecast 2023-2028
      • Exhibit 49: Chart on Others - Market size and forecast 2023-2028 ($ million)
      • Exhibit 50: Data Table on Others - Market size and forecast 2023-2028 ($ million)
      • Exhibit 51: Chart on Others - Year-over-year growth 2023-2028 (%)
      • Exhibit 52: Data Table on Others - Year-over-year growth 2023-2028 (%)
    • 6.8 Market opportunity by Application
      • Exhibit 53: Market opportunity by Application ($ million)
      • Exhibit 54: Data Table on Market opportunity by Application ($ million)

    7 Market Segmentation by Type

    • 7.1 Market segments
      • Exhibit 55: Chart on Type - Market share 2023-2028 (%)
      • Exhibit 56: Data Table on Type - Market share 2023-2028 (%)
    • 7.2 Comparison by Type
      • Exhibit 57: Chart on Comparison by Type
      • Exhibit 58: Data Table on Comparison by Type
    • 7.3 VAS - Market size and forecast 2023-2028
      • Exhibit 59: Chart on VAS - Market size and forecast 2023-2028 ($ million)
      • Exhibit 60: Data Table on VAS - Market size and forecast 2023-2028 ($ million)
      • Exhibit 61: Chart on VAS - Year-over-year growth 2023-2028 (%)
      • Exhibit 62: Data Table on VAS - Year-over-year growth 2023-2028 (%)
    • 7.4 Data - Market size and forecast 2023-2028
      • Exhibit 63: Chart on Data - Market size and forecast 2023-2028 ($ million)
      • Exhibit 64: Data Table on Data - Market size and forecast 2023-2028 ($ million)
      • Exhibit 65: Chart on Data - Year-over-year growth 2023-2028 (%)
      • Exhibit 66: Data Table on Data - Year-over-year growth 2023-2028 (%)
    • 7.5 Market opportunity by Type
      • Exhibit 67: Market opportunity by Type ($ million)
      • Exhibit 68: Data Table on Market opportunity by Type ($ million)

    8 Customer Landscape

    • 8.1 Customer landscape overview
      • Exhibit 69: Analysis of price sensitivity, lifecycle, customer purchase basket, adoption rates, and purchase criteria

    9 Geographic Landscape

    • 9.1 Geographic segmentation
      • Exhibit 70: Chart on Market share by geography - 2023-2028 (%)
      • Exhibit 71: Data Table on Market share by geography - 2023-2028 (%)
    • 9.2 Geographic comparison
      • Exhibit 72: Chart on Geographic comparison
      • Exhibit 73: Data Table on Geographic comparison
    • 9.3 Russia - Market size and forecast 2023-2028
      • Exhibit 74: Chart on Russia - Market size and forecast 2023-2028 ($ million)
      • Exhibit 75: Data Table on Russia - Market size and forecast 2023-2028 ($ million)
      • Exhibit 76: Chart on Russia - Year-over-year growth 2023-2028 (%)
      • Exhibit 77: Data Table on Russia - Year-over-year growth 2023-2028 (%)
    • 9.4 UK - Market size and forecast 2023-2028
      • Exhibit 78: Chart on UK - Market size and forecast 2023-2028 ($ million)
      • Exhibit 79: Data Table on UK - Market size and forecast 2023-2028 ($ million)
      • Exhibit 80: Chart on UK - Year-over-year growth 2023-2028 (%)
      • Exhibit 81: Data Table on UK - Year-over-year growth 2023-2028 (%)
    • 9.5 Germany - Market size and forecast 2023-2028
      • Exhibit 82: Chart on Germany - Market size and forecast 2023-2028 ($ million)
      • Exhibit 83: Data Table on Germany - Market size and forecast 2023-2028 ($ million)
      • Exhibit 84: Chart on Germany - Year-over-year growth 2023-2028 (%)
      • Exhibit 85: Data Table on Germany - Year-over-year growth 2023-2028 (%)
    • 9.6 France - Market size and forecast 2023-2028
      • Exhibit 86: Chart on France - Market size and forecast 2023-2028 ($ million)
      • Exhibit 87: Data Table on France - Market size and forecast 2023-2028 ($ million)
      • Exhibit 88: Chart on France - Year-over-year growth 2023-2028 (%)
      • Exhibit 89: Data Table on France - Year-over-year growth 2023-2028 (%)
    • 9.7 Rest of Europe - Market size and forecast 2023-2028
      • Exhibit 90: Chart on Rest of Europe - Market size and forecast 2023-2028 ($ million)
      • Exhibit 91: Data Table on Rest of Europe - Market size and forecast 2023-2028 ($ million)
      • Exhibit 92: Chart on Rest of Europe - Year-over-year growth 2023-2028 (%)
      • Exhibit 93: Data Table on Rest of Europe - Year-over-year growth 2023-2028 (%)
    • 9.8 Market opportunity by geography
      • Exhibit 94: Market opportunity by geography ($ million)
      • Exhibit 95: Data Table on Market opportunity by geography ($ million)

    10 Drivers, Challenges, and Trends

    • 10.1 Market drivers
      • 10.2 Market challenges
        • 10.3 Impact of drivers and challenges
          • Exhibit 96: Impact of drivers and challenges in 2023 and 2028
        • 10.4 Market trends

          11 Vendor Landscape

          • 11.1 Overview
            • 11.2 Vendor landscape
              • Exhibit 97: Overview on Criticality of inputs and Factors of differentiation
            • 11.3 Landscape disruption
              • Exhibit 98: Overview on factors of disruption
            • 11.4 Industry risks
              • Exhibit 99: Impact of key risks on business

            12 Vendor Analysis

            • 12.1 Vendors covered
              • Exhibit 100: Vendors covered
            • 12.2 Market positioning of vendors
              • Exhibit 101: Matrix on vendor position and classification
            • 12.3 ACRI ST
              • Exhibit 102: ACRI ST - Overview
              • Exhibit 103: ACRI ST - Product / Service
              • Exhibit 104: ACRI ST - Key offerings
            • 12.4 Airbus SE
              • Exhibit 105: Airbus SE - Overview
              • Exhibit 106: Airbus SE - Business segments
              • Exhibit 107: Airbus SE - Key news
              • Exhibit 108: Airbus SE - Key offerings
              • Exhibit 109: Airbus SE - Segment focus
            • 12.5 Antrix Corp. Ltd.
              • Exhibit 110: Antrix Corp. Ltd. - Overview
              • Exhibit 111: Antrix Corp. Ltd. - Product / Service
              • Exhibit 112: Antrix Corp. Ltd. - Key offerings
            • 12.6 Assimila Ltd.
              • Exhibit 113: Assimila Ltd. - Overview
              • Exhibit 114: Assimila Ltd. - Product / Service
              • Exhibit 115: Assimila Ltd. - Key offerings
            • 12.7 BAE Systems Plc
              • Exhibit 116: BAE Systems Plc - Overview
              • Exhibit 117: BAE Systems Plc - Business segments
              • Exhibit 118: BAE Systems Plc - Key offerings
              • Exhibit 119: BAE Systems Plc - Segment focus
            • 12.8 BMT Group Ltd.
              • Exhibit 120: BMT Group Ltd. - Overview
              • Exhibit 121: BMT Group Ltd. - Product / Service
              • Exhibit 122: BMT Group Ltd. - Key offerings
            • 12.9 CGI Inc.
              • Exhibit 123: CGI Inc. - Overview
              • Exhibit 124: CGI Inc. - Business segments
              • Exhibit 125: CGI Inc. - Key news
              • Exhibit 126: CGI Inc. - Key offerings
              • Exhibit 127: CGI Inc. - Segment focus
            • 12.10 cloudeo AG
              • Exhibit 128: cloudeo AG - Overview
              • Exhibit 129: cloudeo AG - Product / Service
              • Exhibit 130: cloudeo AG - Key offerings
            • 12.11 Eagle View Technologies Inc.
              • Exhibit 131: Eagle View Technologies Inc. - Overview
              • Exhibit 132: Eagle View Technologies Inc. - Product / Service
              • Exhibit 133: Eagle View Technologies Inc. - Key offerings
            • 12.12 EarthDaily Analytics
              • Exhibit 134: EarthDaily Analytics - Overview
              • Exhibit 135: EarthDaily Analytics - Key offerings
            • 12.13 Geoimage
              • Exhibit 136: Geoimage - Overview
              • Exhibit 137: Geoimage - Product / Service
              • Exhibit 138: Geoimage - Key offerings
            • 12.14 GeoOptics Inc.
              • Exhibit 139: GeoOptics Inc. - Overview
              • Exhibit 140: GeoOptics Inc. - Product / Service
              • Exhibit 141: GeoOptics Inc. - Key offerings
            • 12.15 Imagesat International I.S.I Ltd.
              • Exhibit 142: Imagesat International I.S.I Ltd. - Overview
              • Exhibit 143: Imagesat International I.S.I Ltd. - Product / Service
              • Exhibit 144: Imagesat International I.S.I Ltd. - Key offerings
            • 12.16 Maxar Technologies Inc.
              • Exhibit 145: Maxar Technologies Inc. - Overview
              • Exhibit 146: Maxar Technologies Inc. - Business segments
              • Exhibit 147: Maxar Technologies Inc. - Key offerings
              • Exhibit 148: Maxar Technologies Inc. - Segment focus
            • 12.17 Thales Group
              • Exhibit 149: Thales Group - Overview
              • Exhibit 150: Thales Group - Business segments
              • Exhibit 151: Thales Group - Key news
              • Exhibit 152: Thales Group - Key offerings
              • Exhibit 153: Thales Group - Segment focus

            13 Appendix

            • 13.1 Scope of the report
              • 13.2 Inclusions and exclusions checklist
                • Exhibit 154: Inclusions checklist
                • Exhibit 155: Exclusions checklist
              • 13.3 Currency conversion rates for US$
                • Exhibit 156: Currency conversion rates for US$
              • 13.4 Research methodology
                • Exhibit 157: Research methodology
                • Exhibit 158: Validation techniques employed for market sizing
                • Exhibit 159: Information sources
              • 13.5 List of abbreviations
                • Exhibit 160: List of abbreviations

              Research Methodology

              Technavio presents a detailed picture of the market by way of study, synthesis, and summation of data from multiple sources. The analysts have presented the various facets of the market with a particular focus on identifying the key industry influencers. The data thus presented is comprehensive, reliable, and the result of extensive research, both primary and secondary.

              INFORMATION SOURCES

              Primary sources

              • Manufacturers and suppliers
              • Channel partners
              • Industry experts
              • Strategic decision makers

              Secondary sources

              • Industry journals and periodicals
              • Government data
              • Financial reports of key industry players
              • Historical data
              • Press releases

              DATA ANALYSIS

              Data Synthesis

              • Collation of data
              • Estimation of key figures
              • Analysis of derived insights

              Data Validation

              • Triangulation with data models
              • Reference against proprietary databases
              • Corroboration with industry experts

              REPORT WRITING

              Qualitative

              • Market drivers
              • Market challenges
              • Market trends
              • Five forces analysis

              Quantitative

              • Market size and forecast
              • Market segmentation
              • Geographical insights
              • Competitive landscape

              Interested in this report?

              Get your sample now to see our research methodology and insights!

              Download Now

              Frequently Asked Questions

              Satellite-based Earth Observation market growth will increase by 1678.1 million during 2024-2028.

              The Satellite-based Earth Observation market is expected to grow at a CAGR of 10.44% during 2024-2028.

              Satellite-based Earth Observation market is segmented by Application( Urban development and cultural heritage, Agriculture, Climate, Energy and raw materials, Others) Type( VAS, Data, Climate, Agriculture, Others)

              ACRI ST, Airbus SE, Antrix Corp. Ltd., Assimila Ltd., BAE Systems Plc, BMT Group Ltd., CGI Inc., cloudeo AG, Eagle View Technologies Inc., EarthDaily Analytics, Geoimage, GeoOptics Inc., Global Surface Intelligence Ltd., Imagesat International I.S.I Ltd., Kleos Space S.A., Lockheed Martin Corp., Maxar Technologies Inc., OHB System AG, Orbital Insight Inc., Thales Group are a few of the key vendors in the Satellite-based Earth Observation market.

              Europe will register the highest growth rate of 100% among the other regions. Therefore, the Satellite-based Earth Observation market in Europe is expected to garner significant business opportunities for the vendors during the forecast period.

              Russia, UK, Germany, France, Rest of Europe

              • Growing use of satellites for environmental monitoringSatellites are increasingly being used for environmental monitoring. This is because of their ability to accurately monitor climate is the driving factor this market.
              • environmental changes is the driving factor this market.
              • geographical features of the earth is the driving factor this market.
              • and climatic conditions over a huge surface area. Such monitoring activities cannot be easily carried out using earth-bound observation stations. earth observation satellites can provide almost real-time updates on cloud and wind activities and atmospheric occurrences that are crucial for providing climate forecasts to end-users. The use of satellites for advanced environmental monitoring is increasing. Satellite-based earth observation is used for various applications is the driving factor this market.
              • including the observation and monitoring of GHG emissions is the driving factor this market.
              • deforestation is the driving factor this market.
              • changes in polar ice is the driving factor this market.
              • wildfires is the driving factor this market.
              • and coral bleaching. Advances in sensing and imaging technologies in the past decade have led to the development of superior observation satellites for environmental monitoring. These satellites provide higher-resolution images and allow for the measurement of several metrics. The EU earth observation Programme is the driving factor this market.
              • also called Copernicus is the driving factor this market.
              • provides data and services for monitoring the atmosphere is the driving factor this market.
              • marine environment is the driving factor this market.
              • and land and climate changes. It also provides emergency management services. The satellite system constitutes one of the most advanced environmental monitoring systems built to date and provides data and metrics for Europe and other countries. The data generated by the Copernicus program is available for free. This is encouraging investments and the development of downstream VAS. Thus is the driving factor this market.
              • the above-mentioned factor is expected to increase the demand for satellite-based earth observation is the driving factor this market.
              • which will propel the growth of the satellite-based earth observation market in Europe during the forecast period. is the driving factor this market.

              The Satellite-based Earth Observation market vendors should focus on grabbing business opportunities from the Urban development and cultural heritage segment as it accounted for the largest market share in the base year.