Scrubber Market Size 2024-2028
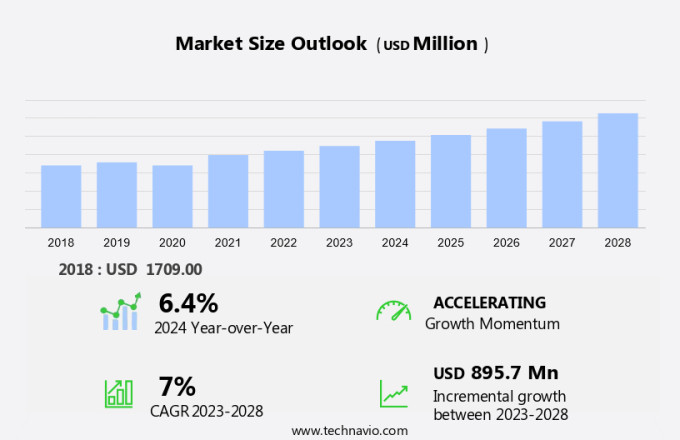
The scrubber market size is forecast to increase by USD 895.7 million, at a CAGR of 7% between 2023 and 2028.
- The market is witnessing significant growth, driven by the expanding tourism and health sectors, which necessitate stringent environmental regulations. These industries are increasingly adopting eco-friendly scrubbers to meet sustainability requirements and enhance their brand image. However, the marine end-use industry faces a challenge with the long payback period for scrubber investments. This prolonged financial commitment may deter some players from implementing scrubber technologies, necessitating the exploration of alternative financing solutions or cost reduction strategies.
- Companies seeking to capitalize on market opportunities can focus on collaborations, innovation, and cost optimization to address the challenges and remain competitive in the evolving landscape.
What will be the Size of the Scrubber Market during the forecast period?
Explore in-depth regional segment analysis with market size data - historical 2018-2022 and forecasts 2024-2028 - in the full report.
Request Free Sample
The market continues to evolve, driven by the ever-evolving regulatory landscape and the need for advanced pollution control systems in various sectors. Chemical processing industries, metal processing, and power generation are among the key sectors leveraging scrubber technology to ensure environmental compliance. The market encompasses a range of applications, from wet scrubbers and packed bed scrubbers to venturi scrubbers and fabric filters. Scrubber technology advancements, such as pressure drop reduction and energy efficiency improvements, are pivotal in driving market growth. Air quality monitoring and emissions reduction are critical focus areas, with a growing emphasis on green technology and renewable energy.
Process optimization and scrubber upgradation are essential for industries seeking to minimize operating costs and improve efficiency ratings. The market is segmented based on various factors, including scrubber design, gas flow dynamics, and scrubbing media. Regulatory standards and industrial automation are significant influencers on the market. The market size is projected to grow, with a strong focus on innovation and maintenance requirements. Sorbent materials, electrostatic precipitators, and data analytics are some of the emerging trends shaping the industry outlook. Scrubber applications span across various industries, including cement production and waste incineration, with a focus on reducing carbon footprint and improving emissions monitoring.
The market analysis reveals ongoing advancements in scrubber technology, with a growing emphasis on mercury removal, NOx removal, and VOC removal. The market is dynamic, with continuous innovation and upgradation shaping the industry landscape. From scrubber patents and scrubber life cycle management to the market share and performance optimization, the market is poised for significant growth and development.
How is this Scrubber Industry segmented?
The scrubber industry research report provides comprehensive data (region-wise segment analysis), with forecasts and estimates in "USD million" for the period 2024-2028, as well as historical data from 2018-2022 for the following segments.
- Type
- Wet scrubber
- Dry scrubber
- Geography
- North America
- US
- Europe
- Germany
- UK
- APAC
- China
- Japan
- Rest of World (ROW)
- North America
By Type Insights
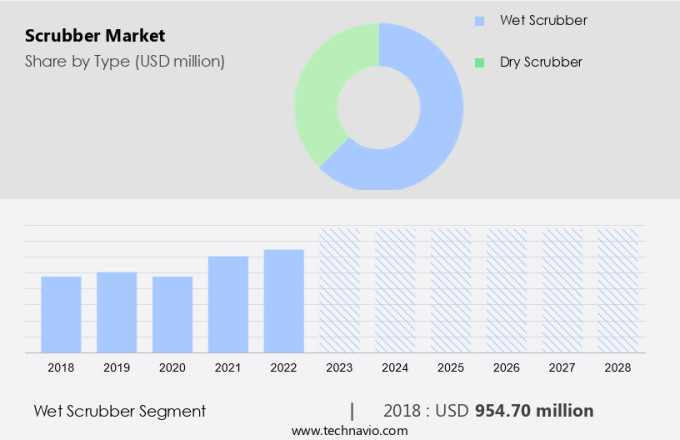
The wet scrubber segment is estimated to witness significant growth during the forecast period.
Wet scrubbers play a crucial role in industrial air pollution control by effectively removing harmful dust, particulate matter, and pollutants from exhaust gases. The technology involves passing the gas through a funnel, where it is sprayed with a scrubbing liquid. This process not only results in cleaner gas emissions but also absorbs harmful substances that contribute to environmental hazards, such as acid rain. Wet scrubbers are robustly designed to withstand varying temperatures and can handle the removal of even the most detrimental gases and substances. However, their maintenance requirements are significant due to the frequent need for scrubber replacement and the susceptibility to corrosion over time.
The high replacement cost is a notable challenge for businesses in industries such as chemical processing, metal production, and power generation. Despite these considerations, advancements in scrubber technology, including the integration of fabric filters and process optimization techniques, have led to increased efficiency and energy savings. Additionally, the growing emphasis on environmental compliance and emissions reduction has fueled the market's growth in various sectors, including cement production, industrial automation, and renewable energy. The market for scrubbers is segmented into wet and dry scrubbers, with wet scrubbers holding a significant market share due to their ability to handle a broader range of pollutants.
The future outlook for the scrubber industry is promising, driven by regulatory standards, pollution control systems, and the increasing demand for sustainable and green technology solutions. The market is expected to continue growing, with a focus on improving scrubber design, efficiency, and performance through technological innovations and process upgradation.
The Wet scrubber segment was valued at USD 954.70 million in 2018 and showed a gradual increase during the forecast period.
Regional Analysis
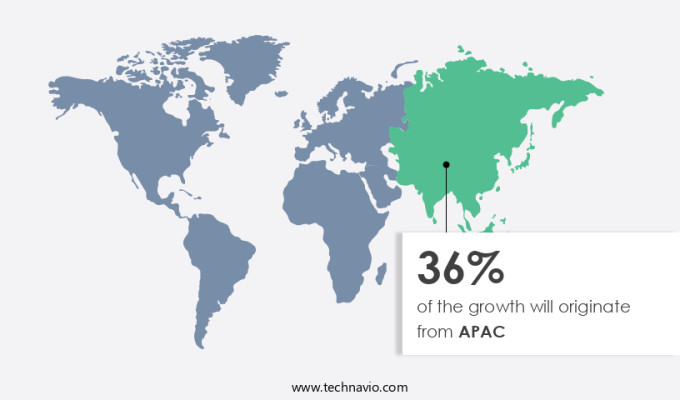
APAC is estimated to contribute 36% to the growth of the global market during the forecast period. Technavio's analysts have elaborately explained the regional trends and drivers that shape the market during the forecast period.
The market in the Asia Pacific region is driven by the high demand for coal-fired power generation, with significant contributions from China, India, and Southeast Asia. In 2022, China's coal-fired power generation capacity expanded by 4%, and India's capacity increased by 13%. Coal remains a preferred energy source despite the growth of natural gas, solar, and wind power due to the large installed base of coal-fired power plants, the high costs of transitioning to natural gas, and the abundant coal supply in the region. The market is witnessing advancements in technology, including venturi scrubbers, packed bed scrubbers, and plate scrubbers, which are essential for meeting environmental compliance requirements and reducing industrial emissions.
Air quality monitoring, process optimization, and scrubber upgradation are key trends in the industry. Regulatory standards, such as those related to SOx and NOx removal, are driving the demand for scrubber installation and retrofit. The market is also witnessing innovations in scrubber design, fabric filters, and process control systems. The market is segmented based on applications, including cement production, metal processing, power generation, and others. The market growth is influenced by factors such as the increasing focus on emissions reduction, energy efficiency, and carbon footprint. The market size is expected to grow significantly due to the increasing demand for scrubbers in various industries and the continuous advancements in scrubber technology.
Maintenance requirements, gas flow dynamics, and scrubber life cycle are crucial considerations for market participants. Sorbent materials, scrubbing media, and scrubber patents are key areas of research and development. The market is expected to continue its growth trajectory, driven by the need for effective pollution control systems and the increasing focus on environmental engineering.
Market Dynamics
Our researchers analyzed the data with 2023 as the base year, along with the key drivers, trends, and challenges. A holistic analysis of drivers will help companies refine their marketing strategies to gain a competitive advantage.
What are the key market drivers leading to the rise in the adoption of Scrubber Industry?
- The tourism, health, and retail sectors' expansion significantly contributes to the market's growth. These industries hold immense potential for economic development and are key drivers in the market's progression.
- The market is witnessing significant growth due to the increasing emphasis on emission monitoring and reducing the levels of pollutants in flue gas. Scrubbers, such as cyclone separators and plate scrubbers, play a crucial role in the removal of particulate matter and gaseous pollutants during combustion processes. The efficiency rating of scrubbers is a critical factor in their adoption, as higher efficiency translates to lower operating costs. The scrubber life cycle and energy efficiency are also essential considerations for businesses. Scrubbers are integral to flue gas desulfurization and mercury removal processes, ensuring compliance with environmental regulations. Scrubber performance and optimization are ongoing priorities for companies to minimize downtime and maximize productivity.
- Scrubber patents and the development of advanced scrubbing media continue to drive innovation in the market. SOx removal is a significant application area for scrubbers, particularly in industries such as power generation and steel manufacturing. As businesses strive for sustainability and regulatory compliance, the demand for scrubbers is expected to continue growing.
What are the market trends shaping the Scrubber Industry?
- The eco-friendly the market is experiencing significant growth due to increasing demand for sustainable solutions. Two key trends driving this trend are stricter environmental regulations and a growing awareness of the environmental impact of traditional scrubbers.
- The market is witnessing significant growth due to the increasing demand for clean technology solutions in chemical processing industries. Scrubbers, which are essential components of air pollution control systems, have become increasingly important in ensuring environmental compliance. Traditional scrubbers, such as wet scrubbers and venturi scrubbers, have been widely used for dust collection in various industries, including metal processing. However, there is a growing emphasis on eco-friendly scrubber technology to reduce the environmental impact of these systems. Advancements in scrubber technology include the development of packed bed scrubbers, which save water and chemicals compared to conventional scrubbers.
- These eco-friendly scrubbers also produce less noise and reduce energy consumption. Air quality monitoring is a critical factor driving the growth of the market. As regulatory requirements become more stringent, the demand for effective and efficient scrubber systems is increasing. The market forecast indicates continued growth, with increasing focus on scrubber replacement and installation to meet environmental regulations. Overall, the scrubber industry outlook is positive, with ongoing research and development efforts aimed at improving scrubber technology and reducing environmental impact.
What challenges does the Scrubber Industry face during its growth?
- The prolonged payback period for scrubbers in the marine end-use industry represents a significant challenge to industry expansion. This issue arises due to the substantial upfront investment required for implementing scrubber technology, which may take several years to recoup through cost savings on fuel and emissions fees. Consequently, this barrier to entry hinders the growth of the marine industry as a whole.
- Scrubber technology, a crucial component of pollution control systems, plays a significant role in industrial emissions reduction, particularly in sectors such as power generation and cement production. Regulatory standards continue to evolve, driving the demand for advanced scrubber designs, including fabric filters and dry scrubbers. Scrubber innovation is a key focus area for environmental engineering, with process optimization and scrubber upgradation being essential for industrial automation and energy efficiency. The high initial capital expenditure associated with scrubber installation, including design costs, presents a challenge for shipowners in the maritime industry. The payback period for marine scrubbers, which measures the duration for cost recovery through savings or profits, is influenced by the price differential between low-sulfur and high-sulfur fuel oils.
- Despite the high cost, the long-term benefits of emissions compliance and operational efficiency make scrubber technology a valuable investment for industries subject to stringent regulatory standards. In conclusion, the market is shaped by regulatory requirements, technological advancements, and cost-benefit considerations. Process optimization, scrubber upgradation, and innovation in scrubber technology are crucial trends driving the market forward, as industries strive to meet emissions targets and improve overall efficiency.
Exclusive Customer Landscape
The scrubber market forecasting report includes the adoption lifecycle of the market, covering from the innovator's stage to the laggard's stage. It focuses on adoption rates in different regions based on penetration. Furthermore, the scrubber market report also includes key purchase criteria and drivers of price sensitivity to help companies evaluate and develop their market growth analysis strategies.
Customer Landscape
Key Companies & Market Insights
Companies are implementing various strategies, such as strategic alliances, scrubber market forecast, partnerships, mergers and acquisitions, geographical expansion, and product/service launches, to enhance their presence in the industry.
Alfa Laval AB - The company specializes in providing advanced emissions solutions, including the PureSOx system.
The industry research and growth report includes detailed analyses of the competitive landscape of the market and information about key companies, including:
- Alfa Laval AB
- Andritz AG
- Babcock and Wilcox Enterprises Inc.
- CECO Environmental Corp.
- Clean Marine AS
- Damen Shipyards Group
- Ducon
- Evoqua Water Technologies LLC
- Fuji Electric Co. Ltd.
- GEA Group AG
- Hamon S.A.
- Hitachi Zosen Corp.
- KCH Services Inc.
- Mitsubishi Heavy Industries Ltd
- Nederman Holding AB
- Thermax Ltd.
- Tri-Mer Corp.
- Verantis Environmental Solutions Group
- Wartsila Corp.
- Yara Marine Technologies
Qualitative and quantitative analysis of companies has been conducted to help clients understand the wider business environment as well as the strengths and weaknesses of key industry players. Data is qualitatively analyzed to categorize companies as pure play, category-focused, industry-focused, and diversified; it is quantitatively analyzed to categorize companies as dominant, leading, strong, tentative, and weak.
Recent Development and News in Scrubber Market
- In January 2024, Emission Control Technologies (ECT), a leading scrubber manufacturer, announced the launch of their new open-loop exhaust gas cleaning system, the "ECT Max," designed for larger container ships. This innovative solution, which received IMO (International Maritime Organization) approval in March 2024, can clean up to 100% of sulfur oxides and particulate matter (PM), making it a significant step towards stricter emissions regulations (ECT press release, 2024).
- In April 2024, Wärtsilä, a major marine technology provider, and MAN Energy Solutions, a leading engine manufacturer, joined forces to develop hybrid scrubber systems. Their collaboration aimed to combine Wärtsilä's scrubber technology with MAN's engines, offering a more comprehensive and efficient solution for shipowners (Wärtsilä press release, 2024).
- In June 2024, the Chinese government announced a USD1.5 billion investment in scrubber technology as part of its efforts to reduce emissions from its shipping sector. The initiative, which includes subsidies for scrubber installations, aims to encourage Chinese shipowners to adopt cleaner technologies and improve their environmental performance (Xinhua News Agency, 2024).
- In May 2025, Ballast Water Technologies, a leading ballast water treatment solutions provider, acquired Ecochlor, a scrubber technology specialist. This strategic move expanded Ballast Water Technologies' product portfolio and enabled them to offer a comprehensive suite of solutions to their customers, addressing both ballast water treatment and exhaust gas cleaning needs (Ballast Water Technologies press release, 2025).
Research Analyst Overview
- The market is experiencing significant activity and trends in response to increasing environmental regulations and the push for sustainable development. Green building standards, such as LEED and BREEAM, are driving the adoption of scrubber systems for environmental remediation and air quality improvement. Scrubber maintenance optimization and automation solutions are essential for ensuring compliance with regulations under the Clean Air Act and EU emissions standards. Energy conservation is a key consideration in the selection of smart scrubber systems and process optimization techniques. Gas cleaning technologies, including desulfurization processes and CO2 abatement technologies, are crucial for industrial safety and process safety.
- Environmental management systems, life cycle analysis, and risk assessment are integral components of sustainable development and compliance management. Industrial water treatment and particulate matter control are also important aspects of the market. Environmental impact assessment and waste management are increasingly important considerations for companies seeking to minimize their carbon footprint and enhance their corporate social responsibility.
Dive into Technavio's robust research methodology, blending expert interviews, extensive data synthesis, and validated models for unparalleled Scrubber Market insights. See full methodology.
|
Market Scope |
|
|
Report Coverage |
Details |
|
Page number |
175 |
|
Base year |
2023 |
|
Historic period |
2018-2022 |
|
Forecast period |
2024-2028 |
|
Growth momentum & CAGR |
Accelerate at a CAGR of 7% |
|
Market growth 2024-2028 |
USD 895.7 million |
|
Market structure |
Fragmented |
|
YoY growth 2023-2024(%) |
6.4 |
|
Key countries |
China, US, UK, Germany, and Japan |
|
Competitive landscape |
Leading Companies, Market Positioning of Companies, Competitive Strategies, and Industry Risks |
What are the Key Data Covered in this Scrubber Market Research and Growth Report?
- CAGR of the Scrubber industry during the forecast period
- Detailed information on factors that will drive the growth and forecasting between 2024 and 2028
- Precise estimation of the size of the market and its contribution of the industry in focus to the parent market
- Accurate predictions about upcoming growth and trends and changes in consumer behaviour
- Growth of the market across APAC, Europe, North America, South America, and Middle East and Africa
- Thorough analysis of the market's competitive landscape and detailed information about companies
- Comprehensive analysis of factors that will challenge the scrubber market growth of industry companies
We can help! Our analysts can customize this scrubber market research report to meet your requirements.


