Secondhand Apparel Market Analysis, Size, and Forecast 2026-2030: APAC (China, Japan, and India), North America (US, Canada, and Mexico), Europe (UK, Germany, and France), South America (Brazil and Argentina), Middle East and Africa (UAE, South Africa, and Saudi Arabia), and Rest of World (ROW)

Secondhand Apparel Market Analysis, Size, and Forecast 2026-2030:
APAC (China, Japan, and India), North America (US, Canada, and Mexico), Europe (UK, Germany, and France), South America (Brazil and Argentina), Middle East and Africa (UAE, South Africa, and Saudi Arabia), and Rest of World (ROW)

Published: Mar 2026 282 Pages SKU: IRTNTR77228

Market Overview at a Glance

$245.60 B
Market Opportunity
15%
CAGR 2025 - 2030
49.8%
APAC Growth
$92.15 B
Women segment 2024

Secondhand Apparel Market Size 2026-2030

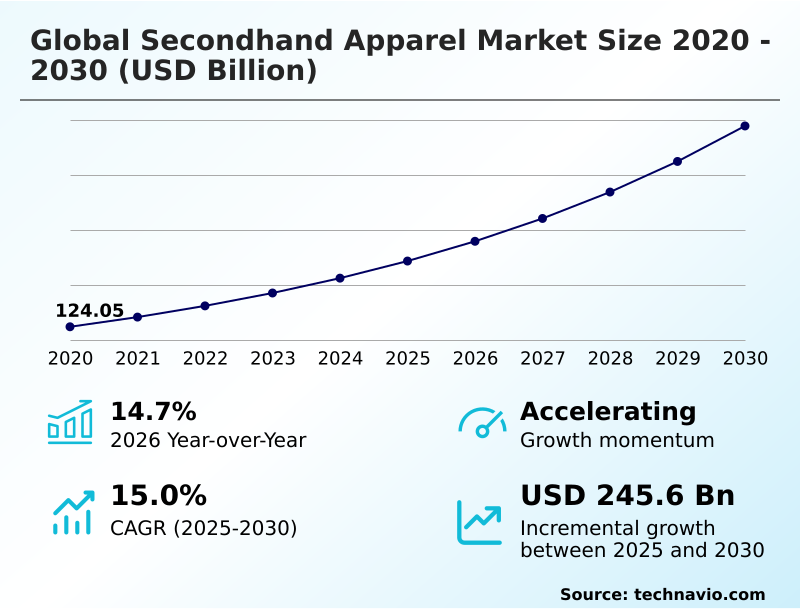
The secondhand apparel market size is valued to increase by USD 245.60 billion, at a CAGR of 15% from 2025 to 2030. Economic considerations and heightened value perception will drive the secondhand apparel market.

Major Market Trends & Insights

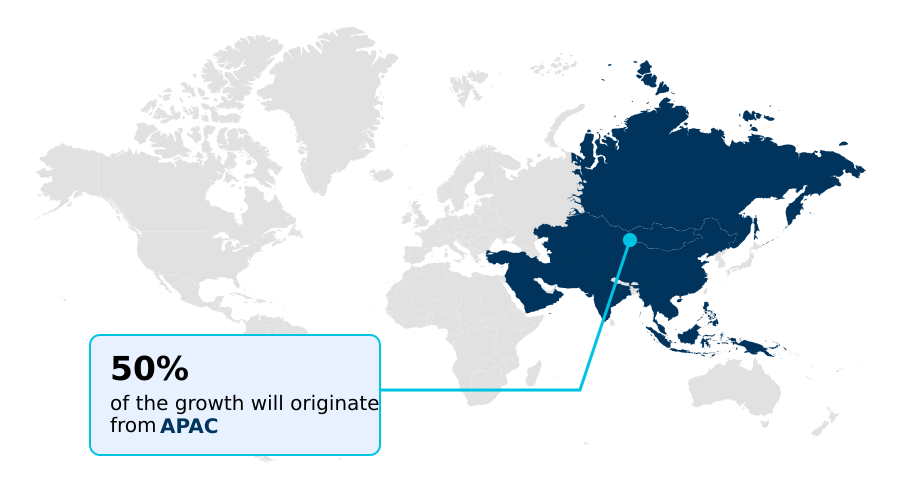
  • APAC dominated the market and accounted for a 49.8% growth during the forecast period.
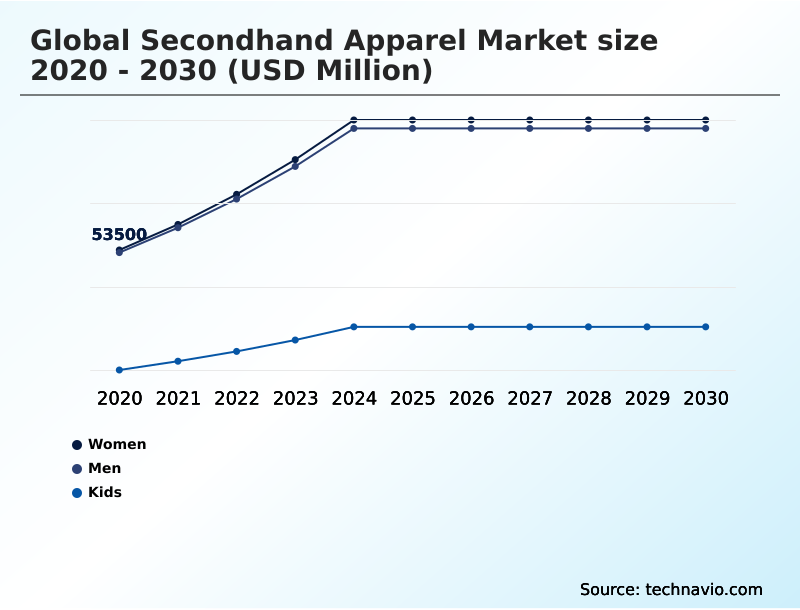
  • By End-user - Women segment was valued at USD 92.15 billion in 2024
  • By Type - TTSD segment accounted for the largest market revenue share in 2024

Market Size & Forecast

  • Market Opportunities: USD 365.10 billion
  • Market Future Opportunities: USD 245.60 billion
  • CAGR from 2025 to 2030 : 15%

Market Summary

  • The secondhand apparel market is transitioning from a niche interest to a pivotal force in the fashion industry, fueled by a consumer shift toward sustainability, value, and individuality. This evolution is facilitated by digital resale platforms offering professionalized services, including authentication and curated collections, which builds consumer trust and broadens market participation.
  • A significant trend involves the adoption of resale-as-a-service (RaaS) frameworks, allowing primary market brands to enter the circular economy. For example, a mainstream retailer might integrate a take-back program, offering customers store credit for used items. This strategy increases customer lifetime value and yields data on product lifecycle performance, directly informing future design and manufacturing.
  • Despite this momentum, the sector faces substantial operational challenges. The fundamental reliance on a decentralized, consumer-driven supply stream creates unpredictability in inventory volume and quality, demanding sophisticated logistics and stringent quality control protocols to manage single-SKU items effectively. Successfully scaling these human-intensive processes is key to sustained growth.

What will be the Size of the Secondhand Apparel Market during the forecast period?

Get Key Insights on Market Forecast (PDF) Request Free Sample

How is the Secondhand Apparel Market Segmented?

The secondhand apparel industry research report provides comprehensive data (region-wise segment analysis), with forecasts and estimates in "USD million" for the period 2026-2030, as well as historical data from 2020-2024 for the following segments.

  • End-user
    • Women
    • Men
    • Kids
  • Type
    • TTSD
    • Resale
  • Product type
    • Clothing
    • Footwear
    • Accessories
    • Bags
  • Geography
    • APAC
      • China
      • Japan
      • India
    • North America
      • US
      • Canada
      • Mexico
    • Europe
      • UK
      • Germany
      • France
    • South America
      • Brazil
      • Argentina
    • Middle East and Africa
      • UAE
      • South Africa
      • Saudi Arabia
    • Rest of World (ROW)

By End-user Insights

The women segment is estimated to witness significant growth during the forecast period.

The women's segment is the primary engine of the secondhand apparel market, driven by value-seeking, sustainability ethics, and style individuality.

Consumers are highly engaged across diverse channels, from managed marketplaces to peer-to-peer platforms, often using online consignment for aspirational consumption of luxury goods.

This demographic is both the largest source of demand and the primary supplier, creating a self-sustaining brand ecosystem integration. Utilizing a curated vintage collection and embracing product lifecycle extension are key behaviors.

The implementation of ai-driven personalization has improved user engagement by over 15% on some platforms, reflecting the segment's pivotal role in advancing the circular fashion movement and recommerce platform adoption.

Request Free Sample

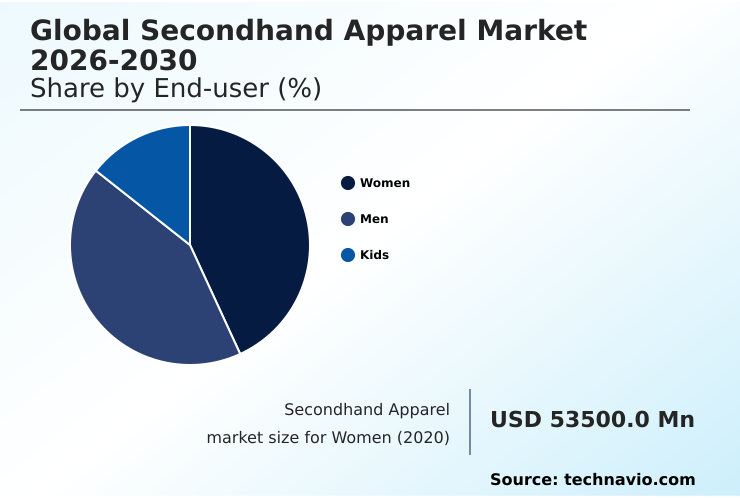
The Women segment was valued at USD 92.15 billion in 2024 and showed a gradual increase during the forecast period.

Request Free Sample

Regional Analysis

APAC is estimated to contribute 49.8% to the growth of the global market during the forecast period.Technavio’s analysts have elaborately explained the regional trends and drivers that shape the market during the forecast period.

See How Secondhand Apparel Market Demand is Rising in APAC Request Free Sample

The geographic landscape is characterized by varied maturity and growth trajectories. APAC is the fastest-growing region, projected to contribute nearly 50% of the market's incremental growth, driven by a youthful, digitally-native population.

In contrast, North America and Europe, while more mature, remain significant, accounting for approximately 21% and 21% of the opportunity, respectively. In these developed markets, the shift towards a circular economy is more pronounced.

The operational efficiency of reverse logistics in Europe has improved, with some platforms achieving a 15% reduction in processing times for returned goods.

This highlights how regional infrastructure and consumer attitudes shape the adoption of resale market models, from physical thrift stores to advanced online marketplaces for pre-owned clothing.

Market Dynamics

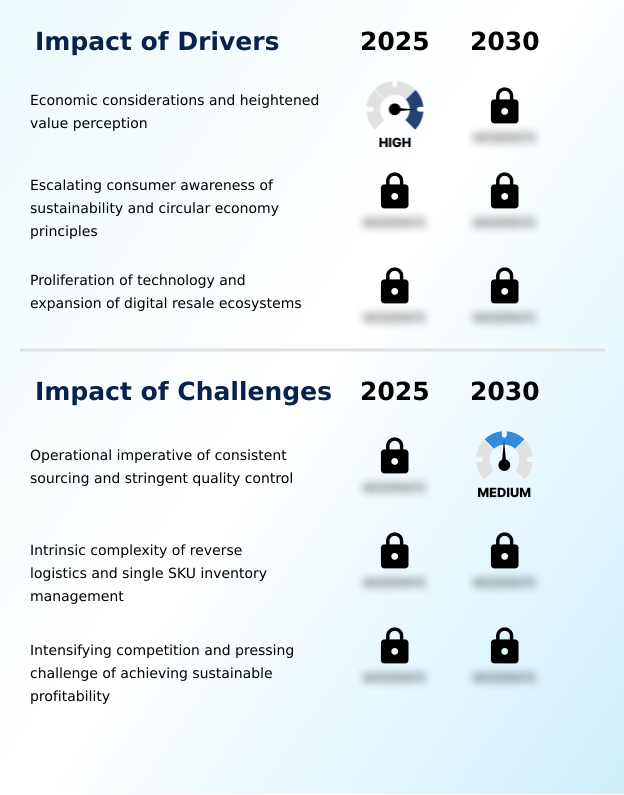
Our researchers analyzed the data with 2025 as the base year, along with the key drivers, trends, and challenges. A holistic analysis of drivers will help companies refine their marketing strategies to gain a competitive advantage.

  • The global secondhand apparel market's trajectory is increasingly shaped by the impact of recommerce on retail strategy, compelling traditional brands to reconsider their business models. Many are now exploring brand-led resale impact on customer loyalty, using take-back programs to enhance customer lifetime value.
  • This shift is enabled by the role of raas in mainstream brand adoption, which simplifies entry into the circular economy. However, this transition is not without hurdles; the challenges in secondhand apparel reverse logistics and the complexities of managing single-sku inventory in secondhand retail demand significant operational investment.
  • Data analytics for secondhand style longevity is becoming crucial for pricing and curation. For high-value segments, counterfeit authentication for luxury resale is a non-negotiable trust factor. The rise of social commerce influence on pre-loved fashion sales and the power of user-generated content's role in online thrift stores are reshaping marketing.
  • Success often hinges on comparing managed vs peer-to-peer marketplaces to find the right operational fit, with some c2b2c business model for secondhand luxury platforms reporting 2x higher engagement than pure P2P sites.
  • Ultimately, measuring sustainability in the circular economy while integrating phygital models in apparel resale and optimizing textile recycling in circular fashion are key to long-term viability and navigating supply chain fragmentation in used clothing.

What are the key market drivers leading to the rise in the adoption of Secondhand Apparel Industry?

  • Economic considerations and a heightened perception of value are primary drivers propelling the expansion of the secondhand apparel market.

  • Economic pressures and an evolution in consumer value perception are formidable drivers. Facing diminished disposable income, consumers are adopting prudent purchasing behaviors, making the secondhand market an attractive fast fashion alternative.
  • The market's value proposition of affordability and quality has democratized access to premium brands, where items on some platforms retain up to 70% of their original resale value.
  • This shift fosters a sophisticated approach to consumption, where garment durability and brand equity are prioritized. Platforms leveraging social commerce and user-generated content see engagement rates 40% higher than those without, turning economic necessity into a socially validated, savvy choice.
  • This dynamic promotes aspirational consumption and conscious consumption.

What are the market trends shaping the Secondhand Apparel Industry?

  • The strategic integration of recommerce into mainstream retail and brand strategy is a defining trend. This pivot marks a significant departure from historical models where the secondary market operated as a separate ecosystem.

  • A defining trend is the strategic integration of recommerce into mainstream retail. This movement, often termed brand-led resale, allows brands to capture resale value and enhance customer lifetime value. This pivot is supported by the proliferation of the digital resale ecosystem, where platforms utilizing a consumer-to-business-to-consumer (c2b2c) model report customer retention rates over 60% higher than traditional retail.
  • The convergence of physical and digital channels into a phygital resale model further legitimizes secondhand shopping. By offering take-back programs, brands participate in the full garment durability lifecycle, which resonates with consumers focused on circular economy principles. Platforms that have integrated these services have seen a 25% increase in repeat seller activity.

What challenges does the Secondhand Apparel Industry face during its growth?

  • The operational imperative of maintaining consistent sourcing and enforcing stringent quality control presents a fundamental challenge to the industry's growth.

  • A persistent challenge is establishing a consistent and scalable supply chain from a fragmented, decentralized source. This reliance on consumer supply complicates demand forecasting and requires sophisticated inventory management systems for single-sku inventory management.
  • The need for stringent quality control protocols is paramount, as lapses can damage brand reputation; platforms investing in multi-point inspections report return rates up to 50% lower than competitors. Furthermore, the threat of counterfeit goods necessitates resource-intensive counterfeit authentication processes, especially for secondhand luxury goods.
  • Scaling these human-dependent operations of sourcing and inspection without eroding profitability is a defining challenge for the clothing resale and apparel resale markets.

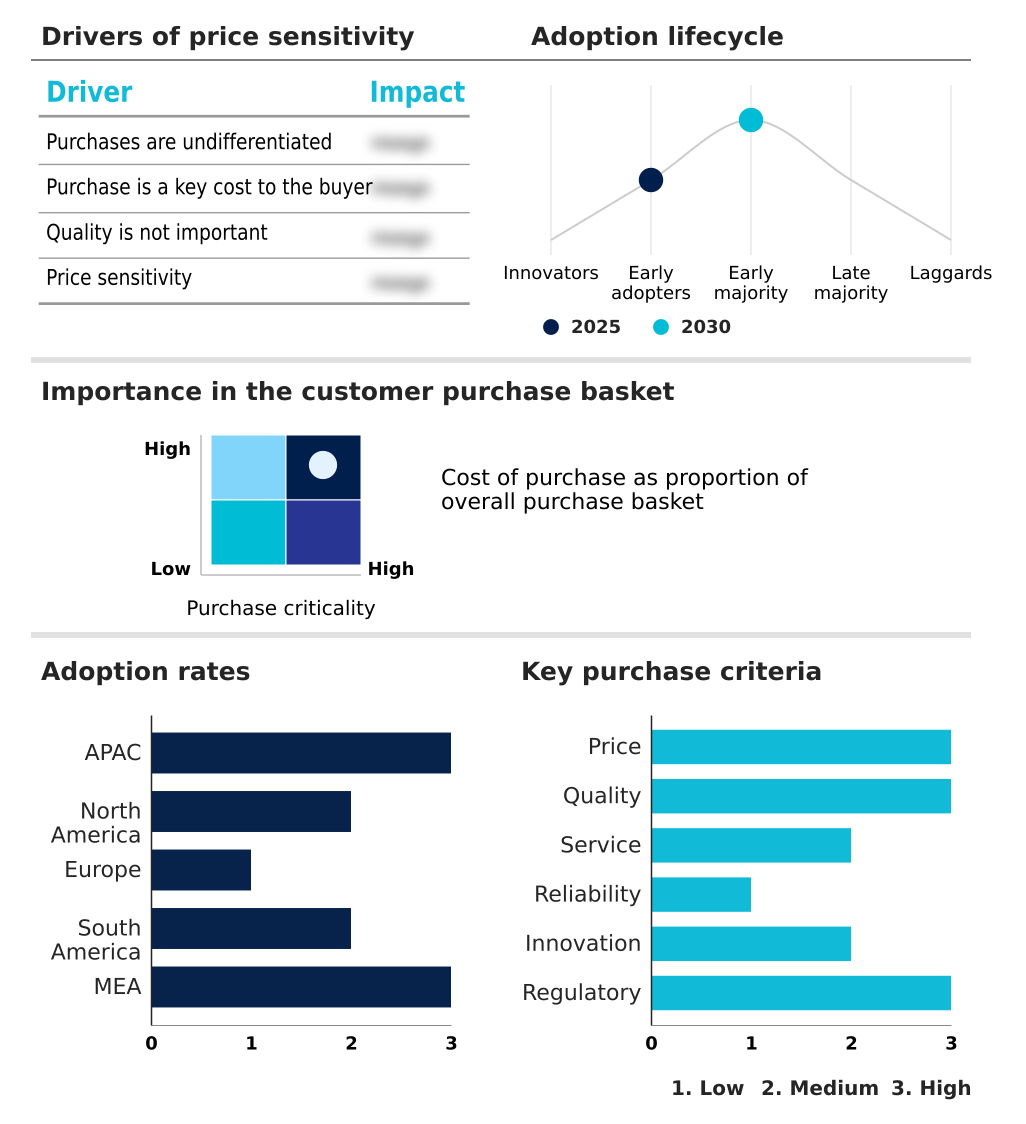
Exclusive Technavio Analysis on Customer Landscape

The secondhand apparel market forecasting report includes the adoption lifecycle of the market, covering from the innovator’s stage to the laggard’s stage. It focuses on adoption rates in different regions based on penetration. Furthermore, the secondhand apparel market report also includes key purchase criteria and drivers of price sensitivity to help companies evaluate and develop their market growth analysis strategies.

Customer Landscape of Secondhand Apparel Industry

Competitive Landscape

Companies are implementing various strategies, such as strategic alliances, secondhand apparel market forecast, partnerships, mergers and acquisitions, geographical expansion, and product/service launches, to enhance their presence in the industry.

2nd Street USA Inc. - The company's offering focuses on the purchase and sale of curated secondhand clothing and accessories, sourced from diverse channels for both retail and online.

The industry research and growth report includes detailed analyses of the competitive landscape of the market and information about key companies, including:

  • 2nd Street USA Inc.
  • Allbirds Inc.
  • Arcteryx Sports Corp.
  • Beyond Retro Ltd
  • Clothes Mentor
  • Crossroads Trading
  • Depop Ltd.
  • E.L.V. Denim Ltd
  • Eileen Fisher Inc
  • lululemon athletica Inc.
  • Madewell Inc
  • MUD Jeans International B.V.
  • Patagonia Inc.
  • Poshmark Inc.
  • Recreational Equipment Inc.
  • Savers Value Village Inc
  • The RealReal Inc.
  • ThredUp Inc.
  • VINTED INC.

Qualitative and quantitative analysis of companies has been conducted to help clients understand the wider business environment as well as the strengths and weaknesses of key industry players. Data is qualitatively analyzed to categorize companies as pure play, category-focused, industry-focused, and diversified; it is quantitatively analyzed to categorize companies as dominant, leading, strong, tentative, and weak.

Recent Development and News in Secondhand apparel market

  • In August 2024, ThredUp Inc. launched a suite of artificial intelligence tools, including a natural-language search tool and an AI-powered chatbot, to enhance personalization and solve the discovery challenge on its platform.
  • In January 2025, Fanatics, a prominent sports apparel provider, announced plans to launch a new luxury sports brand, reflecting a growing consumer demand for high-quality, branded apparel that influences the secondhand market.
  • In May 2025, ThredUp Inc. announced a partnership with UK-based vintage retailer Beyond Retro, introducing a curated collection of 17,000 vintage pieces to US shoppers for the first time, highlighting a trend toward cross-border curation.
  • In January 2026, Lands End partnered with ThredUp Inc., leveraging its Resale-as-a-Service (RaaS) platform to launch a clean-out program that incentivizes customers with shopping credit, illustrating the mainstream adoption of recommerce.

Dive into Technavio’s robust research methodology, blending expert interviews, extensive data synthesis, and validated models for unparalleled Secondhand Apparel Market insights. See full methodology.

Market Scope
Page number 282
Base year 2025
Historic period 2020-2024
Forecast period 2026-2030
Growth momentum & CAGR Accelerate at a CAGR of 15%
Market growth 2026-2030 USD 245603.5 million
Market structure Fragmented
YoY growth 2025-2026(%) 14.7%
Key countries China, Japan, India, South Korea, Australia, Indonesia, US, Canada, Mexico, UK, Germany, France, Italy, Spain, The Netherlands, Brazil, Argentina, Chile, UAE, South Africa, Saudi Arabia, Nigeria and Kenya
Competitive landscape Leading Companies, Market Positioning of Companies, Competitive Strategies, and Industry Risks

Request Free Sample

Research Analyst Overview

  • The secondhand apparel market is undergoing a profound structural transformation, moving beyond traditional physical thrift stores to a sophisticated digital resale ecosystem. This evolution is driven by circular economy principles and enabled by technologies that facilitate brand ecosystem integration and product lifecycle extension. Key operational components include recommerce platforms, ranging from peer-to-peer marketplaces to managed marketplace models offering online consignment.
  • The development of Resale-as-a-Service (RaaS) is a critical trend, allowing primary brands to implement take-back programs and engage in brand-led resale. For boardroom decisions, this represents a strategic pivot toward sustainable revenue models. For example, firms that have implemented robust quality control protocols and counterfeit authentication have achieved a 35% reduction in product return rates, directly impacting profitability.
  • Navigating the complexities of reverse logistics, single-sku inventory management, and supply chain fragmentation, while integrating phygital resale models and exploring upcycling and textile recycling, remains central to achieving a competitive advantage.

What are the Key Data Covered in this Secondhand Apparel Market Research and Growth Report?

  • What is the expected growth of the Secondhand Apparel Market between 2026 and 2030?

    • USD 245.60 billion, at a CAGR of 15%

  • What segmentation does the market report cover?

    • The report is segmented by End-user (Women, Men, and Kids), Type (TTSD, and Resale), Product Type (Clothing, Footwear, Accessories, and Bags) and Geography (APAC, North America, Europe, South America, Middle East and Africa)

  • Which regions are analyzed in the report?

    • APAC, North America, Europe, South America and Middle East and Africa

  • What are the key growth drivers and market challenges?

    • Economic considerations and heightened value perception, Operational imperative of consistent sourcing and stringent quality control

  • Who are the major players in the Secondhand Apparel Market?

    • 2nd Street USA Inc., Allbirds Inc., Arcteryx Sports Corp., Beyond Retro Ltd, Clothes Mentor, Crossroads Trading, Depop Ltd., E.L.V. Denim Ltd, Eileen Fisher Inc, lululemon athletica Inc., Madewell Inc, MUD Jeans International B.V., Patagonia Inc., Poshmark Inc., Recreational Equipment Inc., Savers Value Village Inc, The RealReal Inc., ThredUp Inc. and VINTED INC.

Market Research Insights

  • The secondhand apparel market is defined by a structural shift toward a circular fashion model, driven by consumer demand for value and sustainability. Platforms are evolving from simple online thrift store directories to sophisticated managed marketplaces offering value-added services.
  • The adoption of resale-as-a-service (RaaS) integrations by mainstream brands has been pivotal, with partners reporting a 20-30% increase in customer lifetime value. This strategy transforms the value perception of pre-loved fashion. Furthermore, the integration of peer-to-peer marketplace functionalities with robust authentication has addressed consumer trust issues, leading to a 40% lower cart abandonment rate for verified luxury items.
  • This dynamic highlights the market's professionalization and its challenge to the traditional fast fashion alternative.

We can help! Our analysts can customize this secondhand apparel market research report to meet your requirements.

Get in touch

1. Executive Summary

1.1 Market overview

Executive Summary - Chart on Market Overview
Executive Summary - Data Table on Market Overview
Executive Summary - Chart on Global Market Characteristics
Executive Summary - Chart on Market by Geography
Executive Summary - Chart on Market Segmentation by End-user
Executive Summary - Chart on Market Segmentation by Type
Executive Summary - Chart on Market Segmentation by Product Type
Executive Summary - Chart on Incremental Growth
Executive Summary - Data Table on Incremental Growth
Executive Summary - Chart on Company Market Positioning

2. Technavio Analysis

2.1 Analysis of price sensitivity, lifecycle, customer purchase basket, adoption rates, and purchase criteria

2.2 Criticality of inputs and Factors of differentiation

Chart on Overview on criticality of inputs and factors of differentiation

2.3 Factors of disruption

Chart on Overview on factors of disruption

2.4 Impact of drivers and challenges

Chart on Impact of drivers and challenges in 2025 and 2030

3. Market Landscape

3.1 Market ecosystem

Chart on Parent Market
Data Table on - Parent Market

3.2 Market characteristics

Chart on Market characteristics analysis

3.3 Value chain analysis

Chart on Value chain analysis

4. Market Sizing

4.1 Market definition

Data Table on Offerings of companies included in the market definition

4.2 Market segment analysis

Market segments

4.3 Market size 2025

4.4 Market outlook: Forecast for 2025-2030

Chart on Global - Market size and forecast 2025-2030 ($ million)
Data Table on Global - Market size and forecast 2025-2030 ($ million)
Chart on Global Market: Year-over-year growth 2025-2030 (%)
Data Table on Global Market: Year-over-year growth 2025-2030 (%)

5. Historic Market Size

5.1 Global Secondhand Apparel Market 2020 - 2024

Historic Market Size - Data Table on Global Secondhand Apparel Market 2020 - 2024 ($ million)

5.2 End-user segment analysis 2020 - 2024

Historic Market Size - End-user Segment 2020 - 2024 ($ million)

5.3 Type segment analysis 2020 - 2024

Historic Market Size - Type Segment 2020 - 2024 ($ million)

5.4 Product Type segment analysis 2020 - 2024

Historic Market Size - Product Type Segment 2020 - 2024 ($ million)

5.5 Geography segment analysis 2020 - 2024

Historic Market Size - Geography Segment 2020 - 2024 ($ million)

5.6 Country segment analysis 2020 - 2024

Historic Market Size - Country Segment 2020 - 2024 ($ million)

6. Qualitative Analysis

6.1 The AI impact on global secondhand apparel market

7. Five Forces Analysis

7.1 Five forces summary

Five forces analysis - Comparison between 2025 and 2030

7.2 Bargaining power of buyers

Bargaining power of buyers - Impact of key factors 2025 and 2030

7.3 Bargaining power of suppliers

Bargaining power of suppliers - Impact of key factors in 2025 and 2030

7.4 Threat of new entrants

Threat of new entrants - Impact of key factors in 2025 and 2030

7.5 Threat of substitutes

Threat of substitutes - Impact of key factors in 2025 and 2030

7.6 Threat of rivalry

Threat of rivalry - Impact of key factors in 2025 and 2030

7.7 Market condition

Chart on Market condition - Five forces 2025 and 2030

8. Market Segmentation by End-user

8.1 Market segments

Chart on End-user - Market share 2025-2030 (%)
Data Table on End-user - Market share 2025-2030 (%)

8.2 Comparison by End-user

Chart on Comparison by End-user
Data Table on Comparison by End-user

8.3 Women - Market size and forecast 2025-2030

Chart on Women - Market size and forecast 2025-2030 ($ million)
Data Table on Women - Market size and forecast 2025-2030 ($ million)
Chart on Women - Year-over-year growth 2025-2030 (%)
Data Table on Women - Year-over-year growth 2025-2030 (%)

8.4 Men - Market size and forecast 2025-2030

Chart on Men - Market size and forecast 2025-2030 ($ million)
Data Table on Men - Market size and forecast 2025-2030 ($ million)
Chart on Men - Year-over-year growth 2025-2030 (%)
Data Table on Men - Year-over-year growth 2025-2030 (%)

8.5 Kids - Market size and forecast 2025-2030

Chart on Kids - Market size and forecast 2025-2030 ($ million)
Data Table on Kids - Market size and forecast 2025-2030 ($ million)
Chart on Kids - Year-over-year growth 2025-2030 (%)
Data Table on Kids - Year-over-year growth 2025-2030 (%)

8.6 Market opportunity by End-user

Market opportunity by End-user ($ million)
Data Table on Market opportunity by End-user ($ million)

9. Market Segmentation by Type

9.1 Market segments

Chart on Type - Market share 2025-2030 (%)
Data Table on Type - Market share 2025-2030 (%)

9.2 Comparison by Type

Chart on Comparison by Type
Data Table on Comparison by Type

9.3 TTSD - Market size and forecast 2025-2030

Chart on TTSD - Market size and forecast 2025-2030 ($ million)
Data Table on TTSD - Market size and forecast 2025-2030 ($ million)
Chart on TTSD - Year-over-year growth 2025-2030 (%)
Data Table on TTSD - Year-over-year growth 2025-2030 (%)

9.4 Resale - Market size and forecast 2025-2030

Chart on Resale - Market size and forecast 2025-2030 ($ million)
Data Table on Resale - Market size and forecast 2025-2030 ($ million)
Chart on Resale - Year-over-year growth 2025-2030 (%)
Data Table on Resale - Year-over-year growth 2025-2030 (%)

9.5 Market opportunity by Type

Market opportunity by Type ($ million)
Data Table on Market opportunity by Type ($ million)

10. Market Segmentation by Product Type

10.1 Market segments

Chart on Product Type - Market share 2025-2030 (%)
Data Table on Product Type - Market share 2025-2030 (%)

10.2 Comparison by Product Type

Chart on Comparison by Product Type
Data Table on Comparison by Product Type

10.3 Clothing - Market size and forecast 2025-2030

Chart on Clothing - Market size and forecast 2025-2030 ($ million)
Data Table on Clothing - Market size and forecast 2025-2030 ($ million)
Chart on Clothing - Year-over-year growth 2025-2030 (%)
Data Table on Clothing - Year-over-year growth 2025-2030 (%)

10.4 Footwear - Market size and forecast 2025-2030

Chart on Footwear - Market size and forecast 2025-2030 ($ million)
Data Table on Footwear - Market size and forecast 2025-2030 ($ million)
Chart on Footwear - Year-over-year growth 2025-2030 (%)
Data Table on Footwear - Year-over-year growth 2025-2030 (%)

10.5 Accessories - Market size and forecast 2025-2030

Chart on Accessories - Market size and forecast 2025-2030 ($ million)
Data Table on Accessories - Market size and forecast 2025-2030 ($ million)
Chart on Accessories - Year-over-year growth 2025-2030 (%)
Data Table on Accessories - Year-over-year growth 2025-2030 (%)

10.6 Bags - Market size and forecast 2025-2030

Chart on Bags - Market size and forecast 2025-2030 ($ million)
Data Table on Bags - Market size and forecast 2025-2030 ($ million)
Chart on Bags - Year-over-year growth 2025-2030 (%)
Data Table on Bags - Year-over-year growth 2025-2030 (%)

10.7 Market opportunity by Product Type

Market opportunity by Product Type ($ million)
Data Table on Market opportunity by Product Type ($ million)

11. Customer Landscape

11.1 Customer landscape overview

Analysis of price sensitivity, lifecycle, customer purchase basket, adoption rates, and purchase criteria

12. Geographic Landscape

12.1 Geographic segmentation

Chart on Market share by geography 2025-2030 (%)
Data Table on Market share by geography 2025-2030 (%)

12.2 Geographic comparison

Chart on Geographic comparison
Data Table on Geographic comparison

12.3 APAC - Market size and forecast 2025-2030

Chart on APAC - Market size and forecast 2025-2030 ($ million)
Data Table on APAC - Market size and forecast 2025-2030 ($ million)
Chart on APAC - Year-over-year growth 2025-2030 (%)
Data Table on APAC - Year-over-year growth 2025-2030 (%)
Chart on Regional Comparison - APAC
Data Table on Regional Comparison - APAC

12.3.1 China - Market size and forecast 2025-2030

Chart on China - Market size and forecast 2025-2030 ($ million)
Data Table on China - Market size and forecast 2025-2030 ($ million)
Chart on China - Year-over-year growth 2025-2030 (%)
Data Table on China - Year-over-year growth 2025-2030 (%)

12.3.2 Japan - Market size and forecast 2025-2030

Chart on Japan - Market size and forecast 2025-2030 ($ million)
Data Table on Japan - Market size and forecast 2025-2030 ($ million)
Chart on Japan - Year-over-year growth 2025-2030 (%)
Data Table on Japan - Year-over-year growth 2025-2030 (%)

12.3.3 India - Market size and forecast 2025-2030

Chart on India - Market size and forecast 2025-2030 ($ million)
Data Table on India - Market size and forecast 2025-2030 ($ million)
Chart on India - Year-over-year growth 2025-2030 (%)
Data Table on India - Year-over-year growth 2025-2030 (%)

12.3.4 South Korea - Market size and forecast 2025-2030

Chart on South Korea - Market size and forecast 2025-2030 ($ million)
Data Table on South Korea - Market size and forecast 2025-2030 ($ million)
Chart on South Korea - Year-over-year growth 2025-2030 (%)
Data Table on South Korea - Year-over-year growth 2025-2030 (%)

12.3.5 Australia - Market size and forecast 2025-2030

Chart on Australia - Market size and forecast 2025-2030 ($ million)
Data Table on Australia - Market size and forecast 2025-2030 ($ million)
Chart on Australia - Year-over-year growth 2025-2030 (%)
Data Table on Australia - Year-over-year growth 2025-2030 (%)

12.3.6 Indonesia - Market size and forecast 2025-2030

Chart on Indonesia - Market size and forecast 2025-2030 ($ million)
Data Table on Indonesia - Market size and forecast 2025-2030 ($ million)
Chart on Indonesia - Year-over-year growth 2025-2030 (%)
Data Table on Indonesia - Year-over-year growth 2025-2030 (%)

12.4 North America - Market size and forecast 2025-2030

Chart on North America - Market size and forecast 2025-2030 ($ million)
Data Table on North America - Market size and forecast 2025-2030 ($ million)
Chart on North America - Year-over-year growth 2025-2030 (%)
Data Table on North America - Year-over-year growth 2025-2030 (%)
Chart on Regional Comparison - North America
Data Table on Regional Comparison - North America

12.4.1 US - Market size and forecast 2025-2030

Chart on US - Market size and forecast 2025-2030 ($ million)
Data Table on US - Market size and forecast 2025-2030 ($ million)
Chart on US - Year-over-year growth 2025-2030 (%)
Data Table on US - Year-over-year growth 2025-2030 (%)

12.4.2 Canada - Market size and forecast 2025-2030

Chart on Canada - Market size and forecast 2025-2030 ($ million)
Data Table on Canada - Market size and forecast 2025-2030 ($ million)
Chart on Canada - Year-over-year growth 2025-2030 (%)
Data Table on Canada - Year-over-year growth 2025-2030 (%)

12.4.3 Mexico - Market size and forecast 2025-2030

Chart on Mexico - Market size and forecast 2025-2030 ($ million)
Data Table on Mexico - Market size and forecast 2025-2030 ($ million)
Chart on Mexico - Year-over-year growth 2025-2030 (%)
Data Table on Mexico - Year-over-year growth 2025-2030 (%)

12.5 Europe - Market size and forecast 2025-2030

Chart on Europe - Market size and forecast 2025-2030 ($ million)
Data Table on Europe - Market size and forecast 2025-2030 ($ million)
Chart on Europe - Year-over-year growth 2025-2030 (%)
Data Table on Europe - Year-over-year growth 2025-2030 (%)
Chart on Regional Comparison - Europe
Data Table on Regional Comparison - Europe

12.5.1 UK - Market size and forecast 2025-2030

Chart on UK - Market size and forecast 2025-2030 ($ million)
Data Table on UK - Market size and forecast 2025-2030 ($ million)
Chart on UK - Year-over-year growth 2025-2030 (%)
Data Table on UK - Year-over-year growth 2025-2030 (%)

12.5.2 Germany - Market size and forecast 2025-2030

Chart on Germany - Market size and forecast 2025-2030 ($ million)
Data Table on Germany - Market size and forecast 2025-2030 ($ million)
Chart on Germany - Year-over-year growth 2025-2030 (%)
Data Table on Germany - Year-over-year growth 2025-2030 (%)

12.5.3 France - Market size and forecast 2025-2030

Chart on France - Market size and forecast 2025-2030 ($ million)
Data Table on France - Market size and forecast 2025-2030 ($ million)
Chart on France - Year-over-year growth 2025-2030 (%)
Data Table on France - Year-over-year growth 2025-2030 (%)

12.5.4 Italy - Market size and forecast 2025-2030

Chart on Italy - Market size and forecast 2025-2030 ($ million)
Data Table on Italy - Market size and forecast 2025-2030 ($ million)
Chart on Italy - Year-over-year growth 2025-2030 (%)
Data Table on Italy - Year-over-year growth 2025-2030 (%)

12.5.5 Spain - Market size and forecast 2025-2030

Chart on Spain - Market size and forecast 2025-2030 ($ million)
Data Table on Spain - Market size and forecast 2025-2030 ($ million)
Chart on Spain - Year-over-year growth 2025-2030 (%)
Data Table on Spain - Year-over-year growth 2025-2030 (%)

12.5.6 The Netherlands - Market size and forecast 2025-2030

Chart on The Netherlands - Market size and forecast 2025-2030 ($ million)
Data Table on The Netherlands - Market size and forecast 2025-2030 ($ million)
Chart on The Netherlands - Year-over-year growth 2025-2030 (%)
Data Table on The Netherlands - Year-over-year growth 2025-2030 (%)

12.6 South America - Market size and forecast 2025-2030

Chart on South America - Market size and forecast 2025-2030 ($ million)
Data Table on South America - Market size and forecast 2025-2030 ($ million)
Chart on South America - Year-over-year growth 2025-2030 (%)
Data Table on South America - Year-over-year growth 2025-2030 (%)
Chart on Regional Comparison - South America
Data Table on Regional Comparison - South America

12.6.1 Brazil - Market size and forecast 2025-2030

Chart on Brazil - Market size and forecast 2025-2030 ($ million)
Data Table on Brazil - Market size and forecast 2025-2030 ($ million)
Chart on Brazil - Year-over-year growth 2025-2030 (%)
Data Table on Brazil - Year-over-year growth 2025-2030 (%)

12.6.2 Argentina - Market size and forecast 2025-2030

Chart on Argentina - Market size and forecast 2025-2030 ($ million)
Data Table on Argentina - Market size and forecast 2025-2030 ($ million)
Chart on Argentina - Year-over-year growth 2025-2030 (%)
Data Table on Argentina - Year-over-year growth 2025-2030 (%)

12.6.3 Chile - Market size and forecast 2025-2030

Chart on Chile - Market size and forecast 2025-2030 ($ million)
Data Table on Chile - Market size and forecast 2025-2030 ($ million)
Chart on Chile - Year-over-year growth 2025-2030 (%)
Data Table on Chile - Year-over-year growth 2025-2030 (%)

12.7 Middle East and Africa - Market size and forecast 2025-2030

Chart on Middle East and Africa - Market size and forecast 2025-2030 ($ million)
Data Table on Middle East and Africa - Market size and forecast 2025-2030 ($ million)
Chart on Middle East and Africa - Year-over-year growth 2025-2030 (%)
Data Table on Middle East and Africa - Year-over-year growth 2025-2030 (%)
Chart on Regional Comparison - Middle East and Africa
Data Table on Regional Comparison - Middle East and Africa

12.7.1 UAE - Market size and forecast 2025-2030

Chart on UAE - Market size and forecast 2025-2030 ($ million)
Data Table on UAE - Market size and forecast 2025-2030 ($ million)
Chart on UAE - Year-over-year growth 2025-2030 (%)
Data Table on UAE - Year-over-year growth 2025-2030 (%)

12.7.2 South Africa - Market size and forecast 2025-2030

Chart on South Africa - Market size and forecast 2025-2030 ($ million)
Data Table on South Africa - Market size and forecast 2025-2030 ($ million)
Chart on South Africa - Year-over-year growth 2025-2030 (%)
Data Table on South Africa - Year-over-year growth 2025-2030 (%)

12.7.3 Saudi Arabia - Market size and forecast 2025-2030

Chart on Saudi Arabia - Market size and forecast 2025-2030 ($ million)
Data Table on Saudi Arabia - Market size and forecast 2025-2030 ($ million)
Chart on Saudi Arabia - Year-over-year growth 2025-2030 (%)
Data Table on Saudi Arabia - Year-over-year growth 2025-2030 (%)

12.7.4 Nigeria - Market size and forecast 2025-2030

Chart on Nigeria - Market size and forecast 2025-2030 ($ million)
Data Table on Nigeria - Market size and forecast 2025-2030 ($ million)
Chart on Nigeria - Year-over-year growth 2025-2030 (%)
Data Table on Nigeria - Year-over-year growth 2025-2030 (%)

12.7.5 Kenya - Market size and forecast 2025-2030

Chart on Kenya - Market size and forecast 2025-2030 ($ million)
Data Table on Kenya - Market size and forecast 2025-2030 ($ million)
Chart on Kenya - Year-over-year growth 2025-2030 (%)
Data Table on Kenya - Year-over-year growth 2025-2030 (%)

12.8 Market opportunity by geography

Market opportunity by geography ($ million)
Data Tables on Market opportunity by geography ($ million)

13. Drivers, Challenges, and Opportunity

13.1 Market drivers

Economic considerations and heightened value perception
Escalating consumer awareness of sustainability and circular economy principles
Proliferation of technology and expansion of digital resale ecosystems

13.2 Market challenges

Operational imperative of consistent sourcing and stringent quality control
Intrinsic complexity of reverse logistics and single SKU inventory management
Intensifying competition and pressing challenge of achieving sustainable profitability

13.3 Impact of drivers and challenges

Impact of drivers and challenges in 2025 and 2030

13.4 Market opportunities

Integration of recommerce into mainstream retail and brand strategy
Emergence of niche specialization and hyper curation
Convergence of physical and digital channels in phygital resale model

14. Competitive Landscape

14.1 Overview

14.2

Overview on criticality of inputs and factors of differentiation

14.3 Landscape disruption

Overview on factors of disruption

14.4 Industry risks

Impact of key risks on business

15. Competitive Analysis

15.1 Companies profiled

Companies covered

15.2 Company ranking index

15.3 Market positioning of companies

Matrix on companies position and classification

15.4 2nd Street USA Inc.

2nd Street USA Inc. - Overview
2nd Street USA Inc. - Product / Service
2nd Street USA Inc. - Key offerings
SWOT

15.5 Allbirds Inc.

Allbirds Inc. - Overview
Allbirds Inc. - Product / Service
Allbirds Inc. - Key offerings
SWOT

15.6 Arcteryx Sports Corp.

Arcteryx Sports Corp. - Overview
Arcteryx Sports Corp. - Product / Service
Arcteryx Sports Corp. - Key offerings
SWOT

15.7 Beyond Retro Ltd

Beyond Retro Ltd - Overview
Beyond Retro Ltd - Product / Service
Beyond Retro Ltd - Key offerings
SWOT

15.8 Clothes Mentor

Clothes Mentor - Overview
Clothes Mentor - Product / Service
Clothes Mentor - Key offerings
SWOT

15.9 Crossroads Trading

Crossroads Trading - Overview
Crossroads Trading - Product / Service
Crossroads Trading - Key offerings
SWOT

15.10 Depop Ltd.

Depop Ltd. - Overview
Depop Ltd. - Product / Service
Depop Ltd. - Key offerings
SWOT

15.11 Eileen Fisher Inc

Eileen Fisher Inc - Overview
Eileen Fisher Inc - Product / Service
Eileen Fisher Inc - Key offerings
SWOT

15.12 lululemon athletica Inc.

lululemon athletica Inc. - Overview
lululemon athletica Inc. - Business segments
lululemon athletica Inc. - Key offerings
lululemon athletica Inc. - Segment focus
SWOT

15.13 Madewell Inc

Madewell Inc - Overview
Madewell Inc - Product / Service
Madewell Inc - Key offerings
SWOT

15.14 Patagonia Inc.

Patagonia Inc. - Overview
Patagonia Inc. - Product / Service
Patagonia Inc. - Key offerings
SWOT

15.15 Poshmark Inc.

Poshmark Inc. - Overview
Poshmark Inc. - Product / Service
Poshmark Inc. - Key offerings
SWOT

15.16 The RealReal Inc.

The RealReal Inc. - Overview
The RealReal Inc. - Product / Service
The RealReal Inc. - Key offerings
SWOT

15.17 ThredUp Inc.

ThredUp Inc. - Overview
ThredUp Inc. - Product / Service
ThredUp Inc. - Key offerings
SWOT

15.18 VINTED INC.

VINTED INC. - Overview
VINTED INC. - Product / Service
VINTED INC. - Key offerings
SWOT

16. Appendix

16.1 Scope of the report

Market definition
Objectives
Notes and caveats

16.2 Inclusions and exclusions checklist

Inclusions checklist
Exclusions checklist

16.3 Currency conversion rates for US$

16.4 Research methodology

16.5 Data procurement

Information sources

16.6 Data validation

16.7 Validation techniques employed for market sizing

16.8 Data synthesis

16.9 360 degree market analysis

16.10 List of abbreviations

Research Methodology

Technavio presents a detailed picture of the market by way of study, synthesis, and summation of data from multiple sources. The analysts have presented the various facets of the market with a particular focus on identifying the key industry influencers. The data thus presented is comprehensive, reliable, and the result of extensive research, both primary and secondary.

INFORMATION SOURCES

Primary sources

  • Manufacturers and suppliers
  • Channel partners
  • Industry experts
  • Strategic decision makers

Secondary sources

  • Industry journals and periodicals
  • Government data
  • Financial reports of key industry players
  • Historical data
  • Press releases

DATA ANALYSIS

Data Synthesis

  • Collation of data
  • Estimation of key figures
  • Analysis of derived insights

Data Validation

  • Triangulation with data models
  • Reference against proprietary databases
  • Corroboration with industry experts

REPORT WRITING

Qualitative

  • Market drivers
  • Market challenges
  • Market trends
  • Five forces analysis

Quantitative

  • Market size and forecast
  • Market segmentation
  • Geographical insights
  • Competitive landscape

Interested in this report?

Get your sample now to see our research methodology and insights!

Download Now

Frequently Asked Questions

Secondhand Apparel market growth will increase by USD 245603.5 million during 2026-2030.

The Secondhand Apparel market is expected to grow at a CAGR of 15% during 2026-2030.

Secondhand Apparel market is segmented by End-user (Women, Men, Kids) Type (TTSD, Resale) Product type (Clothing, Footwear, Accessories, Bags)

2nd Street USA Inc., Allbirds Inc., Arcteryx Sports Corp., Beyond Retro Ltd, Clothes Mentor, Crossroads Trading, Depop Ltd., E.L.V. Denim Ltd, Eileen Fisher Inc, lululemon athletica Inc., Madewell Inc, MUD Jeans International B.V., Patagonia Inc., Poshmark Inc., Recreational Equipment Inc., Savers Value Village Inc, The RealReal Inc., ThredUp Inc., VINTED INC. are a few of the key vendors in the Secondhand Apparel market.

APAC will register the highest growth rate of 49.8% among the other regions. Therefore, the Secondhand Apparel market in APAC is expected to garner significant business opportunities for the vendors during the forecast period.

China, Japan, India, South Korea, Australia, Indonesia, US, Canada, Mexico, UK, Germany, France, Italy, Spain, The Netherlands, Brazil, Argentina, Chile, UAE, South Africa, Saudi Arabia, Nigeria, Kenya

  • Economic considerations and heightened value perception is the driving factor this market.

The Secondhand Apparel market vendors should focus on grabbing business opportunities from the End-user segment as it accounted for the largest market share in the base year.