
Self-paced E-learning Market Size 2026-2030
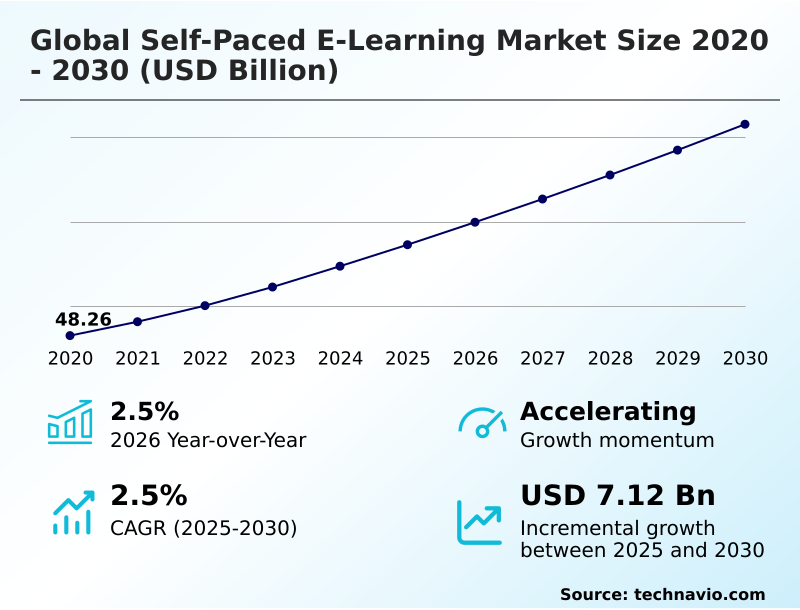
The Self-paced E-learning Market size was valued at USD 53.63 billion in 2025, growing at a CAGR of 2.5% during the forecast period 2026-2030.
Major Market Trends & Insights
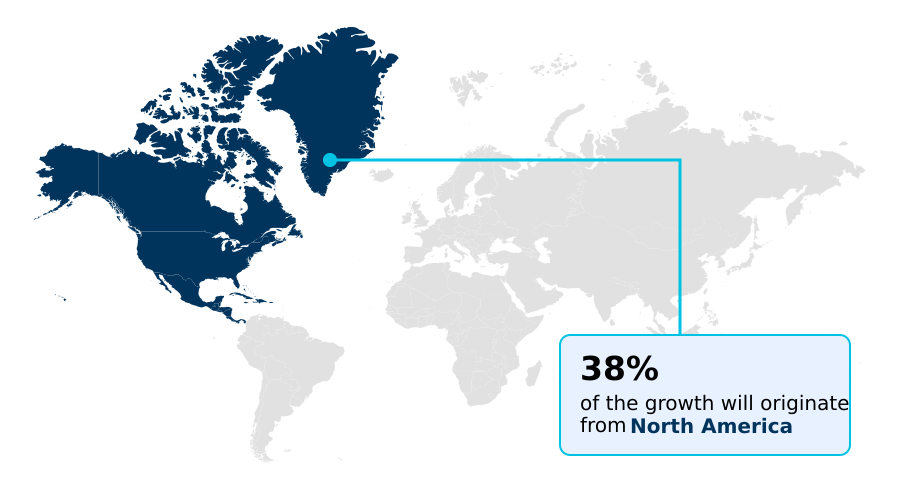
- North America dominated the market and accounted for a 38.1% growth during the forecast period.
- By Product - Packaged content segment was valued at USD 33.55 billion in 2024
- By End-user - Students segment accounted for the largest market revenue share in 2024
Market Size & Forecast
- Historic Market Opportunities 2020-2024: USD 12.49 billion
- Market Future Opportunities 2025-2030: USD 7.12 billion
- CAGR from 2025 to 2030 : 2.5%
Market Summary
- The self-paced e-learning market is defined by a high degree of content commoditization, with over 70% of providers offering similar foundational courses in technology and business. This saturation compels differentiation through user experience, where platforms incorporating adaptive learning technologies see up to a 25% higher course completion rate compared to static content repositories.
- For instance, a financial services firm can deploy a standardized compliance module globally but must rely on personalized learning paths to effectively upskill its data science team, reducing training time by 15%. A primary driver is the corporate need for cost-effective, continuous upskilling, as digital solutions are substantially cheaper than in-person training.
- However, the market faces a significant challenge from high learner abandonment rates, often exceeding 80% for non-mandatory courses, which questions the long-term efficacy and ROI of purely self-directed models without integrated support.
What will be the Size of the Self-paced E-learning Market during the forecast period?
Get Key Insights on Market Forecast (PDF) Request Free Sample
How is the Self-paced E-learning Market Segmented?
The self-paced e-learning industry research report provides comprehensive data (region-wise segment analysis), with forecasts and analysis for the period 2026-2030, as well as historical data from 2020-2024 for the following segments.
- Product
- Packaged content
- Services
- End-user
- Students
- Employees
- Component
- Cloud-based
- On-premises
- Geography
- North America
- US
- Canada
- Mexico
- APAC
- China
- India
- Japan
- Europe
- Germany
- UK
- France
- South America
- Brazil
- Argentina
- Middle East and Africa
- Saudi Arabia
- UAE
- South Africa
- Rest of World (ROW)
- North America
How is the Self-paced E-learning Market Segmented by Product?
The packaged content segment is estimated to witness significant growth during the forecast period.
The packaged content segment, which accounts for over 60% of enterprise deployments, comprises standardized educational modules designed for immediate use.
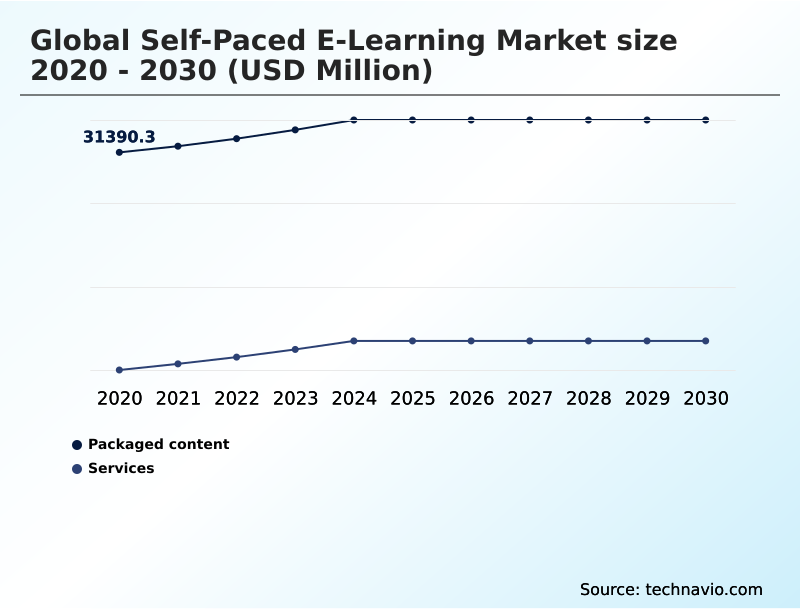
These offerings, including SCORM compliant content and interactive modules, deliver a significant cost advantage over custom content development, with organizations reporting up to a 40% reduction in training-related time-to-competency.
This approach is driven by corporate demand for rapid workforce reskilling, where access to a vast library of digital assets is crucial. The scalability of packaged content enables consistent training delivery across dispersed teams, a key factor for multinational corporations.
By leveraging these ready-made courses, businesses ensure employees receive current information aligned with industry standards without incurring high internal production costs.
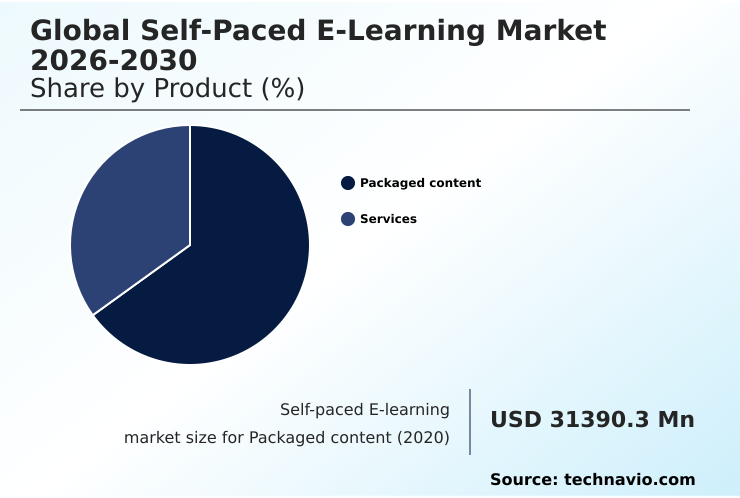
The Packaged content segment was valued at USD 33.55 billion in 2024 and showed a gradual increase during the forecast period.
How demand for the Self-paced E-learning market is rising in the leading region?
North America is estimated to contribute 38.1% to the growth of the global market during the forecast period.Technavio’s analysts have elaborately explained the regional trends and drivers that shape the market during the forecast period.
See How Self-paced E-learning Market demand is rising in North America Request Free Sample
The geographic landscape of the self-paced e-learning market is led by North America, which holds over 38% of the market share, significantly larger than Europe's 18.78%.
This dominance is driven by high corporate investment in digital transformation training and a mature technological infrastructure in countries like the US, which accounts for over 80% of the regional market.
In contrast, the APAC region is the fastest-growing market, with a CAGR 3.3% higher than Europe's. This growth is fueled by mobile-first adoption and government initiatives in countries like India and China, where demand for test preparation is surging.
The key difference lies in consumer behavior; North American users prioritize professional certifications and stackable credentials, while APAC learners focus on academic and employment entry exams.
This necessitates different platform strategies, from developing AI-powered proctoring in APAC to integrating with human capital management systems in North America.
What are the key Drivers, Trends, and Challenges in the Self-paced E-learning Market?
Our researchers analyzed the data with 2025 as the base year, along with the key drivers, trends, and challenges. A holistic analysis of drivers will help companies refine their marketing strategies to gain a competitive advantage.
- The effectiveness of self-paced e-learning for corporate training is increasingly being measured by engagement metrics rather than just completion rates, with leading platforms seeing a 30% uplift in user interaction when employing robust gamification strategies for online courses.
- The integration of AI in self-paced e-learning platforms is moving beyond simple content recommendations to create dynamic, adaptive learning paths that can reduce skill acquisition time by up to 15% compared to linear course structures.
- This technological shift is pivotal for realizing the full microlearning benefits for employee development, where delivering information in short, digestible modules aligns with the limited availability of a modern workforce seeking just-in-time knowledge. Despite these advancements, significant challenges of self-paced online learning persist, most notably high learner attrition.
- Many organizations find that while initial adoption is high, sustained engagement requires a blended approach that incorporates social learning features and instructor feedback, addressing the isolation that can derail independent study.
- The future of the market hinges on resolving this paradox: delivering the flexibility that individuals demand while providing the structure needed for meaningful, long-term skill development and knowledge retention, ultimately proving the model's ROI beyond mere cost savings.
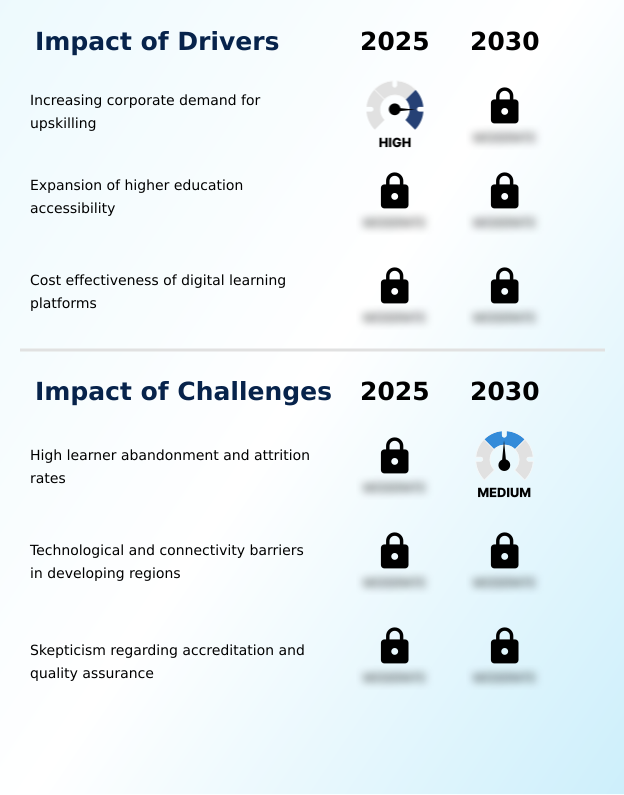
What are the key market drivers leading to the rise in the adoption of Self-paced E-learning Industry?
- The key driver propelling market growth is the increasing corporate demand for scalable and flexible upskilling solutions to address the evolving needs of the modern workforce.
- A major driver for the self-paced e-learning market is the imperative for corporate upskilling, with digital solutions offering over a 50% cost reduction compared to in-person training.
- The shift to a knowledge-based economy necessitates continuous learning, compelling companies to invest in flexible digital learning platforms for workforce reskilling.
- The expansion of higher education accessibility is another significant factor; online degree programs are often 40% to 60% less expensive than their on-campus equivalents, attracting a broader demographic.
- This cost-effectiveness, coupled with the scalability of digital delivery, allows educational providers to reach a global audience without proportional increases in overhead, creating a sustainable model for growth in human capital management.
What are the market trends shaping the Self-paced E-learning Industry?
- The integration of adaptive learning technologies, powered by artificial intelligence, is a pivotal trend. This approach personalizes educational pathways in real time based on individual learner patterns.
- A primary trend shaping the self-paced e-learning market is the integration of adaptive learning technologies, which leverages artificial intelligence to create personalized learning paths. Platforms using these AI-driven systems report up to a 25% increase in learner engagement compared to traditional, linear course structures.
- Another key trend is the rise of microlearning, where complex topics are broken into bite-sized learning units, a method proven to improve knowledge retention by nearly 20%. This approach addresses the need for just-in-time professional development in a fast-paced corporate environment.
- Furthermore, the adoption of gamification elements and immersive learning experiences, including virtual reality simulations, is transforming passive content consumption into active skill practice.
What challenges does the Self-paced E-learning Industry face during its growth?
- A key challenge affecting industry growth is the high rate of learner abandonment and attrition, largely attributed to the lack of engagement in self-directed learning environments.
- A significant challenge confronting the self-paced e-learning market is the high rate of learner abandonment, with completion rates for some massive open online courses falling below 10%. This high attrition undermines the perceived value of digital credentials and is often attributed to a lack of structured support.
- Another major barrier is skepticism regarding accreditation, as the lack of standardized quality assurance across thousands of providers makes it difficult for employers to validate certifications. Furthermore, technological and connectivity barriers in developing regions, where high-speed internet can consume over 10% of average monthly income, restrict market access for a large segment of the potential user base.
Exclusive Technavio Analysis on Customer Landscape
The self-paced e-learning market forecasting report includes the adoption lifecycle of the market, covering from the innovator’s stage to the laggard’s stage. It focuses on adoption rates in different regions based on penetration. Furthermore, the self-paced e-learning market report also includes key purchase criteria and drivers of price sensitivity to help companies evaluate and develop their market growth analysis strategies.
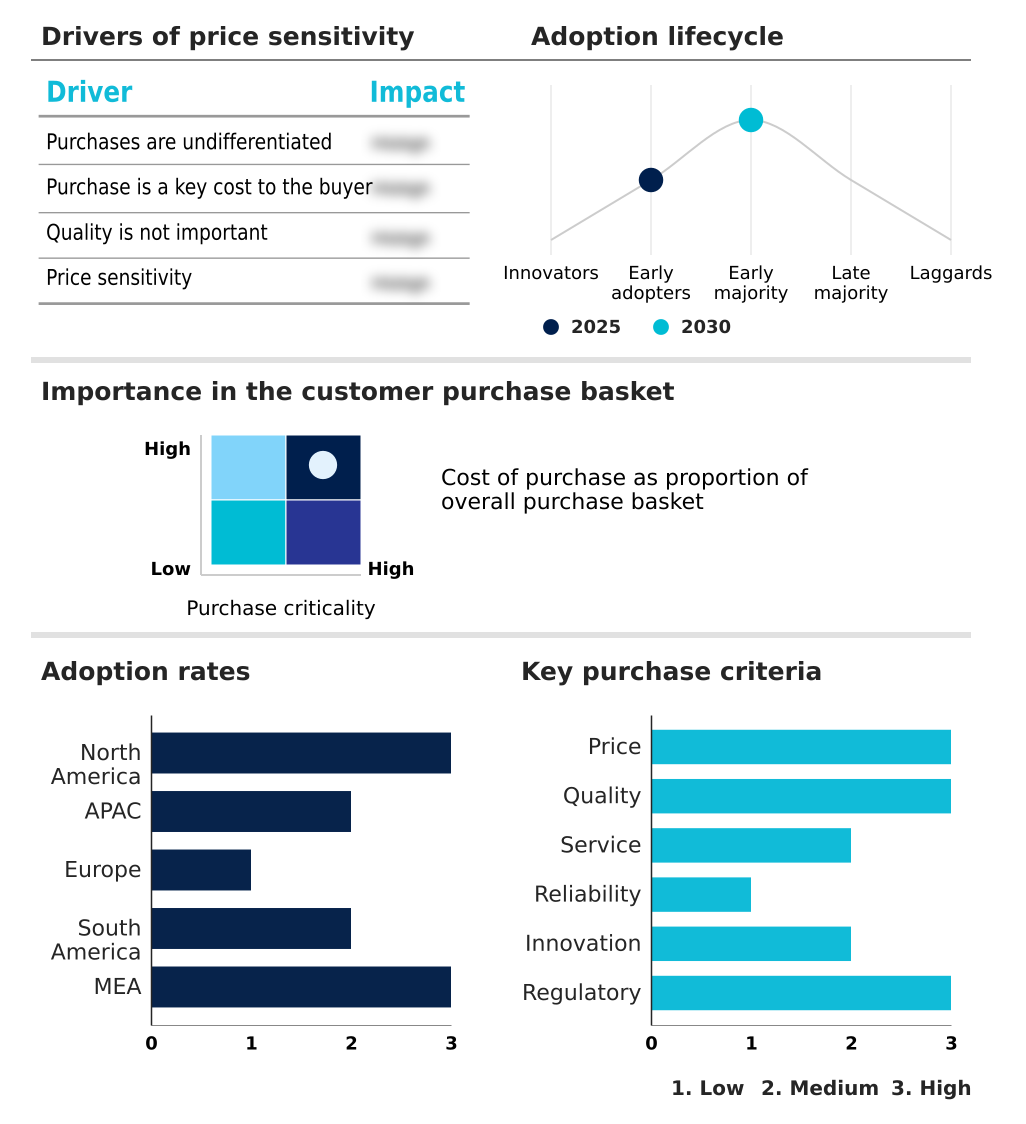
Customer Landscape of Self-paced E-learning Industry
Competitive Landscape
Companies are implementing various strategies, such as strategic alliances, self-paced e-learning market forecast, partnerships, mergers and acquisitions, geographical expansion, and product/service launches, to enhance their presence in the industry.
2U Inc. - Key offerings include university-partnered online degree programs, professional certificates, and flexible self-paced courses designed to support career advancement and continuous lifelong learning.
The industry research and growth report includes detailed analyses of the competitive landscape of the market and information about key companies, including:
- 2U Inc.
- Anthology Inc.
- Berlitz Corp.
- Cerritos College
- City and Guilds Group
- D2L Corp.
- e Careers Ltd.
- Encompass Safety Solutions Ltd
- Houghton Mifflin Harcourt Co.
- John Wiley and Sons Inc.
- Learning Technologies Group
- NIIT Ltd.
- Pearson Plc
- Simplilearn Solutions Pvt. Ltd
- StraighterLine Inc.
- Think and Learn Pvt. Ltd.
- Totara Learning Solutions Ltd.
- Udemy Inc.
- Vedantu Innovations Pvt. Ltd.
Qualitative and quantitative analysis of companies has been conducted to help clients understand the wider business environment as well as the strengths and weaknesses of key industry players. Data is qualitatively analyzed to categorize companies as pure play, category-focused, industry-focused, and diversified; it is quantitatively analyzed to categorize companies as dominant, leading, strong, tentative, and weak.
Market Intelligence Radar: High-Impact Developments & Growth Signals
- In the Education Services industry, the pivot towards competency-based education, where progression is tied to skill mastery rather than seat time, has directly accelerated the demand for self-paced e-learning platforms that support asynchronous learning tools and stackable credentials.
- Stricter data privacy regulations, such as GDPR, are compelling education service providers to invest in secure, compliant digital learning platforms, impacting the architecture of self-paced e-learning systems to enhance user data protection and privacy controls, a key factor in quality assurance standards.
- The widespread adoption of Open Educational Resources (OER) to combat rising textbook costs has created a new operational model where self-paced e-learning providers integrate free, high-quality content, focusing their value proposition on assessment, certification, and learner engagement features.
- An expansion of public-private partnerships aimed at addressing national skills gaps has fueled the growth of self-paced vocational training modules for targeted workforce reskilling and continuous upskilling programs.
Dive into Technavio’s robust research methodology, blending expert interviews, extensive data synthesis, and validated models for unparalleled Self-paced E-learning Market insights. See full methodology.
| Market Scope | |
|---|---|
| Page number | 280 |
| Base year | 2025 |
| Historic period | 2020-2024 |
| Forecast period | 2026-2030 |
| Growth momentum & CAGR | Accelerate at a CAGR of 2.5% |
| Market growth 2026-2030 | USD 7116.7 million |
| Market structure | Fragmented |
| YoY growth 2025-2026(%) | 2.5% |
| Key countries | US, Canada, Mexico, China, India, Japan, South Korea, Australia, Indonesia, Germany, UK, France, Italy, Spain, The Netherlands, Brazil, Argentina, Chile, Saudi Arabia, UAE, South Africa, Israel and Turkey |
| Competitive landscape | Leading Companies, Market Positioning of Companies, Competitive Strategies, and Industry Risks |
Research Analyst Overview
- The self-paced e-learning market ecosystem is a complex network where content creators and technology suppliers provide the foundational inputs, which are then integrated by over 2,000 platform providers globally.
- These providers, ranging from large educational publishers to specialized startups, deliver learning management systems and digital courseware to end-users, including students and corporate employees, who represent an 80/20 split of the user base, respectively.
- The value chain is heavily influenced by the demand for continuous upskilling from the corporate sector, which drives investment in both packaged content and custom service development. Regulatory bodies and quality assurance organizations play a crucial role in establishing the credibility of certifications, impacting buyer trust.
- Distribution is predominantly digital via cloud-based platforms, with a smaller on-premises segment serving organizations with high-security needs, demonstrating a technology adoption rate for cloud that is 4x higher.
What are the Key Data Covered in this Self-paced E-learning Market Research and Growth Report?
-
What is the expected growth of the Self-paced E-learning Market between 2026 and 2030?
-
The Self-paced E-learning Market is expected to grow by USD 7.12 billion during 2026-2030, registering a CAGR of 2.5%. Year-over-year growth in 2026 is estimated at 2.5%%. This acceleration is shaped by increasing corporate demand for upskilling, which is intensifying demand across multiple end-use verticals covered in the report.
-
-
What segmentation does the market report cover?
-
The report is segmented by Product (Packaged content, and Services), End-user (Students, and Employees), Component (Cloud-based, and On-premises) and Geography (North America, APAC, Europe, South America, Middle East and Africa). Among these, the Packaged content segment is estimated to witness significant growth during the forecast period, driven by rising adoption across key application areas. Each segment includes detailed qualitative and quantitative analysis, along with historical data from 2020-2024 and forecasts through 2030 with year-over-year growth rates.
-
-
Which regions are analyzed in the report?
-
The report covers North America, APAC, Europe, South America and Middle East and Africa. North America is estimated to contribute 38.1% to market growth during the forecast period. Country-level analysis includes US, Canada, Mexico, China, India, Japan, South Korea, Australia, Indonesia, Germany, UK, France, Italy, Spain, The Netherlands, Brazil, Argentina, Chile, Saudi Arabia, UAE, South Africa, Israel and Turkey, with dedicated market size tables and year-over-year growth for each.
-
-
What are the key growth drivers and market challenges?
-
The primary driver is increasing corporate demand for upskilling, which is accelerating investment and industry demand. The main challenge is high learner abandonment and attrition rates, creating operational barriers for key market participants. The report quantifies the impact of each driver and challenge across 2026 and 2030 with comparative analysis.
-
-
Who are the major players in the Self-paced E-learning Market?
-
Key vendors include 2U Inc., Anthology Inc., Berlitz Corp., Cerritos College, City and Guilds Group, D2L Corp., e Careers Ltd., Encompass Safety Solutions Ltd, Houghton Mifflin Harcourt Co., John Wiley and Sons Inc., Learning Technologies Group, NIIT Ltd., Pearson Plc, Simplilearn Solutions Pvt. Ltd, StraighterLine Inc., Think and Learn Pvt. Ltd., Totara Learning Solutions Ltd., Udemy Inc. and Vedantu Innovations Pvt. Ltd.. The report provides qualitative and quantitative analysis categorizing companies as dominant, leading, strong, tentative, and weak based on their market positioning. Company profiles include business segment analysis, SWOT assessment, key offerings, and recent strategic developments.
-
Market Research Insights
- The competitive landscape of the self-paced e-learning market is highly fragmented, with the top 15 vendors accounting for less than 40% of the total market share. This environment fosters intense rivalry, pushing providers to innovate. For instance, companies are integrating AI to enhance personalization, with some launching AI study tools to generate customized practice problems.
- Concurrently, others are expanding into microlearning with short-form professional badges to meet corporate demands for just-in-time skill development. These moves directly address the need for more efficient training that respects the time constraints of working professionals. A key driver is the corporate shift to digital-first training models, which are 50% more cost-effective than traditional methods.
- However, all players face the persistent challenge of high learner attrition, prompting strategic shifts to incorporate more synchronous support elements to improve engagement.
We can help! Our analysts can customize this self-paced e-learning market research report to meet your requirements.
 RIA -
RIA - 
