Sequencing Reagents Market Analysis North America, Europe, Asia, Rest of World (ROW) - US, Canada, Germany, UK, China, France, Italy, Japan, India, South Korea - Size and Forecast 2024-2028

Sequencing Reagents Market Analysis North America, Europe, Asia, Rest of World (ROW) - US, Canada, Germany, UK, China, France, Italy, Japan, India, South Korea - Size and Forecast 2024-2028

Published: Nov 2024 165 Pages SKU: IRTNTR72545

Market Overview at a Glance

$4.11 B
Market Opportunity
12.4%
CAGR
10.6
YoY growth 2023-2024(%)

Sequencing Reagents Market Size and Trends

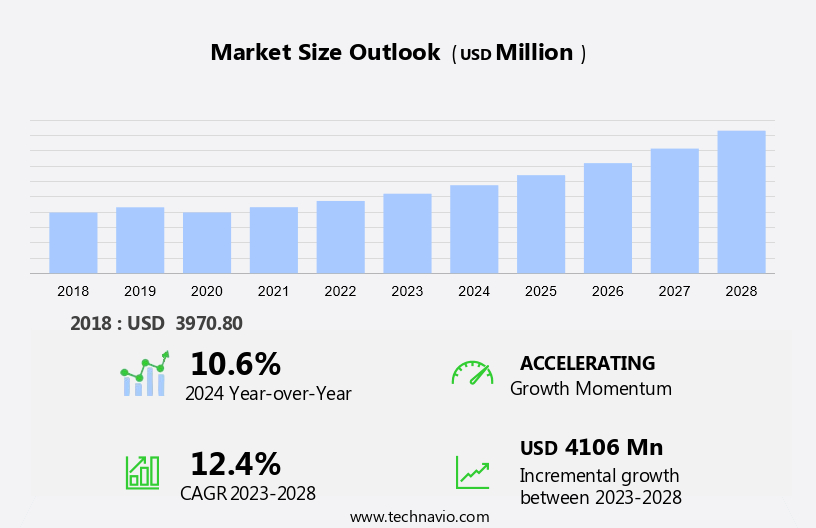
The sequencing reagents market size is forecast to increase by USD 4.11 billion, at a CAGR of 12.4% between 2023 and 2028.  The market is witnessing significant growth due to the increasing importance of genomic information science in various sectors, particularly in human health. With the completion of the human genome project, genome mapping and sequencing have become essential tools in understanding genome positions and their roles in diseases, including metastatic breast cancer. The advances in genome sequencing technology, such as next-generation sequencing techniques, have made it more accessible and affordable for researchers and healthcare providers. However, there are still challenges, including the need for advanced bioinformatics tools to analyze the vast amounts of data generated from genome sequencing. Additionally, inadequate resources for DNA sequencing in developing countries present an opportunity for market growth. As cancer diagnosis and treatment continue to rely on genomic information, the market is expected to expand.

Sequencing Reagents Market Size

 Request Free Sample

The market is witnessing significant growth due to the increasing demand for genomic analysis in various sectors, including drug discovery, gene therapy, molecular diagnostics, and genomic medicine. This market is driven by the need for accurate and efficient sequencing tests to identify genetic variants, DNA methylation, gene expression profiling, and biomarker discovery. Genomic analysis plays a crucial role in disease risk assessment, disease movement, genome-wide association studies, and precision medicine. The application of sequencing reagents in cancer immunotherapy, genome interpretation, and disease prediction is also gaining popularity. Liquid biopsy, a minimally invasive diagnostic approach, is another area where sequencing reagents are extensively used. The biotechnology industry is at the forefront of innovation in the field of genomic analysis. Technological advancements in RNA sequencing, genomic data analysis, and genome information have led to the development of next-generation sequencing (NGS) technologies. These technologies enable high-throughput sequencing, which is essential for population genomics and clinical genomics. The market is expected to grow as the use of genomic data in healthcare innovation continues to expand. Gene editing, personalized medicine, genetic counseling, and synthetic biology are some of the emerging areas where sequencing reagents are finding applications. Data processing and genome analysis are critical components of the sequencing workflow.

The market is driven by the need for accurate and efficient sequencing tests to identify genetic variants, DNA methylation, gene expression profiling, and biomarker discovery. The use of sequencing reagents in drug discovery, gene therapy, molecular diagnostics, and genomic medicine is expected to continue to grow, providing opportunities for market participants. In conclusion, the market is a dynamic and growing market, driven by the increasing demand for genomic analysis in various sectors. The market is expected to continue to grow as the use of genomic data in healthcare innovation expands. The accuracy and reliability of sequencing reagents are essential to ensure the quality of genomic data and drive the demand for these reagents. The market is expected to provide opportunities for participants as the use of sequencing reagents in drug discovery, gene therapy, molecular diagnostics, and genomic medicine continues to grow.

Market Segmentation

The market research report provides comprehensive data (region-wise segment analysis), with forecasts and estimates in "USD billion" for the period 2024-2028, as well as historical data from 2018 - 2022 for the following segments.

  • Technology
    • Next-generation sequencing
    • Sanger sequencing
    • Third generation sequencing
  • Geography
    • North America
      • Canada
      • US
    • Europe
      • Germany
      • UK
      • France
      • Italy
    • Asia
      • China
      • India
      • Japan
      • South Korea
    • Rest of World (ROW)

By Technology Insights

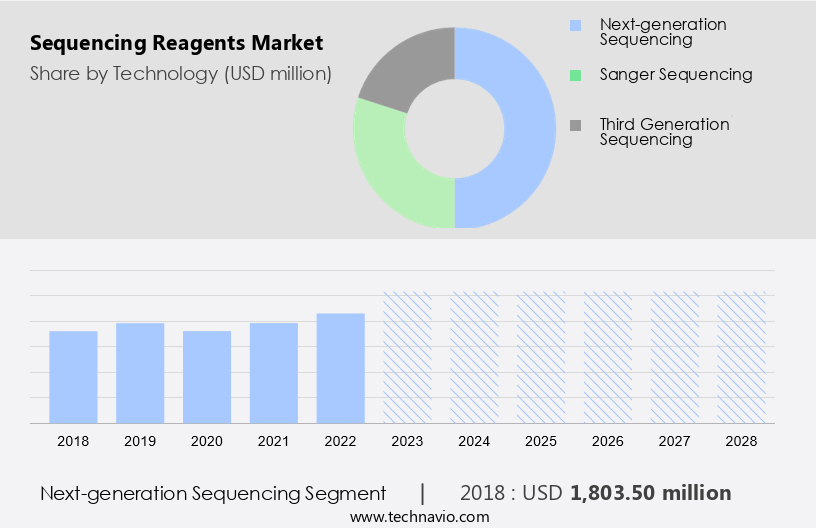
The next-generation sequencing segment is estimated to witness significant growth during the forecast period. The market is experiencing significant growth due to the increasing demand for next-generation sequencing (NGS) technologies in various sectors, including human genome research, genomic information science, and healthcare. NGS technologies, such as Sequencing by Synthesis (SBS), Ion Semiconductor Sequencing, and Nanopore Sequencing, are transforming the market with their advanced capabilities and broad applications. These technologies offer high throughput, scalability, and speed, making them essential for clinical diagnostics, drug discovery, and personalized medicine.

Sequencing Reagents Market Size

Get a glance at the market share of various segments Download the PDF Sample

The next-generation sequencing segment was valued at USD 1.80 billion in 2018. SBS technology, a type of NGS, is the most widely used due to its high accuracy and ability to generate large volumes of data. Leading companies, such as Illumina, have pioneered this technology, providing comprehensive solutions that include reagents, instruments, and software. In the healthcare sector, NGS technologies are being used to diagnose and treat conditions like metastatic breast cancer by identifying genome positions associated with the disease. Bioinformatics tools are used to analyze the genomic data, aiding in cancer diagnosis and treatment. The science of genomics continues to evolve, and the market is poised to grow as these technologies become more accessible and affordable.

Regional Analysis

Sequencing Reagents Market Share by Geography

For more insights on the market share of various regions Download PDF Sample now!

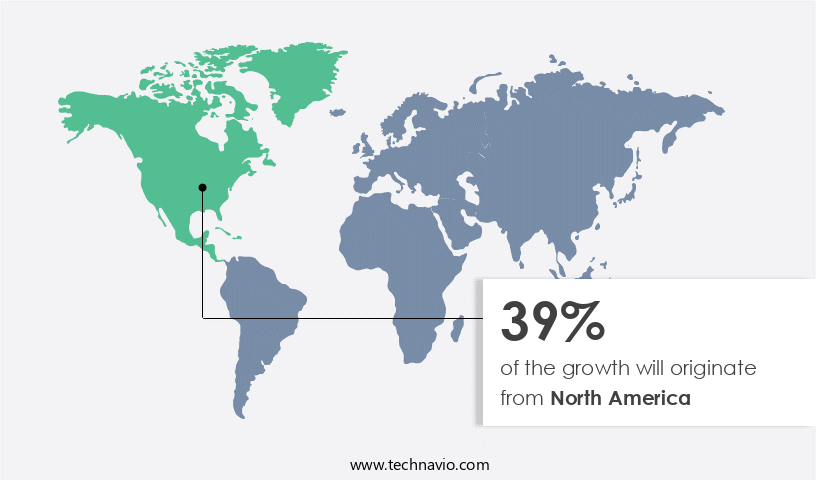
North America is estimated to contribute 39% to the growth of the global market during the forecast period. Technavio's analysts have elaborately explained the regional trends and drivers that shape the market during the forecast period. In North America, the market holds a substantial share due to the region's advanced research infrastructure, substantial funding, and technological innovations. The United States is a significant contributor to this market's growth. Extensive research funding from both government and private sectors, such as the National Institutes of Health (NIH) investments in genomic research, drives the demand for sequencing reagents in applications like clinical diagnostics, oncology, and personalized medicine. Furthermore, the presence of prominent life sciences companies, including Illumina and Thermo Fisher Scientific, bolsters the market's strength. Fluorescent dyes and modified nucleotides are essential reagents in genomic medicine, enabling the acquisition of functional information from sequencing projects.

These reagents play a crucial role in the identification of disease characteristics and the development of targeted therapies. As sequencing costs decrease, the demand for these reagents is expected to increase, leading to potential growth opportunities for reagent manufacturers. Effective data storage and management systems are also essential for handling the massive amounts of data generated during sequencing projects. Overall, the North American market is poised for continued growth due to these factors.

Our researchers analyzed the data with 2023 as the base year, along with the key drivers, trends, and challenges. A holistic analysis of drivers will help companies refine their marketing strategies to gain a competitive advantage.

Sequencing Reagents Market Driver

The increasing affordability of DNA sequencing is notably driving market growth. The market has experienced a notable reduction in the expense of DNA sequencing as a result of technological innovations. For example, the National Human Genome Research Institute (NHGRI) in the US reports that the cost of sequencing one million bases of DNA dropped from approximately USD 1,000 in 2004 to a mere penny in 2019. The NHGRI has amassed extensive data on DNA sequencing costs over the years through the institute-funded sequencing centers. This data, analyzed and compiled by the NHGRI, provides valuable insights into the advancements in DNA sequencing technologies. Cost reduction in DNA sequencing has significant implications for tailored medical treatments, particularly for chronic illnesses and drug-resistant conditions such as tuberculosis (TB). Molecular diagnostics, which rely on sequencing techniques, are becoming increasingly important in the identification and treatment of these conditions. Array-based technologies, rapid exome sequencing, and ultra-rapid genome sequencing are some of the techniques driving this trend.

In addition, the market is witnessing a significant drop in costs, which is leading to increased adoption in various applications, particularly in healthcare and bio-pharmaceuticals. This trend is expected to continue as technological advances continue to drive down costs and improve the speed and accuracy of sequencing techniques. The potential for personalized treatments and the development of new drugs are key drivers of market growth. Thus, such factors are driving the growth of the market during the forecast period.

Sequencing Reagents Market Trends

Advances in next generation sequencing techniques is the key trend in the market. Next-generation sequencing (NGS) technology has revolutionized the field of DNA sequencing by enabling the rapid and cost-effective arrangement of DNA at a scale never before possible. The Human Genome Project (HGP), initiated in 1990, laid the groundwork for this innovation, providing a comprehensive understanding of the human genome's structure and function. NGS technology has since found applications in various clinical settings, particularly in the diagnosis and treatment of diseases such as cancer. By identifying genetic variations, researchers and medical practitioners can develop companion diagnostics and personalized treatment plans for patients. The cost reduction of sequencing reagents, a crucial component of NGS, has made this technology accessible to a broader range of laboratories. This affordability has led to increased adoption and innovation in the field, contributing to advancements in chronic disease research and oncology.

As a result, the application of NGS technology continues to expand, providing valuable insights into the genetic basis of various diseases and contributing to the development of new therapeutic approaches. In summary, the advent of NGS technology and the Human Genome Project have paved the way for significant advancements in the field of genomics. The reduction in the cost of sequencing reagents and the availability of open-source licenses have made this technology accessible to a broader range of researchers and medical practitioners, leading to new discoveries and innovative applications in various clinical environments. Thus, such trends will shape the growth of the market during the forecast period.

Sequencing Reagents Market Challenge

Inadequate resources for DNA sequencing in developing countries is the major challenge that affects the growth of the market. The field of genome sequencing has witnessed substantial advancements, leading to enhanced investigative accuracy and decreased costs. Consequently, the utilization of genome sequencing has broadened, with applications ranging from economic genome sequencing in research institutions to intensive care units for diagnostic studies. However, developing countries face challenges in fully leveraging genome sequencing due to limited funding. This lack of funding can be attributed to several factors, including a shortage of skilled personnel, the high costs of establishing and maintaining sequencing facilities, the inconsistency of outsourcing services, and restricted access to essential tools, such as sequencing reagents, for genomic data analysis and manipulation.

For instance, the cost of analyzing a sequencing platform can reach nearly USD 100,000, while a single sequencing reaction may cost over USD 1,000 per genome. In the market, third-generation sequencing technologies, including single-molecule real-time and oxford nanopore sequencer, are gaining popularity for their ability to generate longer reads and higher genome sequencing accuracy, thereby enhancing the diagnostic value of genomic surveillance in various sectors, including in-vitro diagnostics and pathology. Hence, the above factors will impede the growth of the market during the forecast period.

Exclusive Customer Landscape

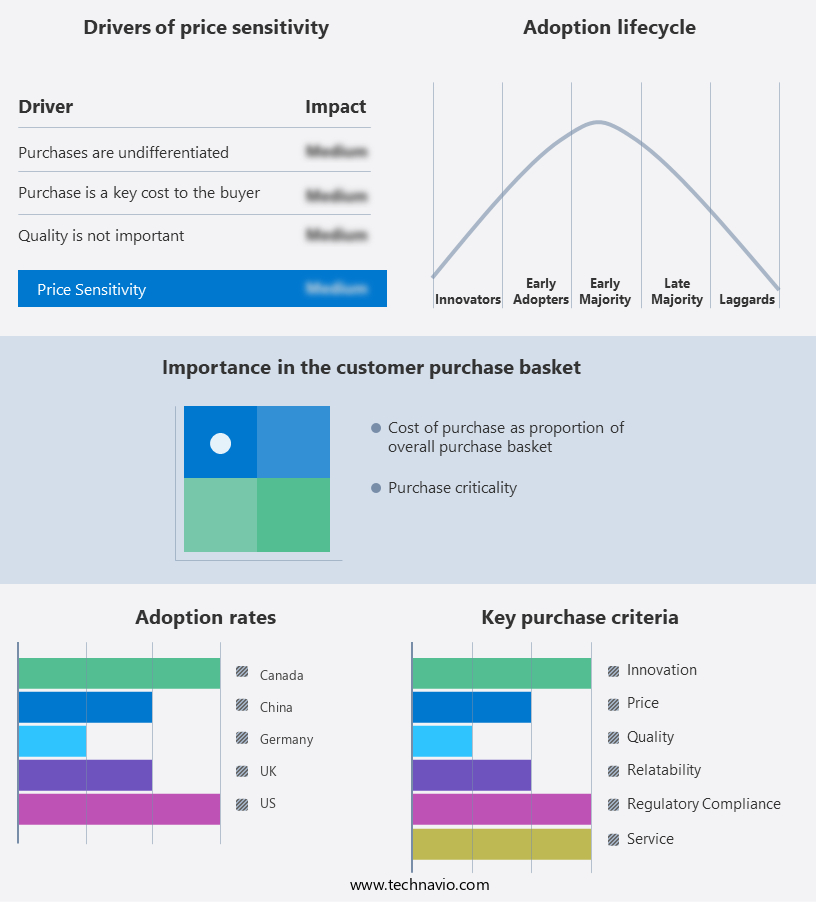
The market forecasting report includes the adoption lifecycle of the market, covering from the innovator's stage to the laggard's stage. It focuses on adoption rates in different regions based on penetration. Furthermore, the report also includes key purchase criteria and drivers of price sensitivity to help companies evaluate and develop their market growth analysis strategies.

Sequencing Reagents Market Share by Geography

 Customer Landscape

Key Companies & Market Insights

Companies are implementing various strategies, such as strategic alliances, partnerships, mergers and acquisitions, geographical expansion, and product/service launches, to enhance their presence in the market.

Roche.com - The company offers sarcoma therapeutics products under the brand name of Tibsovo.

The market research and growth report also includes detailed analyses of the competitive landscape of the market and information about key companies, including:

  • BGI Group
  • BioChain Institute Inc.
  • F. Hoffmann La Roche Ltd.
  • Fluidigm Corp.
  • FroggaBio Inc.
  • Illumina Inc.
  • LGC Biosearch Technologies
  • Merck KGaA
  • Meridian Bioscience Inc
  • New England Biolabs Inc.
  • Oxford Nanopore Technologies plc
  • Pacific Biosciences of California Inc.
  • Perkin Elmer Inc.
  • QIAGEN N.V.
  • Takara Bio Inc.
  • Tecan Trading AG
  • Thermo Fisher Scientific Inc.
  • Trilink Biotechnologies

Qualitative and quantitative analysis of companies has been conducted to help clients understand the wider business environment as well as the strengths and weaknesses of key market players. Data is qualitatively analyzed to categorize companies as pure play, category-focused, industry-focused, and diversified; it is quantitatively analyzed to categorize companies as dominant, leading, strong, tentative, and weak.

The market is a significant segment of the life sciences industry, fueled by the advancements in DNA sequencing technology. Sequencing reagents play a crucial role in the process of DNA sequencing, enabling the arrangement of nucleotides in their correct order to decipher the genetic information contained within DNA sequences. Next-generation sequencing (NGS) technologies, such as nanopores and single-molecule real-time, have revolutionized the field of genomic information science by offering ultra-rapid genome sequencing and reduced costs. These advancements have opened up new opportunities in various sectors, including oncology, chronic diseases, and molecular diagnostics. Reagent manufacturers continue to innovate, developing modified nucleotides and fluorescent dyes to improve sequencing accuracy and efficiency. The cost structure of sequencing projects includes both direct costs, such as reagent expenses, and indirect charges, such as license fees and data storage.

Moreover, the application of genomic data science in areas like cancer diagnosis and treatment, drug-resistant TB, and genomic surveillance in intensive care units, has led to tailored medical treatments based on an individual's genetic makeup. The use of open-source licenses and array-based technologies has further accelerated research in genomic medicine. The bio-pharmaceutical expenditure on genomic research and development is expected to grow as the importance of genomic information in understanding disease characteristics and developing targeted therapies becomes increasingly recognized. The future of the market lies in the continued innovation and integration of these technologies into various industries and applications.

Market Scope

Report Coverage

Details

Page number

165

Base year

2023

Historic period

2018 - 2022

Forecast period

2024-2028

Growth momentum & CAGR

Accelerate at a CAGR of 12.4%

Market Growth 2024-2028

USD 4.11 billion

Market structure

Fragmented

YoY growth 2023-2024(%)

10.6

Regional analysis

North America, Europe, Asia, and Rest of World (ROW)

Performing market contribution

North America at 39%

Key countries

US, Canada, Germany, UK, China, France, Italy, Japan, India, and South Korea

Competitive landscape

Leading Companies, Market Positioning of Companies, Competitive Strategies, and Industry Risks

Key companies profiled

Agilent Technologies Inc., BGI Group, BioChain Institute Inc., F. Hoffmann La Roche Ltd., Fluidigm Corp., FroggaBio Inc., Illumina Inc., LGC Biosearch Technologies, Merck KGaA, Meridian Bioscience Inc, New England Biolabs Inc., Oxford Nanopore Technologies plc, Pacific Biosciences of California Inc., Perkin Elmer Inc., QIAGEN N.V., Takara Bio Inc., Tecan Trading AG, Thermo Fisher Scientific Inc., and Trilink Biotechnologies

Market dynamics

Parent market analysis, Market growth inducers and obstacles, Fast-growing and slow-growing segment analysis, COVID-19 impact and recovery analysis and future consumer dynamics, Market condition analysis for market forecast period.

Customization purview

If our market report has not included the data that you are looking for, you can reach out to our analysts and get segments customized.

Download PDF Sample

What are the Key Data Covered in this Market Research Report?

  • CAGR of the market during the forecast period
  • Detailed information on factors that will drive the market growth and forecasting between 2024 and 2028
  • Precise estimation of the size of the market  and its contribution of the market in focus to the parent market
  • Accurate predictions about upcoming market growth and trends and changes in consumer behaviour
  • Growth of the market across North America, Europe, Asia, and Rest of World (ROW)
  • Thorough analysis of the market's competitive landscape and detailed information about companies
  • Comprehensive analysis of factors that will challenge the growth of market companies

We can help! Our analysts can customize this market research report to meet your requirements.

Get in touch

1 Executive Summary

  • 1.1 Market overview
    • Executive Summary - Chart on Market Overview
    • Executive Summary - Data Table on Market Overview
    • Executive Summary - Chart on Global Market Characteristics
    • Executive Summary - Chart on Market by Geography
    • Executive Summary - Chart on Market Segmentation by Technology
    • Executive Summary - Chart on Incremental Growth
    • Executive Summary - Data Table on Incremental Growth
    • Executive Summary - Chart on Company Market Positioning

2 Technavio Analysis

  • 2.1 Analysis of price sensitivity, lifecycle, customer purchase basket, adoption rates, and purchase criteria
    • Analysis of price sensitivity, lifecycle, customer purchase basket, adoption rates, and purchase criteria
  • 2.2 Criticality of inputs and Factors of differentiation
    • Overview on criticality of inputs and factors of differentiation
  • 2.3 Factors of disruption
    • Overview on factors of disruption
  • 2.4 Impact of drivers and challenges
    • Impact of drivers and challenges in 2023 and 2028

3 Market Landscape

  • 3.1 Market ecosystem
    • Parent Market
    • Data Table on - Parent Market
  • 3.2 Market characteristics
    • Market characteristics analysis
  • 3.3 Value chain analysis
    • Value Chain Analysis

4 Market Sizing

  • 4.1 Market definition
    • Offerings of companies included in the market definition
  • 4.2 Market segment analysis
    • Market segments
  • 4.3 Market size 2023
    • 4.4 Market outlook: Forecast for 2023-2028
      • Chart on Global - Market size and forecast 2023-2028 ($ million)
      • Data Table on Global - Market size and forecast 2023-2028 ($ million)
      • Chart on Global Market: Year-over-year growth 2023-2028 (%)
      • Data Table on Global Market: Year-over-year growth 2023-2028 (%)

    5 Historic Market Size

    • 5.1 Global Sequencing Reagents Market 2018 - 2022
      • Historic Market Size - Data Table on Global Sequencing Reagents Market 2018 - 2022 ($ million)
    • 5.2 Technology segment analysis 2018 - 2022
      • Historic Market Size - Technology Segment 2018 - 2022 ($ million)
    • 5.3 Geography segment analysis 2018 - 2022
      • Historic Market Size - Geography Segment 2018 - 2022 ($ million)
    • 5.4 Country segment analysis 2018 - 2022
      • Historic Market Size - Country Segment 2018 - 2022 ($ million)

    6 Qualitative Analysis

    • 6.1 Impact of AI on Global Sequencing Reagents Market

      7 Five Forces Analysis

      • 7.1 Five forces summary
        • Five forces analysis - Comparison between 2023 and 2028
      • 7.2 Bargaining power of buyers
        • Bargaining power of buyers - Impact of key factors 2023 and 2028
      • 7.3 Bargaining power of suppliers
        • Bargaining power of suppliers - Impact of key factors in 2023 and 2028
      • 7.4 Threat of new entrants
        • Threat of new entrants - Impact of key factors in 2023 and 2028
      • 7.5 Threat of substitutes
        • Threat of substitutes - Impact of key factors in 2023 and 2028
      • 7.6 Threat of rivalry
        • Threat of rivalry - Impact of key factors in 2023 and 2028
      • 7.7 Market condition
        • Chart on Market condition - Five forces 2023 and 2028

      8 Market Segmentation by Technology

      • 8.1 Market segments
        • Chart on Technology - Market share 2023-2028 (%)
        • Data Table on Technology - Market share 2023-2028 (%)
      • 8.2 Comparison by Technology
        • Chart on Comparison by Technology
        • Data Table on Comparison by Technology
      • 8.3 Next-generation sequencing - Market size and forecast 2023-2028
        • Chart on Next-generation sequencing - Market size and forecast 2023-2028 ($ million)
        • Data Table on Next-generation sequencing - Market size and forecast 2023-2028 ($ million)
        • Chart on Next-generation sequencing - Year-over-year growth 2023-2028 (%)
        • Data Table on Next-generation sequencing - Year-over-year growth 2023-2028 (%)
      • 8.4 Sanger sequencing - Market size and forecast 2023-2028
        • Chart on Sanger sequencing - Market size and forecast 2023-2028 ($ million)
        • Data Table on Sanger sequencing - Market size and forecast 2023-2028 ($ million)
        • Chart on Sanger sequencing - Year-over-year growth 2023-2028 (%)
        • Data Table on Sanger sequencing - Year-over-year growth 2023-2028 (%)
      • 8.5 Third generation sequencing - Market size and forecast 2023-2028
        • Chart on Third generation sequencing - Market size and forecast 2023-2028 ($ million)
        • Data Table on Third generation sequencing - Market size and forecast 2023-2028 ($ million)
        • Chart on Third generation sequencing - Year-over-year growth 2023-2028 (%)
        • Data Table on Third generation sequencing - Year-over-year growth 2023-2028 (%)
      • 8.6 Market opportunity by Technology
        • Market opportunity by Technology ($ million)
        • Data Table on Market opportunity by Technology ($ million)

      9 Customer Landscape

      • 9.1 Customer landscape overview
        • Analysis of price sensitivity, lifecycle, customer purchase basket, adoption rates, and purchase criteria

      10 Geographic Landscape

      • 10.1 Geographic segmentation
        • Chart on Market share by geography 2023-2028 (%)
        • Data Table on Market share by geography 2023-2028 (%)
      • 10.2 Geographic comparison
        • Chart on Geographic comparison
        • Data Table on Geographic comparison
      • 10.3 North America - Market size and forecast 2023-2028
        • Chart on North America - Market size and forecast 2023-2028 ($ million)
        • Data Table on North America - Market size and forecast 2023-2028 ($ million)
        • Chart on North America - Year-over-year growth 2023-2028 (%)
        • Data Table on North America - Year-over-year growth 2023-2028 (%)
      • 10.4 Europe - Market size and forecast 2023-2028
        • Chart on Europe - Market size and forecast 2023-2028 ($ million)
        • Data Table on Europe - Market size and forecast 2023-2028 ($ million)
        • Chart on Europe - Year-over-year growth 2023-2028 (%)
        • Data Table on Europe - Year-over-year growth 2023-2028 (%)
      • 10.5 Asia - Market size and forecast 2023-2028
        • Chart on Asia - Market size and forecast 2023-2028 ($ million)
        • Data Table on Asia - Market size and forecast 2023-2028 ($ million)
        • Chart on Asia - Year-over-year growth 2023-2028 (%)
        • Data Table on Asia - Year-over-year growth 2023-2028 (%)
      • 10.6 Rest of World (ROW) - Market size and forecast 2023-2028
        • Chart on Rest of World (ROW) - Market size and forecast 2023-2028 ($ million)
        • Data Table on Rest of World (ROW) - Market size and forecast 2023-2028 ($ million)
        • Chart on Rest of World (ROW) - Year-over-year growth 2023-2028 (%)
        • Data Table on Rest of World (ROW) - Year-over-year growth 2023-2028 (%)
      • 10.7 US - Market size and forecast 2023-2028
        • Chart on US - Market size and forecast 2023-2028 ($ million)
        • Data Table on US - Market size and forecast 2023-2028 ($ million)
        • Chart on US - Year-over-year growth 2023-2028 (%)
        • Data Table on US - Year-over-year growth 2023-2028 (%)
      • 10.8 Canada - Market size and forecast 2023-2028
        • Chart on Canada - Market size and forecast 2023-2028 ($ million)
        • Data Table on Canada - Market size and forecast 2023-2028 ($ million)
        • Chart on Canada - Year-over-year growth 2023-2028 (%)
        • Data Table on Canada - Year-over-year growth 2023-2028 (%)
      • 10.9 Germany - Market size and forecast 2023-2028
        • Chart on Germany - Market size and forecast 2023-2028 ($ million)
        • Data Table on Germany - Market size and forecast 2023-2028 ($ million)
        • Chart on Germany - Year-over-year growth 2023-2028 (%)
        • Data Table on Germany - Year-over-year growth 2023-2028 (%)
      • 10.10 UK - Market size and forecast 2023-2028
        • Chart on UK - Market size and forecast 2023-2028 ($ million)
        • Data Table on UK - Market size and forecast 2023-2028 ($ million)
        • Chart on UK - Year-over-year growth 2023-2028 (%)
        • Data Table on UK - Year-over-year growth 2023-2028 (%)
      • 10.11 China - Market size and forecast 2023-2028
        • Chart on China - Market size and forecast 2023-2028 ($ million)
        • Data Table on China - Market size and forecast 2023-2028 ($ million)
        • Chart on China - Year-over-year growth 2023-2028 (%)
        • Data Table on China - Year-over-year growth 2023-2028 (%)
      • 10.12 France - Market size and forecast 2023-2028
        • Chart on France - Market size and forecast 2023-2028 ($ million)
        • Data Table on France - Market size and forecast 2023-2028 ($ million)
        • Chart on France - Year-over-year growth 2023-2028 (%)
        • Data Table on France - Year-over-year growth 2023-2028 (%)
      • 10.13 Italy - Market size and forecast 2023-2028
        • Chart on Italy - Market size and forecast 2023-2028 ($ million)
        • Data Table on Italy - Market size and forecast 2023-2028 ($ million)
        • Chart on Italy - Year-over-year growth 2023-2028 (%)
        • Data Table on Italy - Year-over-year growth 2023-2028 (%)
      • 10.14 Japan - Market size and forecast 2023-2028
        • Chart on Japan - Market size and forecast 2023-2028 ($ million)
        • Data Table on Japan - Market size and forecast 2023-2028 ($ million)
        • Chart on Japan - Year-over-year growth 2023-2028 (%)
        • Data Table on Japan - Year-over-year growth 2023-2028 (%)
      • 10.15 India - Market size and forecast 2023-2028
        • Chart on India - Market size and forecast 2023-2028 ($ million)
        • Data Table on India - Market size and forecast 2023-2028 ($ million)
        • Chart on India - Year-over-year growth 2023-2028 (%)
        • Data Table on India - Year-over-year growth 2023-2028 (%)
      • 10.16 South Korea - Market size and forecast 2023-2028
        • Chart on South Korea - Market size and forecast 2023-2028 ($ million)
        • Data Table on South Korea - Market size and forecast 2023-2028 ($ million)
        • Chart on South Korea - Year-over-year growth 2023-2028 (%)
        • Data Table on South Korea - Year-over-year growth 2023-2028 (%)
      • 10.17 Market opportunity by geography
        • Market opportunity by geography ($ million)
        • Data Tables on Market opportunity by geography ($ million)

      11 Drivers, Challenges, and Opportunity/Restraints

      • 11.1 Market drivers
        • 11.2 Market challenges
          • 11.3 Impact of drivers and challenges
            • Impact of drivers and challenges in 2023 and 2028
          • 11.4 Market opportunities/restraints

            12 Competitive Landscape

            • 12.1 Overview
              • 12.2 Competitive Landscape
                • Overview on criticality of inputs and factors of differentiation
              • 12.3 Landscape disruption
                • Overview on factors of disruption
              • 12.4 Industry risks
                • Impact of key risks on business

              13 Competitive Analysis

              • 13.1 Companies profiled
                • Companies covered
              • 13.2 Company ranking index
                • Company ranking index
              • 13.3 Market positioning of companies
                • Matrix on companies position and classification
              • 13.4 Agilent Technologies Inc.
                • Agilent Technologies Inc. - Overview
                • Agilent Technologies Inc. - Business segments
                • Agilent Technologies Inc. - Key news
                • Agilent Technologies Inc. - Key offerings
                • Agilent Technologies Inc. - Segment focus
                • SWOT
              • 13.5 BGI Group
                • BGI Group - Overview
                • BGI Group - Product / Service
                • BGI Group - Key offerings
                • SWOT
              • 13.6 F. Hoffmann La Roche Ltd.
                • F. Hoffmann La Roche Ltd. - Overview
                • F. Hoffmann La Roche Ltd. - Business segments
                • F. Hoffmann La Roche Ltd. - Key news
                • F. Hoffmann La Roche Ltd. - Key offerings
                • F. Hoffmann La Roche Ltd. - Segment focus
                • SWOT
              • 13.7 Fluidigm Corp.
                • Fluidigm Corp. - Overview
                • Fluidigm Corp. - Product / Service
                • Fluidigm Corp. - Key offerings
                • SWOT
              • 13.8 Illumina Inc.
                • Illumina Inc. - Overview
                • Illumina Inc. - Business segments
                • Illumina Inc. - Key news
                • Illumina Inc. - Key offerings
                • Illumina Inc. - Segment focus
                • SWOT
              • 13.9 Oxford Nanopore Technologies plc
                • Oxford Nanopore Technologies plc - Overview
                • Oxford Nanopore Technologies plc - Product / Service
                • Oxford Nanopore Technologies plc - Key offerings
                • SWOT
              • 13.10 Pacific Biosciences of California Inc.
                • Pacific Biosciences of California Inc. - Overview
                • Pacific Biosciences of California Inc. - Product / Service
                • Pacific Biosciences of California Inc. - Key news
                • Pacific Biosciences of California Inc. - Key offerings
                • SWOT
              • 13.11 QIAGEN N.V.
                • QIAGEN N.V. - Overview
                • QIAGEN N.V. - Product / Service
                • QIAGEN N.V. - Key news
                • QIAGEN N.V. - Key offerings
                • SWOT
              • 13.12 Takara Bio Inc.
                • Takara Bio Inc. - Overview
                • Takara Bio Inc. - Product / Service
                • Takara Bio Inc. - Key news
                • Takara Bio Inc. - Key offerings
                • SWOT
              • 13.13 Thermo Fisher Scientific Inc.
                • Thermo Fisher Scientific Inc. - Overview
                • Thermo Fisher Scientific Inc. - Business segments
                • Thermo Fisher Scientific Inc. - Key news
                • Thermo Fisher Scientific Inc. - Key offerings
                • Thermo Fisher Scientific Inc. - Segment focus
                • SWOT

              14 Appendix

              • 14.1 Scope of the report
                • 14.2 Inclusions and exclusions checklist
                  • Inclusions checklist
                  • Exclusions checklist
                • 14.3 Currency conversion rates for US$
                  • Currency conversion rates for US$
                • 14.4 Research methodology
                  • Research methodology
                • 14.5 Data procurement
                  • Information sources
                • 14.6 Data validation
                  • Data validation
                • 14.7 Validation techniques employed for market sizing
                  • Validation techniques employed for market sizing
                • 14.8 Data synthesis
                  • Data synthesis
                • 14.9 360 degree market analysis
                  • 360 degree market analysis
                • 14.10 List of abbreviations
                  • List of abbreviations

                Research Methodology

                Technavio presents a detailed picture of the market by way of study, synthesis, and summation of data from multiple sources. The analysts have presented the various facets of the market with a particular focus on identifying the key industry influencers. The data thus presented is comprehensive, reliable, and the result of extensive research, both primary and secondary.

                INFORMATION SOURCES

                Primary sources

                • Manufacturers and suppliers
                • Channel partners
                • Industry experts
                • Strategic decision makers

                Secondary sources

                • Industry journals and periodicals
                • Government data
                • Financial reports of key industry players
                • Historical data
                • Press releases

                DATA ANALYSIS

                Data Synthesis

                • Collation of data
                • Estimation of key figures
                • Analysis of derived insights

                Data Validation

                • Triangulation with data models
                • Reference against proprietary databases
                • Corroboration with industry experts

                REPORT WRITING

                Qualitative

                • Market drivers
                • Market challenges
                • Market trends
                • Five forces analysis

                Quantitative

                • Market size and forecast
                • Market segmentation
                • Geographical insights
                • Competitive landscape

                Interested in this report?

                Get your sample now to see our research methodology and insights!

                Download Now

                Frequently Asked Questions

                Sequencing Reagents market growth will increase by $ 4106 mn during 2024-2028.

                The Sequencing Reagents market is expected to grow at a CAGR of 12.4% during 2024-2028.

                Sequencing Reagents market is segmented by Technology( Next-generation sequencing, Sanger sequencing, Third generation sequencing)

                Agilent Technologies Inc., BGI Group, BioChain Institute Inc., F. Hoffmann La Roche Ltd., Fluidigm Corp., FroggaBio Inc., Illumina Inc., LGC Biosearch Technologies, Merck KGaA, Meridian Bioscience Inc, New England Biolabs Inc., Oxford Nanopore Technologies plc, Pacific Biosciences of California Inc., Perkin Elmer Inc., QIAGEN N.V., Takara Bio Inc., Tecan Trading AG, Thermo Fisher Scientific Inc., Trilink Biotechnologies are a few of the key vendors in the Sequencing Reagents market.

                North America will register the highest growth rate of 39% among the other regions. Therefore, the Sequencing Reagents market in North America is expected to garner significant business opportunities for the vendors during the forecast period.

                US, Canada, Germany, UK, China, France, Italy, Japan, India, South Korea

                • Increasing affordability of DNA sequencingCost serves as a major factor in any market. The global sequencing reagents market has witnessed a significant drop in the costs of DNA sequencing in recent years due to numerous technological advances. For instance is the driving factor this market.
                • according to the National Human Genome Research Institute (NHGRI) of US is the driving factor this market.
                • the cost of sequencing one million bases of DNA declined from around $1 is the driving factor this market.
                • 000 in 2004 to approximately $0.01 in 2019. The NHGRI has gathered a lot of information on DNA sequencing costs for many years through the sequencing centers funded by the Institute. This analyzed and summarized information obtained by the NHGRI has enabled it to assess the improvements in DNA sequencing technologies. The sequencing costs in NHGRI-funded sequencing centers were determined based on two metrics is the driving factor this market.
                • namely is the driving factor this market.
                • the cost per mega base of DNA sequence and the cost per human genome. This has helped in lowering the sequencing costs as well as enabling better research due to the growing volume of sequencing data.Furthermore is the driving factor this market.
                • in the past is the driving factor this market.
                • the cost structure for sequencing reagents involved a lot of ambiguity as it was measured in terms of $/base is the driving factor this market.
                • which made it unclear if the cost included the different steps involved in sequencing or just the sequencing run. Thus is the driving factor this market.
                • as a solution to this problem is the driving factor this market.
                • a new all-inclusive approach was developed. This all-inclusive cost structure includes the cost of components is the driving factor this market.
                • direct costs is the driving factor this market.
                • and indirect costs associated with a sequencing project. This approach provides better insights into the cost structure of a sequencing project and aids end-users and funding agencies in improving their research plans. These factors are likely to make DNA sequencing more accessible and affordable to a much larger population is the driving factor this market.
                • which is the driving factor this market.
                • in turn is the driving factor this market.
                • is expected to drive the global sequencing reagents market during the forecast period. is the driving factor this market.

                The Sequencing Reagents market vendors should focus on grabbing business opportunities from the Next-generation sequencing segment as it accounted for the largest market share in the base year.