
US Shaker Bottles Market Size 2025-2029
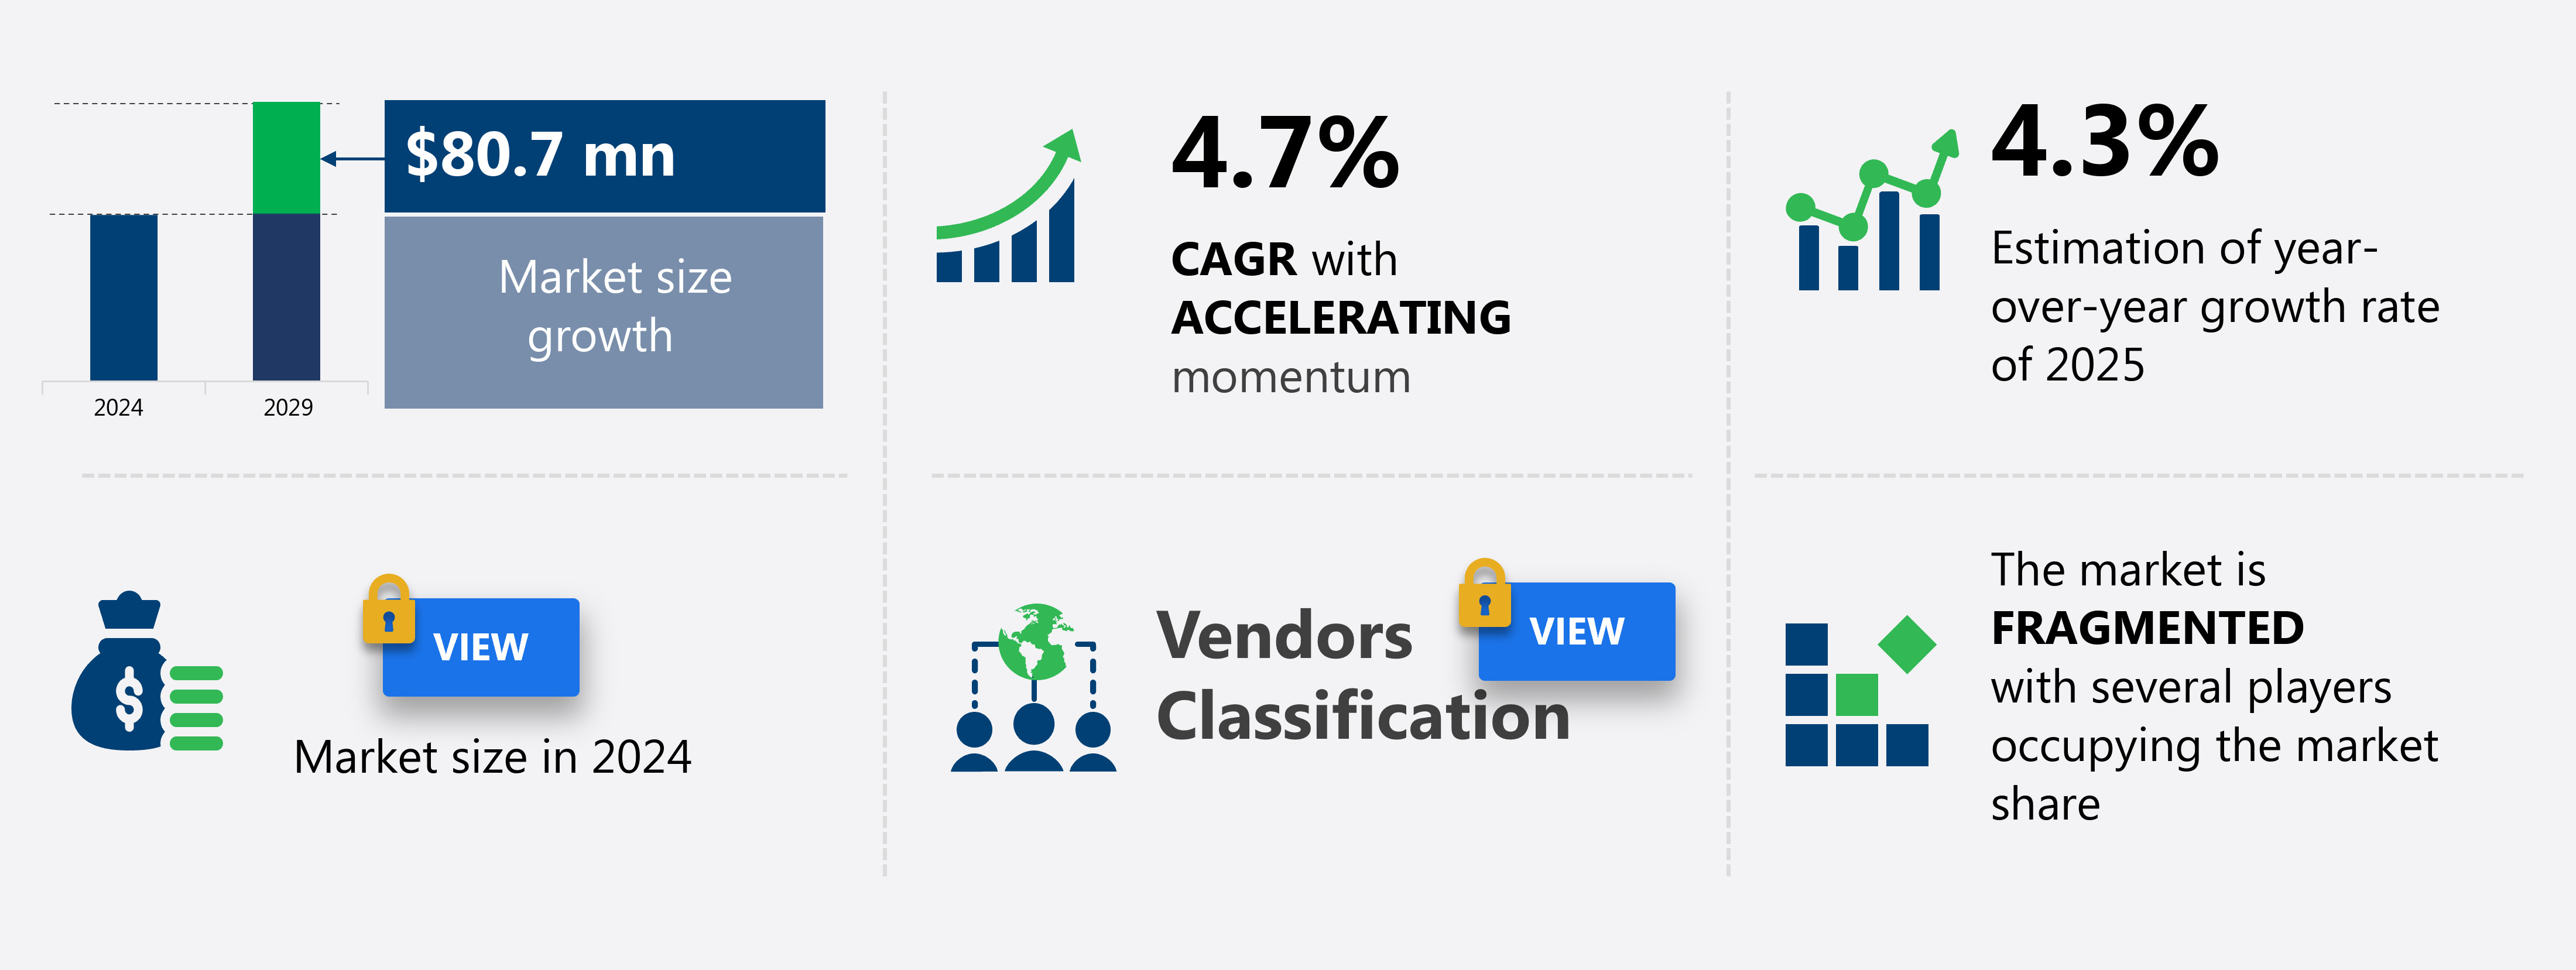
The US shaker bottles market size is forecast to increase by USD 80.7 million at a CAGR of 4.7% between 2024 and 2029.
- The demand has been on the rise due to the growth of the health and fitness sector. Consumers are increasingly turning to protein supplements and meal replacement shakes to support their active lifestyles and improve mental health. The popularity of recyclable plastic shaker bottles, particularly those made of polypropylene, polyethylene, and polyethylene terephthalate, has risen due to their lightweight, durable, and easy-to-clean features. However, the market is also facing challenges such as the volatility in prices of raw materials, including steel and stainless steel, which can impact the construction costs of shaker bottles.
- Additionally, the increasing trend towards digital content and e-commerce has led to the demand for bottles with added features like LED lights and insulation for juices, protein shakes in flavors like vanilla, chocolate, and blueberry, and meal replacement shakes. The use of high-density polyethylene and plastic containers for shaker bottles ensures better insulation and longer product shelf life. The market is expected to continue its growth trajectory, driven by these trends and challenges.
What will be the Size of the market During the Forecast Period?
- The market is experiencing significant growth due to the rising health consciousness and increasing popularity of protein supplements. With a focus on fitness, gym activities, and sports, consumers seek convenient solutions for mixing their nutritional drinks. Shaker bottles have gained traction as an essential sports equipment item, catering to various flavors such as chocolate, vanilla, pineapple, mango, strawberry, blueberry, and others. Customization is a key trend, with consumers desiring bottles that align with their self-image and brand preferences. Ecommerce and social media platforms have facilitated the market's expansion, enabling easy access to a wide range of shaker bottles.
- The market's size is substantial, with continuous growth driven by health awareness, sports management, and mental health. Plastic shaker bottles, with their efficient mixing mechanism, have become the go-to choice for blending ingredients and creating smooth, consistent liquid shakes. The market's direction is positive, reflecting the ongoing commitment to physical and mental wellbeing.
How is this market segmented and which is the largest segment?
The market research report provides comprehensive data (region-wise segment analysis), with forecasts and estimates in "USD million" for the period 2025-2029, as well as historical data from 2019-2023 for the following segments.
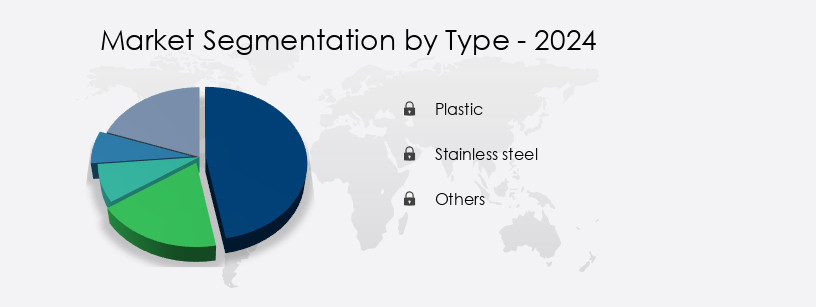
- Type
- Plastic
- Stainless steel
- Others
- Application
- Protein mixes
- Others
- Distribution Channel
- Offline
- Online
- End-user
- Men
- Women
- Geography
- US
By Type Insights
- The plastic segment is estimated to witness significant growth during the forecast period.
The market is primarily driven by the rising health consciousness among consumers and the increasing popularity of nutritional drinks, protein powders, and meal replacement shakes. Customized products catering to personal preferences and nutritional needs have gained significant traction, with offerings in various flavors such as butterscotch, chocolate, vanilla, pineapple, mango, strawberry, and blueberry. Plastic and stainless steel shaker bottles are popular choices due to their convenience and affordability. Companies produce these bottles using food-grade plastic and stainless steel for lids and mixing mechanisms to meet regulatory standards and consumer preferences.
BPA-free, recyclable, dishwasher-safe, and microwave-safe products are increasingly being offered to cater to eco-friendly consumer demands. Innovative designs with features like leakproof, insulation, Bluetooth connectivity, modular compartments, and measurement markings are expected to drive market growth during the forecast period. The market caters to gym goers, fitness enthusiasts, athletes, e-commerce brands, and consumers with chronic disorders. The market is accessible through both online shopping and offline retail channels, with prominent distribution channels including fitness centers, gyms, sports equipment stores, and tournaments. The market is expected to grow significantly due to the increasing awareness of fitness, gym, and sports activities, as well as the shift towards a healthier lifestyle and the rising demand for protein supplements.
Get a glance at the market report of share of various segments Request Free Sample
Market Dynamics
Our market researchers analyzed the data with 2024 as the base year, along with the key drivers, trends, and challenges. A holistic analysis of drivers will help companies refine their marketing strategies to gain a competitive advantage.
What are the key market drivers leading to the rise in adoption of US Shaker Bottles Market?
The growth of the health and fitness sector is the key driver of the market.
- The market is experiencing significant growth due to the increasing awareness and prioritization of physical fitness. With a large and health-conscious population, the demand for convenient mixing containers for nutritional drinks, such as protein powders in flavors like butterscotch, chocolate, vanilla, pineapple, mango, strawberry, and blueberry, is on the rise. This trend is driven by the growing number of gym goers, fitness enthusiasts, and athletes, who require customized products to meet their personal preferences and nutritional needs. The market offers various options in shaker bottles, including plastic and stainless steel designs, each with unique features such as wire whisk, blending balls, mixer grids, and measurement markings.
- Innovative designs cater to the convenience of consumers, offering leakproof, insulated, and even Bluetooth connectivity, modular compartments, and distribution channels through both online shopping and offline retailers. As chronic disorders and health issues become more prevalent, the demand for health supplements and meal replacement drinks is increasing. Eco-friendly materials and sustainable production methods are also gaining popularity among consumers, making the market increasingly diverse and competitive. In summary, the shaker bottles market In the US is fueled by the growing fitness industry, health consciousness, and the diverse needs of consumers. The market offers various options to cater to the preferences and nutritional needs of consumers, making it an exciting and dynamic space for e-commerce brands, fitness enthusiasts, and athletes alike.
What are the market trends shaping the US Shaker Bottles Market?
The growing popularity of recyclable plastic shaker bottles is the upcoming trend In the market.
- The market in the global health and nutrition industry is experiencing significant growth. Health consciousness is on the rise, leading to increased demand for convenient solutions to mix and consume nutritional drinks, such as protein powders in flavors like butterscotch, chocolate, vanilla, pineapple, mango, strawberry, and blueberry. Shaker bottles, with their mixing containers made of plastic or stainless steel, come equipped with features like wire whisks, blending balls, mixer grids, and measurement markings. These bottles cater to the needs of gym goers, fitness enthusiasts, athletes, e-commerce brands offering vegan protein powders and plant protein, and those requiring meal replacement drinks to accommodate personal preferences and nutritional needs.
- The convenience offered by shaker bottles, along with their ability to blend ingredients effectively for a smooth liquid shake, makes them a popular choice for those seeking to maintain a healthy lifestyle. Innovative designs, leakproof features, insulation, and even Bluetooth connectivity and modular compartments are enhancing the functionality and appeal of these bottles. The distribution channels for these products include both online shopping and offline retail stores, catering to a wide range of consumers. The growth of the shaker bottle market is driven by factors such as the rising prevalence of chronic disorders, the increasing popularity of fitness and sports activities, health awareness, and the expanding fitness and gym culture. The market also benefits from the increasing eco-friendly materials used In their production and the growing trend of home delivery services for lifestyle changes. With the increasing focus on physical and mental health, self-image, and digital access, shaker bottles are becoming essential tools for sports management and maintaining a healthy lifestyle.
What challenges does US Shaker Bottles Market face during the growth?
Volatility in the prices of raw materials is a key challenge affecting the market growth.
- Shaker bottles, popular for mixing nutritional drinks such as protein powders in customized flavors like butterscotch, chocolate, vanilla, pineapple, mango, strawberry, and blueberry, are in high demand among gym goers, fitness enthusiasts, and athletes. The market for these mixing containers is influenced by the rising health consciousness and increasing preference for convenient, eco-friendly, and innovative designs. Plastic and stainless steel shaker bottles with mixing mechanisms like wire whisk, blending ball, mixer grid, and measurement markings cater to various nutritional needs and personal preferences. The market dynamics are affected by the volatility In the price of crude oil, which impacts the cost of raw materials like polypropylene (PP), polyethylene (PE), polyester, and high-density polyethylene (HDPE) used in shaker bottle production.
- This uncertainty In the supply and demand of these materials makes it challenging for companies to estimate costs and plan production effectively during the forecast period. E-commerce brands, vegan protein powders, plant protein, meal replacement drinks, and health supplements are significant market drivers. The market caters to various chronic disorders and offers leakproof, insulation, Bluetooth connectivity, modular compartments, and distribution channels through both online shopping and offline retail stores. The market serves the fitness, gym, and sports activities communities, promoting health awareness, mental and physical health, self-image, and ecommerce, while also being accessible through social media and sports equipment sales at tournaments and the World Cup.
Exclusive Customer Landscape
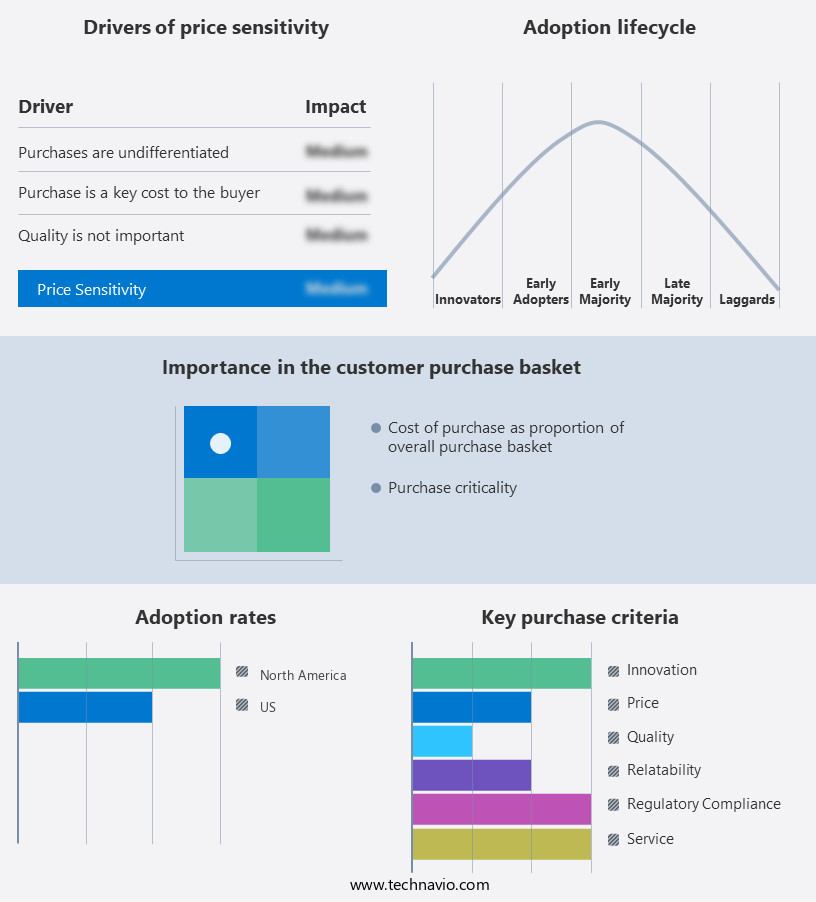
The market forecasting report includes the adoption lifecycle of the market, covering from the innovator's stage to the laggard's stage. It focuses on adoption rates in different regions based on penetration. Furthermore, the market report also includes key purchase criteria and drivers of price sensitivity to help companies evaluate and develop their market growth analysis strategies.
Customer Landscape
Key Companies & Market Insights
Companies are implementing various strategies, such as strategic alliances, market forecast, partnerships, mergers and acquisitions, geographical expansion, and product/service launches, to enhance their presence In the market.
Alpha Prime: The company offers shaker bottles namely Legacy Series sportshakers.
The market research and growth report includes detailed analyses of the competitive landscape of the market and information about key companies, including:
- Alpha Prime
- Amway Corp.
- Decathlon SA
- GNC Holdings LLC
- Go Shake
- HELIMIX
- Hydra Cup Inc.
- Newell Brands Inc.
- O2Cool LLC
- PERFORMA USA
- PROMiXX Ltd.
- SportShaker LLC
- Takeya USA Corp.
- Thermos LLC
- Trove Brands LLC
- Ultimate Nutrition Inc.
- Vista Outdoor Inc.
Qualitative and quantitative analysis of companies has been conducted to help clients understand the wider business environment as well as the strengths and weaknesses of key market players. Data is qualitatively analyzed to categorize companies as pure play, category-focused, industry-focused, and diversified; it is quantitatively analyzed to categorize companies as dominant, leading, strong, tentative, and weak.
Research Analyst Overview
The market caters to the growing demand for convenient and customized solutions for consumers seeking to meet their nutritional needs. These bottles, also known as mixing containers, have gained popularity among various demographics, including gym goers, fitness enthusiasts, athletes, and e-commerce brands. Health consciousness is a significant driver for the shaker bottle market. With the rise of nutritional drinks, protein powders, and meal replacement options, consumers require efficient and portable methods to mix and consume these products. Shaker bottles offer a practical solution, allowing users to blend ingredients and carry their beverages on-the-go. Customization is another essential factor fueling the growth of the shaker bottle market.
Moreover, consumers increasingly prefer personalized products that cater to their unique preferences and nutritional needs. Shaker bottles come in various sizes, materials, and designs, accommodating different requirements. For instance, some bottles are designed for vegan protein powders or plant-based options, while others cater to those with chronic disorders or specific dietary restrictions. The shaker bottle market encompasses a wide range of products, including those made of plastic and stainless steel. Some bottles feature a wire whisk, blending ball, or mixer grid to facilitate efficient mixing, while others come with measurement markings for precise dosage. Innovative designs continue to emerge, with some bottles offering leakproof features, insulation, Bluetooth connectivity, modular compartments, and even digital access for tracking nutritional intake.
Furthermore, the distribution channels for shaker bottles are diverse, with both online shopping and offline retail outlets catering to the demand. E-commerce brands have capitalized on the convenience and accessibility of online sales, while traditional brick-and-mortar stores continue to serve consumers who prefer a tactile shopping experience. The shaker bottle market is influenced by various trends, including the increasing popularity of fitness, gym, and sports activities. Health awareness and self-image are significant factors driving this trend, as individuals strive to maintain physical and mental health. Fitness management, sports equipment, and tournaments also contribute to the market's growth, as participants seek to optimize their performance and recovery.
|
Market Scope |
|
|
Report Coverage |
Details |
|
Page number |
174 |
|
Base year |
2024 |
|
Historic period |
2019-2023 |
|
Forecast period |
2025-2029 |
|
Growth momentum & CAGR |
Accelerate at a CAGR of 4.7% |
|
Market growth 2025-2029 |
USD 80.7 million |
|
Market structure |
Fragmented |
|
YoY growth 2024-2025(%) |
4.3 |
|
Key countries |
US |
|
Competitive landscape |
Leading Companies, Market Positioning of Companies, Competitive Strategies, and Industry Risks |
What are the Key Data Covered in this Market Research and Growth Report?
- CAGR of the market during the forecast period
- Detailed information on factors that will drive the market growth and forecasting between 2025 and 2029
- Precise estimation of the size of the market and its contribution of the market in focus to the parent market
- Accurate predictions about upcoming market growth and trends and changes in consumer behaviour
- Growth of the market across US
- Thorough analysis of the market's competitive landscape and detailed information about companies
- Comprehensive analysis of factors that will challenge the growth of market companies
We can help! Our analysts can customize this market research report to meet your requirements. Get in touch