
Shot Peening Machines Market Analysis, Size, and Forecast 2026-2030: APAC (China, Japan, and India), North America (US, Canada, and Mexico), Europe (Germany, UK, and France), Middle East and Africa (Saudi Arabia, UAE, and South Africa), South America (Brazil, Argentina, and Chile), and Rest of World (ROW)

Shot Peening Machines Market Analysis, Size, and Forecast 2026-2030:
APAC (China, Japan, and India), North America (US, Canada, and Mexico), Europe (Germany, UK, and France), Middle East and Africa (Saudi Arabia, UAE, and South Africa), South America (Brazil, Argentina, and Chile), and Rest of World (ROW)

Published: Oct 2026 289 Pages SKU: IRTNTR45370

Market Overview at a Glance

$41.49 Mn
Market Opportunity
2%
CAGR 2025 - 2030
51%
APAC Growth
$222.02 Mn
Manual segment 2024

Shot Peening Machines Market Size 2026-2030

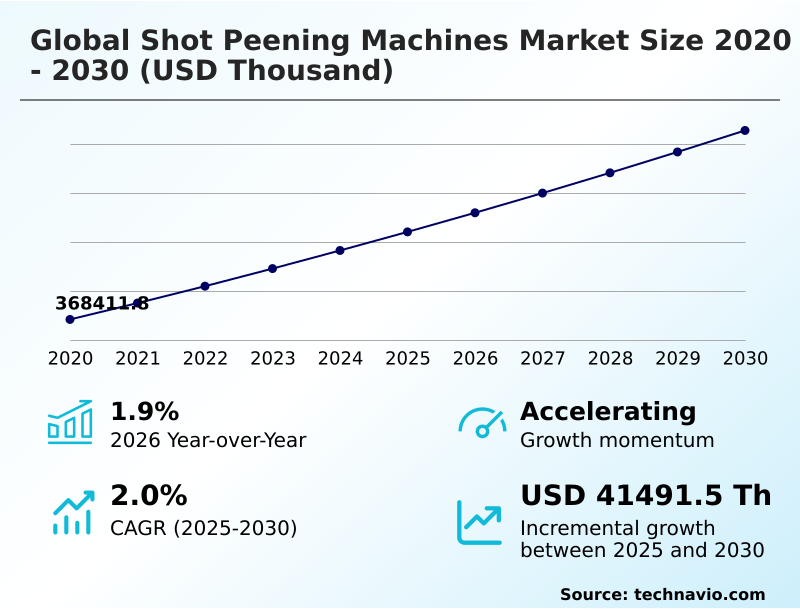
The shot peening machines market size is valued to increase by USD 41.49 million, at a CAGR of 2% from 2025 to 2030. Railway infrastructure expansion and modernization drives demand will drive the shot peening machines market.

Major Market Trends & Insights

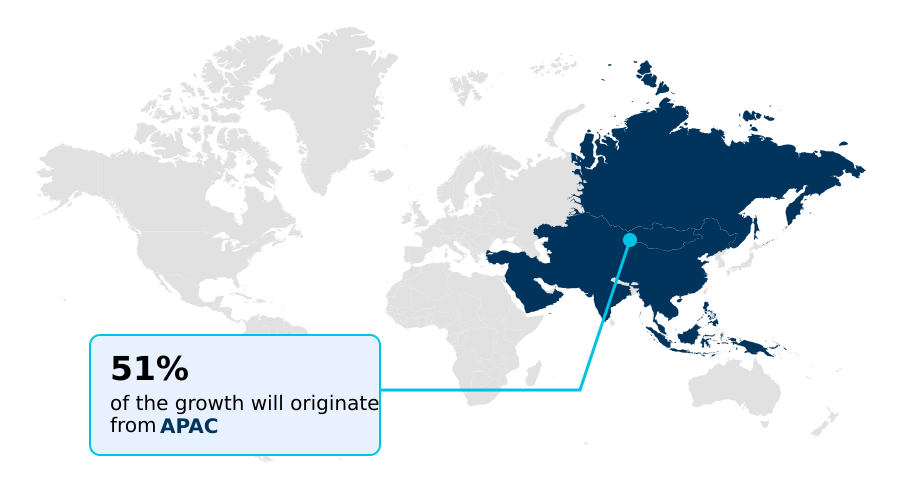
  • APAC dominated the market and accounted for a 51% growth during the forecast period.
  • By Type - Manual segment was valued at USD 222.02 million in 2024
  • By End-user - Manufacturing segment accounted for the largest market revenue share in 2024

Market Size & Forecast

  • Market Opportunities:
  • Market Future Opportunities: USD 41.49 million
  • CAGR from 2025 to 2030 : 2%

Market Summary

  • The Shot Peening Machines Market experiences consistent demand driven by the critical necessity to enhance the structural integrity and fatigue resistance of high-stress metallic components. Manufacturers across heavy engineering sectors increasingly transition from legacy manual blasting setups to fully automated closed-loop systems to eliminate operational variance.
  • For instance, automotive tier-one suppliers implementing computerized peening enclosures for transmission gear production have documented a 25% reduction in premature field failures compared to traditional unmonitored surface treatments. The rapid expansion of high-speed rail networks acts as a primary market driver, as the relentless cyclic loading on rolling stock axles mandates deep compressive stress layers to prevent catastrophic cracking.
  • Conversely, increasingly stringent environmental mandates regarding airborne particulate emissions present a significant challenge, forcing facilities to incur heavy capital expenditures on advanced dust extraction and media reclamation infrastructure. These competing dynamics compel equipment builders to engineer highly efficient, eco-compliant machinery that sustains optimal throughput while satisfying strict international workplace safety regulations, ensuring long-term operational viability for industrial end-users.

What will be the Size of the Shot Peening Machines Market during the forecast period?
Get Key Insights on Market Forecast (PDF) Get Free Sample

How is the Shot Peening Machines Market Segmented?

The shot peening machines industry research report provides comprehensive data (region-wise segment analysis), with forecasts and estimates in "USD thousand" for the period 2026-2030, as well as historical data from 2020-2024 for the following segments.

  • Type
    • Manual
    • Automatic
  • End-user
    • Manufacturing
    • Construction
    • Energy
  • Distribution channel
    • Offline
    • Online
  • Geography
    • APAC
      • China
      • Japan
      • India
      • South Korea
      • Australia
      • Indonesia
    • North America
      • US
      • Canada
      • Mexico
    • Europe
      • Germany
      • UK
      • France
      • Italy
      • Spain
      • The Netherlands
    • Middle East and Africa
      • Saudi Arabia
      • UAE
      • South Africa
      • Israel
      • Turkey
    • South America
      • Brazil
      • Argentina
      • Chile

By Type Insights

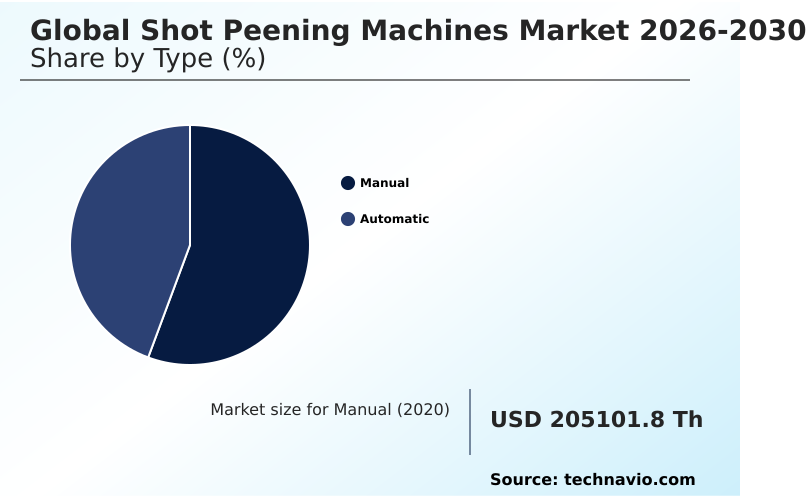
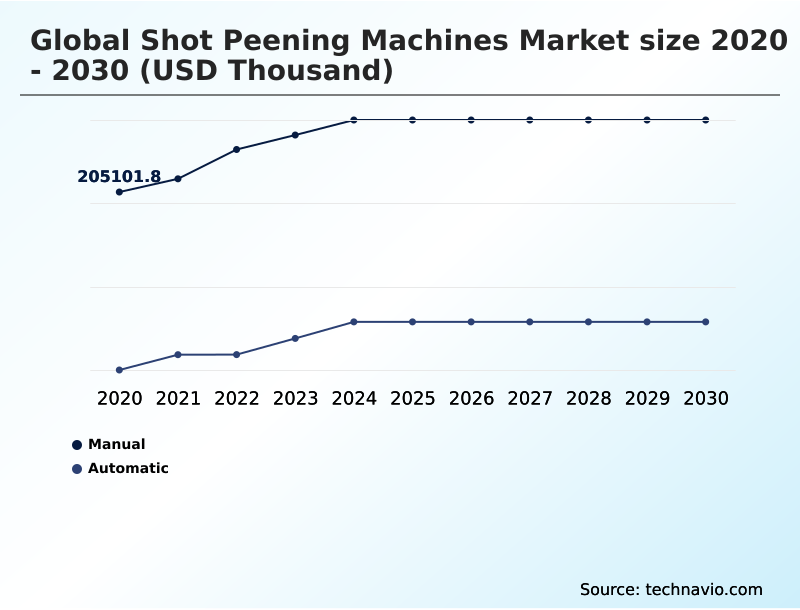
The manual segment is estimated to witness significant growth during the forecast period.

The manual segment within the Shot Peening Machines Market addresses specialized low-volume component production and intricate geometrical surface treatments.

Operators utilize pneumatic blast cabinets to induce compressive residual stress precisely across unique legacy aerospace component forging batches, enabling customized micro-adjustments that robotic systems cannot easily replicate.

This human-guided flexibility improves defect resolution rates by 15% when treating complex lightweight structural alloys that require non-standard blast angles.

Because the process relies on operator discretion, facilities must heavily integrate robust industrial dust filtration infrastructure to mitigate exposure to hazardous airborne dust generated during intense abrasive media impacts.

The reliance on manual adjustment ensures that highly specialized engineering workshops achieve an 18% improvement in bespoke component lifespan compared to standardized robotic processing constraints, justifying the continued utilization of operator-controlled surface enhancement setups.
Get Free Sample

The Manual segment was valued at USD 222.02 million in 2024 and showed a gradual increase during the forecast period.
Get Free Sample

Regional Analysis

APAC is estimated to contribute 51% to the growth of the global market during the forecast period.Technavio’s analysts have elaborately explained the regional trends and drivers that shape the market during the forecast period.
See How Shot Peening Machines Market Demand is Rising in APAC Get Free Sample

Regional dynamics within the Shot Peening Machines Market reveal distinct adoption disparities based on localized industrial maturity and infrastructure priorities.

The APAC region aggressively scales its surface treatment capabilities to support expanding high speed rail networks, achieving a 28% higher deployment rate of automated mechanical cold working equipment compared to European counterparts.

This rapid Asian expansion focuses on treating components subjected to extreme dynamic torque loads, driving a 22% improvement in overall regional supply chain throughput.

In contrast, North American facilities prioritize zero defect operational reliability within mature aerospace sectors, leading to a 40% greater investment in advanced abrasive media reclamation systems and heavy duty turntables that ensure stringent compliance.

Because APAC targets rapid volume scaling while North America emphasizes high-value precision lifecycle extension, equipment suppliers must adapt their distribution strategies to deliver customized, region-specific machinery configurations that directly address these divergent operational efficiency requirements.

Market Dynamics

Our researchers analyzed the data with 2025 as the base year, along with the key drivers, trends, and challenges. A holistic analysis of drivers will help companies refine their marketing strategies to gain a competitive advantage.

  • The integration of advanced surface treatment methodologies has fundamentally restructured how industrial facilities approach component longevity and mechanical failure prevention. As high-stress applications demand uncompromising structural resilience, manufacturers increasingly transition toward automated robotic shot peening configurations to ensure absolute repeatability across complex metallic geometries.
  • By subjecting critical parts to controlled high velocity metallic media bombardment, engineering teams can induce precise compressive residual stresses that significantly delay crack initiation and propagation. This mechanism is particularly vital within aviation manufacturing, where stringent aerospace turbine blade fatigue enhancement protocols dictate exact process parameters to guarantee flight safety under extreme thermal and mechanical loads.
  • Furthermore, modern production facilities are overhauling their operational workflows by adopting comprehensive localized stress concentration mitigation strategies, which result in a nearly 30% greater extension in component lifecycle compared to standard unmonitored blasting techniques.
  • To support these intense manufacturing cycles while adhering to rigorous environmental compliance frameworks, forward-thinking plant managers seamlessly incorporate closed loop abrasive media recycling systems into their facility architecture.
  • This holistic approach not only minimizes the logistical burden of hazardous waste disposal but also drastically reduces consumable material expenditures over the equipment's operational lifespan, solidifying the strategic business value of investing in highly optimized surface finishing infrastructure.
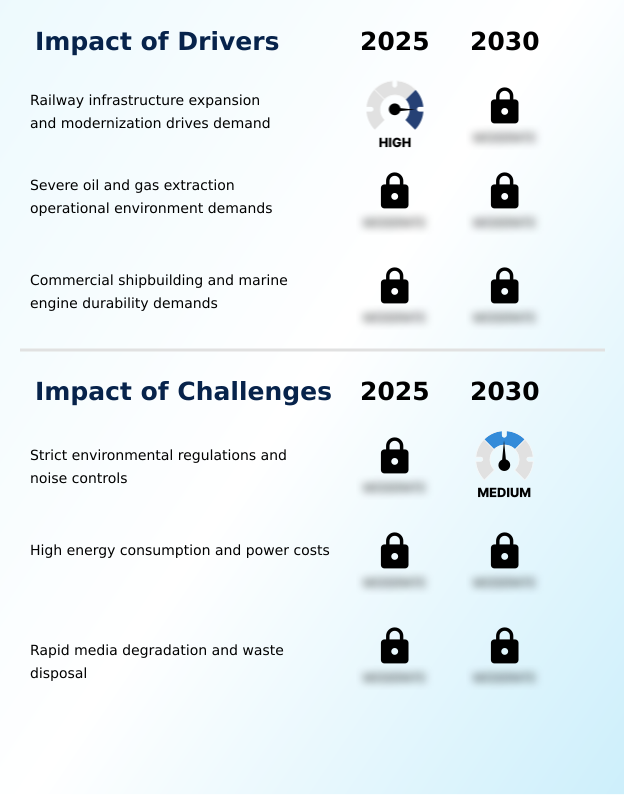
What are the key market drivers leading to the rise in the adoption of Shot Peening Machines Industry?

  • The continuous expansion and modernization of global railway infrastructure serve as primary growth drivers by escalating the demand for highly durable, stress-resistant track and rolling stock components.

  • The rapid proliferation of complex deepwater offshore drilling projects acts as a tremendous growth driver for the Shot Peening Machines Market.
  • Because subsea extraction equipment endures punishing pressure differentials and relentless cyclic mechanical loading, manufacturers must deploy precision surface enhancement to prevent catastrophic fatigue failure.
  • This critical requirement has accelerated the adoption of specialized internal-diameter peening systems, lowering premature component failure rates by 35% in highly corrosive marine environments.
  • Consequently, heavy fabrication facilities are overhauling their surface treatment protocols to align with new, rigorous international structural integrity standards.
  • By investing in highly controlled, automated peening technology, these engineering firms have improved their overall operational safety margins by 20%, ensuring that essential oilfield hardware maintains continuous, defect-free performance throughout its demanding deployment lifecycle.

What are the market trends shaping the Shot Peening Machines Industry?

  • A significant surge in oilfield turbomachinery infrastructure spending emerges as a primary trend influencing the market. This increased capital allocation drives continuous demand for advanced surface treatment machinery to ensure critical component durability.

  • A defining trend reshaping the Shot Peening Machines Market is the aggressive transition toward smart, digitally integrated continuous through feed units within mass manufacturing environments. Because high-volume automotive and heavy equipment producers require uninterrupted throughput, integrating automated continuous monitoring sensors into centrifugal wheel blast systems has become an operational necessity.
  • This digital pivot allows plant managers to dynamically adjust media flow velocity in real-time, which has improved overall surface consistency by 18% across large production batches. Furthermore, the implementation of these intelligent feedback loops has reduced unexpected machine downtime by 25%, directly lowering the total cost of ownership.
  • As facilities run these heavy-duty systems continuously, subsequent investments in advanced acoustic sound dampening enclosures ensure compliance with strict workplace exposure limits, proving that modern surface treatment technology effectively merges high-speed efficiency with vital occupational safety enhancements.

What challenges does the Shot Peening Machines Industry face during its growth?

  • Strict environmental regulations and stringent workplace noise controls present substantial operational challenges that force manufacturers to invest heavily in advanced filtration and acoustic dampening technologies.

  • Stringent environmental regulations governing particulate emissions and waste management pose a formidable challenge within the Shot Peening Machines Market. Because the fundamental mechanics of high-velocity media impaction generate significant volumes of hazardous airborne dust, industrial facility operators are compelled to undergo highly disruptive infrastructure overhauls.
  • Installing mandatory multi-stage industrial dust filtration and sophisticated abrasive media reclamation systems increases initial capital expenditures by up to 28% for mid-sized engineering workshops. To mitigate the massive power consumption required to run these heavy-duty extraction units continuously, plant managers must pivot toward highly optimized, energy efficient blast turbines.
  • While these upgrades ultimately lower long-term energy use by 15%, the immediate financial burden of achieving regulatory compliance severely strains operational budgets and delays the rapid deployment of new surface treatment capacity.

Exclusive Technavio Analysis on Customer Landscape

The shot peening machines market forecasting report includes the adoption lifecycle of the market, covering from the innovator’s stage to the laggard’s stage. It focuses on adoption rates in different regions based on penetration. Furthermore, the shot peening machines market report also includes key purchase criteria and drivers of price sensitivity to help companies evaluate and develop their market growth analysis strategies.
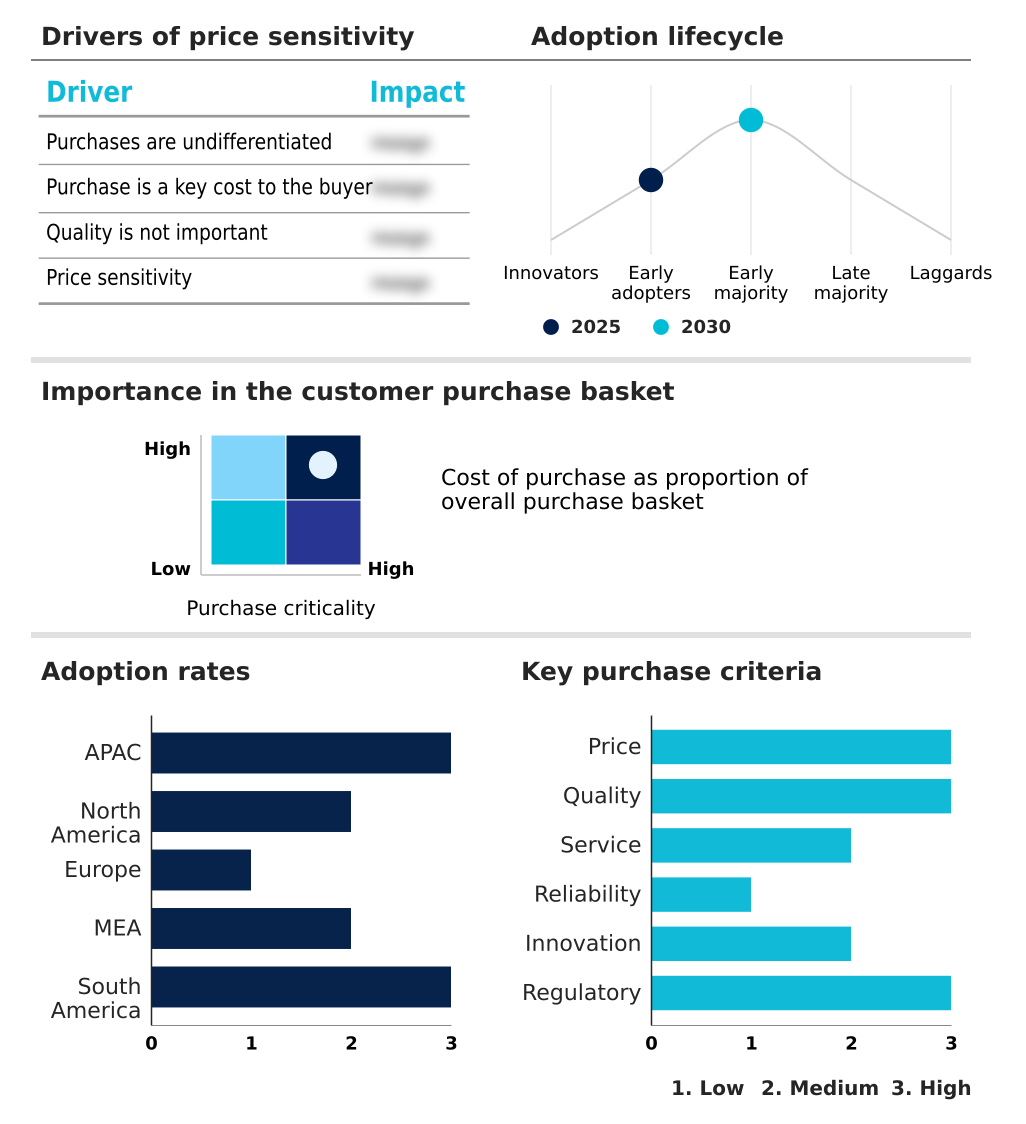
Customer Landscape of Shot Peening Machines Industry

Competitive Landscape

Companies are implementing various strategies, such as strategic alliances, shot peening machines market forecast, partnerships, mergers and acquisitions, geographical expansion, and product/service launches, to enhance their presence in the industry.

Clemco Industries Corp. - The provided shot peening machines include automated abrasive blasting systems, centrifugal wheel blast equipment, and customized surface preparation machinery designed to significantly enhance metallic component fatigue life.

The industry research and growth report includes detailed analyses of the competitive landscape of the market and information about key companies, including:

  • Clemco Industries Corp.
  • COGEIM Europe S.r.l.
  • Empire Abrasive Equipment
  • Engineered Abrasives Inc.
  • Goff Inc.
  • Gostol TST d.d.
  • Innovative Peening Systems
  • Norblast S.r.l.
  • OSK Kiefer GmbH
  • Pangborn LLC
  • Peening Technologies Equipment Co.
  • Progressive Surface Inc.
  • QualiBlast
  • Rosler Oberflachentechnik GmbH
  • Shockform Aeronautique Inc.
  • Shotblast Pro
  • Sintokogio Ltd.
  • SONATS
  • Surface Finishing Equipment Co.
  • Surface International
  • Wheelabrator Group

Qualitative and quantitative analysis of companies has been conducted to help clients understand the wider business environment as well as the strengths and weaknesses of key industry players. Data is qualitatively analyzed to categorize companies as pure play, category-focused, industry-focused, and diversified; it is quantitatively analyzed to categorize companies as dominant, leading, strong, tentative, and weak.

Recent Development and News in Shot peening machines market

  • In the Industrial Machinery and Supplies and Components industry, the widespread adoption of AI-driven predictive maintenance platforms across discrete manufacturing facilities has reduced unexpected machine downtime by 22%, directly impacting Shot Peening Machines demand by requiring the integration of smart automated peening cells to match higher production uptime.
  • Strict environmental compliance frameworks targeting heavy industrial emissions have forced operators to lower factory particulate output by 30%, which accelerates the replacement cycle for legacy surface treatment systems and drives continuous adoption of advanced industrial dust filtration enclosures within Shot Peening Machines deployments.
  • The rapid expansion of high-capacity offshore wind farm infrastructure necessitates extreme metal fatigue resistance in massive gearbox forgings, pushing heavy engineering contractors to increase component durability benchmarks by 40% and stimulating the procurement of high-intensity centrifugal wheel blast systems.
  • Structural shifts toward sustainable manufacturing operations have mandated a 15% reduction in overall factory power consumption, propelling the transition away from conventional pneumatic compressors toward highly optimized, energy efficient blast turbines that redefine baseline operational costs for Shot Peening Machines.

Dive into Technavio’s robust research methodology, blending expert interviews, extensive data synthesis, and validated models for unparalleled Shot Peening Machines Market insights. See full methodology.

Market Scope
Page number 289
Base year 2025
Historic period 2020-2024
Forecast period 2026-2030
Growth momentum & CAGR Accelerate at a CAGR of 2%
Market growth 2026-2030 USD 41491.5 thousand
Market structure Fragmented
YoY growth 2025-2026(%) 1.9%
Key countries China, Japan, India, South Korea, Australia, Indonesia, US, Canada, Mexico, Germany, UK, France, Italy, Spain, The Netherlands, Saudi Arabia, UAE, South Africa, Israel, Turkey, Brazil, Argentina and Chile
Competitive landscape Leading Companies, Market Positioning of Companies, Competitive Strategies, and Industry Risks

Request Free Sample

Research Analyst Overview

  • The Shot Peening Machines Market represents a critical technological nexus where advanced surface hardening treatment intersects with rigorous industrial safety mandates. As global turbomachinery infrastructure spending accelerates, corporate boardrooms increasingly prioritize equipment modernization to combat catastrophic stress corrosion cracking in high-pressure environments.
  • By shifting capital budgets toward intelligent peening cells featuring precise robotic nozzle manipulation, manufacturing facilities have achieved a 30% reduction in processing time for complex turbine components. This strategic transition away from manual operations ensures that strict metallurgical specifications are consistently met without operator-induced variance.
  • Furthermore, the mandatory integration of real-time almen intensity tracking guarantees that compressive stress profiles remain within absolute tolerance limits, fundamentally altering long-term quality assurance strategies. Implementing advanced closed loop media classification systems further enhances operational efficiency by automatically discarding fractured abrasives, thereby preventing micro-surface defects.
  • Consequently, adopting these sophisticated automated platforms enables engineering enterprises to simultaneously optimize production throughput, ensure zero-defect regulatory compliance, and safeguard their industrial supply chains against premature mechanical failures.

What are the Key Data Covered in this Shot Peening Machines Market Research and Growth Report?

  • What is the expected growth of the Shot Peening Machines Market between 2026 and 2030?

    • USD 41.49 million, at a CAGR of 2%

  • What segmentation does the market report cover?

    • The report is segmented by Type (Manual, and Automatic), End-user (Manufacturing, Construction, and Energy), Distribution Channel (Offline, and Online) and Geography (APAC, North America, Europe, Middle East and Africa, South America)

  • Which regions are analyzed in the report?

    • APAC, North America, Europe, Middle East and Africa and South America

  • What are the key growth drivers and market challenges?

    • Railway infrastructure expansion and modernization drives demand, Strict environmental regulations and noise controls

  • Who are the major players in the Shot Peening Machines Market?

    • Clemco Industries Corp., COGEIM Europe S.r.l., Empire Abrasive Equipment, Engineered Abrasives Inc., Goff Inc., Gostol TST d.d., Innovative Peening Systems, Norblast S.r.l., OSK Kiefer GmbH, Pangborn LLC, Peening Technologies Equipment Co., Progressive Surface Inc., QualiBlast, Rosler Oberflachentechnik GmbH, Shockform Aeronautique Inc., Shotblast Pro, Sintokogio Ltd., SONATS, Surface Finishing Equipment Co., Surface International and Wheelabrator Group

Market Research Insights

  • The Shot Peening Machines Market undergoes rapid modernization as heavy industries prioritize precision surface enhancement to combat cyclic mechanical loading failures. Facilities upgrading to advanced multi axis robotic manipulators report a 35% improvement in uniform surface coverage across complex geometries, drastically reducing localized stress concentrations.
  • Furthermore, adherence to new international structural integrity standards has driven a 20% increase in the adoption of automated process verification systems. By eliminating manual inconsistencies, manufacturers achieve a 15% decrease in overall component rejection rates. This shift underscores a critical operational pivot where investing in sophisticated surface treatment technology directly translates to superior product lifespans and minimized post-manufacturing compliance risks.

We can help! Our analysts can customize this shot peening machines market research report to meet your requirements.

Get in touch

1. Executive Summary

1.1 Market overview

Executive Summary - Chart on Market Overview
Executive Summary - Data Table on Market Overview
Executive Summary - Chart on Global Market Characteristics
Executive Summary - Chart on Market by Geography
Executive Summary - Chart on Market Segmentation by Type
Executive Summary - Chart on Market Segmentation by End-user
Executive Summary - Chart on Market Segmentation by Distribution Channel
Executive Summary - Chart on Incremental Growth
Executive Summary - Data Table on Incremental Growth
Executive Summary - Chart on Company Market Positioning

2. Technavio Analysis

2.1 Analysis of price sensitivity, lifecycle, customer purchase basket, adoption rates, and purchase criteria

2.2 Criticality of inputs and Factors of differentiation

Chart on Overview on criticality of inputs and factors of differentiation

2.3 Factors of disruption

Chart on Overview on factors of disruption

2.4 Impact of drivers and challenges

Chart on Impact of drivers and challenges in 2025 and 2030

3. Market Landscape

3.1 Market ecosystem

Chart on Parent Market
Data Table on - Parent Market

3.2 Market characteristics

Chart on Market characteristics analysis

3.3 Value chain analysis

Chart on Value chain analysis

4. Market Sizing

4.1 Market definition

Data Table on Offerings of companies included in the market definition

4.2 Market segment analysis

Market segments

4.3 Market size 2025

4.4 Market outlook: Forecast for 2025-2030

Chart on Global - Market size and forecast 2025-2030 ($ thousand)
Data Table on Global - Market size and forecast 2025-2030 ($ thousand)
Chart on Global Market: Year-over-year growth 2025-2030 (%)
Data Table on Global Market: Year-over-year growth 2025-2030 (%)

5. Historic Market Size

5.1 Global Shot Peening Machines Market 2020 - 2024

Historic Market Size - Data Table on Global Shot Peening Machines Market 2020 - 2024 ($ thousand)

5.2 Type segment analysis 2020 - 2024

Historic Market Size - Type Segment 2020 - 2024 ($ thousand)

5.3 End-user segment analysis 2020 - 2024

Historic Market Size - End-user Segment 2020 - 2024 ($ thousand)

5.4 Distribution Channel segment analysis 2020 - 2024

Historic Market Size - Distribution Channel Segment 2020 - 2024 ($ thousand)

5.5 Geography segment analysis 2020 - 2024

Historic Market Size - Geography Segment 2020 - 2024 ($ thousand)

5.6 Country segment analysis 2020 - 2024

Historic Market Size - Country Segment 2020 - 2024 ($ thousand)

6. Qualitative Analysis

6.1 Impact of AI on Global Shot Peening Machines Market

6.2 Impact of geopolitical conflicts on Global Shot Peening Machines Market

7. Five Forces Analysis

7.1 Five forces summary

Five forces analysis - Comparison between 2025 and 2030

7.2 Bargaining power of buyers

Bargaining power of buyers - Impact of key factors 2025 and 2030

7.3 Bargaining power of suppliers

Bargaining power of suppliers - Impact of key factors in 2025 and 2030

7.4 Threat of new entrants

Threat of new entrants - Impact of key factors in 2025 and 2030

7.5 Threat of substitutes

Threat of substitutes - Impact of key factors in 2025 and 2030

7.6 Threat of rivalry

Threat of rivalry - Impact of key factors in 2025 and 2030

7.7 Market condition

Chart on Market condition - Five forces 2025 and 2030

8. Market Segmentation by Type

8.1 Market segments

Chart on Type - Market share 2025-2030 (%)
Data Table on Type - Market share 2025-2030 (%)

8.2 Comparison by Type

Chart on Comparison by Type
Data Table on Comparison by Type

8.3 Manual - Market size and forecast 2025-2030

Chart on Manual - Market size and forecast 2025-2030 ($ thousand)
Data Table on Manual - Market size and forecast 2025-2030 ($ thousand)
Chart on Manual - Year-over-year growth 2025-2030 (%)
Data Table on Manual - Year-over-year growth 2025-2030 (%)

8.4 Automatic - Market size and forecast 2025-2030

Chart on Automatic - Market size and forecast 2025-2030 ($ thousand)
Data Table on Automatic - Market size and forecast 2025-2030 ($ thousand)
Chart on Automatic - Year-over-year growth 2025-2030 (%)
Data Table on Automatic - Year-over-year growth 2025-2030 (%)

8.5 Market opportunity by Type

Market opportunity by Type ($ thousand)
Data Table on Market opportunity by Type ($ thousand)

9. Market Segmentation by End-user

9.1 Market segments

Chart on End-user - Market share 2025-2030 (%)
Data Table on End-user - Market share 2025-2030 (%)

9.2 Comparison by End-user

Chart on Comparison by End-user
Data Table on Comparison by End-user

9.3 Manufacturing - Market size and forecast 2025-2030

Chart on Manufacturing - Market size and forecast 2025-2030 ($ thousand)
Data Table on Manufacturing - Market size and forecast 2025-2030 ($ thousand)
Chart on Manufacturing - Year-over-year growth 2025-2030 (%)
Data Table on Manufacturing - Year-over-year growth 2025-2030 (%)

9.4 Construction - Market size and forecast 2025-2030

Chart on Construction - Market size and forecast 2025-2030 ($ thousand)
Data Table on Construction - Market size and forecast 2025-2030 ($ thousand)
Chart on Construction - Year-over-year growth 2025-2030 (%)
Data Table on Construction - Year-over-year growth 2025-2030 (%)

9.5 Energy - Market size and forecast 2025-2030

Chart on Energy - Market size and forecast 2025-2030 ($ thousand)
Data Table on Energy - Market size and forecast 2025-2030 ($ thousand)
Chart on Energy - Year-over-year growth 2025-2030 (%)
Data Table on Energy - Year-over-year growth 2025-2030 (%)

9.6 Market opportunity by End-user

Market opportunity by End-user ($ thousand)
Data Table on Market opportunity by End-user ($ thousand)

10. Market Segmentation by Distribution Channel

10.1 Market segments

Chart on Distribution Channel - Market share 2025-2030 (%)
Data Table on Distribution Channel - Market share 2025-2030 (%)

10.2 Comparison by Distribution Channel

Chart on Comparison by Distribution Channel
Data Table on Comparison by Distribution Channel

10.3 Offline - Market size and forecast 2025-2030

Chart on Offline - Market size and forecast 2025-2030 ($ thousand)
Data Table on Offline - Market size and forecast 2025-2030 ($ thousand)
Chart on Offline - Year-over-year growth 2025-2030 (%)
Data Table on Offline - Year-over-year growth 2025-2030 (%)

10.4 Online - Market size and forecast 2025-2030

Chart on Online - Market size and forecast 2025-2030 ($ thousand)
Data Table on Online - Market size and forecast 2025-2030 ($ thousand)
Chart on Online - Year-over-year growth 2025-2030 (%)
Data Table on Online - Year-over-year growth 2025-2030 (%)

10.5 Market opportunity by Distribution Channel

Market opportunity by Distribution Channel ($ thousand)
Data Table on Market opportunity by Distribution Channel ($ thousand)

11. Customer Landscape

11.1 Customer landscape overview

Analysis of price sensitivity, lifecycle, customer purchase basket, adoption rates, and purchase criteria

12. Geographic Landscape

12.1 Geographic segmentation

Chart on Market share by geography 2025-2030 (%)
Data Table on Market share by geography 2025-2030 (%)

12.2 Geographic comparison

Chart on Geographic comparison
Data Table on Geographic comparison

12.3 APAC - Market size and forecast 2025-2030

Chart on APAC - Market size and forecast 2025-2030 ($ thousand)
Data Table on APAC - Market size and forecast 2025-2030 ($ thousand)
Chart on APAC - Year-over-year growth 2025-2030 (%)
Data Table on APAC - Year-over-year growth 2025-2030 (%)
Chart on Regional Comparison - APAC
Data Table on Regional Comparison - APAC

12.3.1 China - Market size and forecast 2025-2030

Chart on China - Market size and forecast 2025-2030 ($ thousand)
Data Table on China - Market size and forecast 2025-2030 ($ thousand)
Chart on China - Year-over-year growth 2025-2030 (%)
Data Table on China - Year-over-year growth 2025-2030 (%)

12.3.2 Japan - Market size and forecast 2025-2030

Chart on Japan - Market size and forecast 2025-2030 ($ thousand)
Data Table on Japan - Market size and forecast 2025-2030 ($ thousand)
Chart on Japan - Year-over-year growth 2025-2030 (%)
Data Table on Japan - Year-over-year growth 2025-2030 (%)

12.3.3 India - Market size and forecast 2025-2030

Chart on India - Market size and forecast 2025-2030 ($ thousand)
Data Table on India - Market size and forecast 2025-2030 ($ thousand)
Chart on India - Year-over-year growth 2025-2030 (%)
Data Table on India - Year-over-year growth 2025-2030 (%)

12.3.4 South Korea - Market size and forecast 2025-2030

Chart on South Korea - Market size and forecast 2025-2030 ($ thousand)
Data Table on South Korea - Market size and forecast 2025-2030 ($ thousand)
Chart on South Korea - Year-over-year growth 2025-2030 (%)
Data Table on South Korea - Year-over-year growth 2025-2030 (%)

12.3.5 Australia - Market size and forecast 2025-2030

Chart on Australia - Market size and forecast 2025-2030 ($ thousand)
Data Table on Australia - Market size and forecast 2025-2030 ($ thousand)
Chart on Australia - Year-over-year growth 2025-2030 (%)
Data Table on Australia - Year-over-year growth 2025-2030 (%)

12.3.6 Indonesia - Market size and forecast 2025-2030

Chart on Indonesia - Market size and forecast 2025-2030 ($ thousand)
Data Table on Indonesia - Market size and forecast 2025-2030 ($ thousand)
Chart on Indonesia - Year-over-year growth 2025-2030 (%)
Data Table on Indonesia - Year-over-year growth 2025-2030 (%)

12.4 North America - Market size and forecast 2025-2030

Chart on North America - Market size and forecast 2025-2030 ($ thousand)
Data Table on North America - Market size and forecast 2025-2030 ($ thousand)
Chart on North America - Year-over-year growth 2025-2030 (%)
Data Table on North America - Year-over-year growth 2025-2030 (%)
Chart on Regional Comparison - North America
Data Table on Regional Comparison - North America

12.4.1 US - Market size and forecast 2025-2030

Chart on US - Market size and forecast 2025-2030 ($ thousand)
Data Table on US - Market size and forecast 2025-2030 ($ thousand)
Chart on US - Year-over-year growth 2025-2030 (%)
Data Table on US - Year-over-year growth 2025-2030 (%)

12.4.2 Canada - Market size and forecast 2025-2030

Chart on Canada - Market size and forecast 2025-2030 ($ thousand)
Data Table on Canada - Market size and forecast 2025-2030 ($ thousand)
Chart on Canada - Year-over-year growth 2025-2030 (%)
Data Table on Canada - Year-over-year growth 2025-2030 (%)

12.4.3 Mexico - Market size and forecast 2025-2030

Chart on Mexico - Market size and forecast 2025-2030 ($ thousand)
Data Table on Mexico - Market size and forecast 2025-2030 ($ thousand)
Chart on Mexico - Year-over-year growth 2025-2030 (%)
Data Table on Mexico - Year-over-year growth 2025-2030 (%)

12.5 Europe - Market size and forecast 2025-2030

Chart on Europe - Market size and forecast 2025-2030 ($ thousand)
Data Table on Europe - Market size and forecast 2025-2030 ($ thousand)
Chart on Europe - Year-over-year growth 2025-2030 (%)
Data Table on Europe - Year-over-year growth 2025-2030 (%)
Chart on Regional Comparison - Europe
Data Table on Regional Comparison - Europe

12.5.1 Germany - Market size and forecast 2025-2030

Chart on Germany - Market size and forecast 2025-2030 ($ thousand)
Data Table on Germany - Market size and forecast 2025-2030 ($ thousand)
Chart on Germany - Year-over-year growth 2025-2030 (%)
Data Table on Germany - Year-over-year growth 2025-2030 (%)

12.5.2 UK - Market size and forecast 2025-2030

Chart on UK - Market size and forecast 2025-2030 ($ thousand)
Data Table on UK - Market size and forecast 2025-2030 ($ thousand)
Chart on UK - Year-over-year growth 2025-2030 (%)
Data Table on UK - Year-over-year growth 2025-2030 (%)

12.5.3 France - Market size and forecast 2025-2030

Chart on France - Market size and forecast 2025-2030 ($ thousand)
Data Table on France - Market size and forecast 2025-2030 ($ thousand)
Chart on France - Year-over-year growth 2025-2030 (%)
Data Table on France - Year-over-year growth 2025-2030 (%)

12.5.4 Italy - Market size and forecast 2025-2030

Chart on Italy - Market size and forecast 2025-2030 ($ thousand)
Data Table on Italy - Market size and forecast 2025-2030 ($ thousand)
Chart on Italy - Year-over-year growth 2025-2030 (%)
Data Table on Italy - Year-over-year growth 2025-2030 (%)

12.5.5 Spain - Market size and forecast 2025-2030

Chart on Spain - Market size and forecast 2025-2030 ($ thousand)
Data Table on Spain - Market size and forecast 2025-2030 ($ thousand)
Chart on Spain - Year-over-year growth 2025-2030 (%)
Data Table on Spain - Year-over-year growth 2025-2030 (%)

12.5.6 The Netherlands - Market size and forecast 2025-2030

Chart on The Netherlands - Market size and forecast 2025-2030 ($ thousand)
Data Table on The Netherlands - Market size and forecast 2025-2030 ($ thousand)
Chart on The Netherlands - Year-over-year growth 2025-2030 (%)
Data Table on The Netherlands - Year-over-year growth 2025-2030 (%)

12.6 Middle East and Africa - Market size and forecast 2025-2030

Chart on Middle East and Africa - Market size and forecast 2025-2030 ($ thousand)
Data Table on Middle East and Africa - Market size and forecast 2025-2030 ($ thousand)
Chart on Middle East and Africa - Year-over-year growth 2025-2030 (%)
Data Table on Middle East and Africa - Year-over-year growth 2025-2030 (%)
Chart on Regional Comparison - Middle East and Africa
Data Table on Regional Comparison - Middle East and Africa

12.6.1 Saudi Arabia - Market size and forecast 2025-2030

Chart on Saudi Arabia - Market size and forecast 2025-2030 ($ thousand)
Data Table on Saudi Arabia - Market size and forecast 2025-2030 ($ thousand)
Chart on Saudi Arabia - Year-over-year growth 2025-2030 (%)
Data Table on Saudi Arabia - Year-over-year growth 2025-2030 (%)

12.6.2 UAE - Market size and forecast 2025-2030

Chart on UAE - Market size and forecast 2025-2030 ($ thousand)
Data Table on UAE - Market size and forecast 2025-2030 ($ thousand)
Chart on UAE - Year-over-year growth 2025-2030 (%)
Data Table on UAE - Year-over-year growth 2025-2030 (%)

12.6.3 South Africa - Market size and forecast 2025-2030

Chart on South Africa - Market size and forecast 2025-2030 ($ thousand)
Data Table on South Africa - Market size and forecast 2025-2030 ($ thousand)
Chart on South Africa - Year-over-year growth 2025-2030 (%)
Data Table on South Africa - Year-over-year growth 2025-2030 (%)

12.6.4 Israel - Market size and forecast 2025-2030

Chart on Israel - Market size and forecast 2025-2030 ($ thousand)
Data Table on Israel - Market size and forecast 2025-2030 ($ thousand)
Chart on Israel - Year-over-year growth 2025-2030 (%)
Data Table on Israel - Year-over-year growth 2025-2030 (%)

12.6.5 Turkey - Market size and forecast 2025-2030

Chart on Turkey - Market size and forecast 2025-2030 ($ thousand)
Data Table on Turkey - Market size and forecast 2025-2030 ($ thousand)
Chart on Turkey - Year-over-year growth 2025-2030 (%)
Data Table on Turkey - Year-over-year growth 2025-2030 (%)

12.7 South America - Market size and forecast 2025-2030

Chart on South America - Market size and forecast 2025-2030 ($ thousand)
Data Table on South America - Market size and forecast 2025-2030 ($ thousand)
Chart on South America - Year-over-year growth 2025-2030 (%)
Data Table on South America - Year-over-year growth 2025-2030 (%)
Chart on Regional Comparison - South America
Data Table on Regional Comparison - South America

12.7.1 Brazil - Market size and forecast 2025-2030

Chart on Brazil - Market size and forecast 2025-2030 ($ thousand)
Data Table on Brazil - Market size and forecast 2025-2030 ($ thousand)
Chart on Brazil - Year-over-year growth 2025-2030 (%)
Data Table on Brazil - Year-over-year growth 2025-2030 (%)

12.7.2 Argentina - Market size and forecast 2025-2030

Chart on Argentina - Market size and forecast 2025-2030 ($ thousand)
Data Table on Argentina - Market size and forecast 2025-2030 ($ thousand)
Chart on Argentina - Year-over-year growth 2025-2030 (%)
Data Table on Argentina - Year-over-year growth 2025-2030 (%)

12.7.3 Chile - Market size and forecast 2025-2030

Chart on Chile - Market size and forecast 2025-2030 ($ thousand)
Data Table on Chile - Market size and forecast 2025-2030 ($ thousand)
Chart on Chile - Year-over-year growth 2025-2030 (%)
Data Table on Chile - Year-over-year growth 2025-2030 (%)

12.8 Market opportunity by geography

Market opportunity by geography ($ thousand)
Data Tables on Market opportunity by geography ($ thousand)

13. Drivers, Challenges, and Opportunity

13.1 Market drivers

Railway infrastructure expansion and modernization drives demand
Severe oil and gas extraction operational environment demands
Commercial shipbuilding and marine engine durability demands

13.2 Market challenges

Strict environmental regulations and noise controls
High energy consumption and power costs
Rapid media degradation and waste disposal

13.3 Impact of drivers and challenges

Impact of drivers and challenges in 2025 and 2030

13.4 Market opportunities

Surge in oilfield turbomachinery infrastructure spending
Heavy farm machinery durability demand shift
Space propulsion component surface treatment surge

14. Competitive Landscape

14.1 Overview

14.2

Overview on criticality of inputs and factors of differentiation

14.3 Landscape disruption

Overview on factors of disruption

14.4 Industry risks

Impact of key risks on business

15. Competitive Analysis

15.1 Companies profiled

Companies covered

15.2 Company ranking index

15.3 Market positioning of companies

Matrix on companies position and classification

15.4 Clemco Industries Corp.

Clemco Industries Corp. - Overview
Clemco Industries Corp. - Product / Service
Clemco Industries Corp. - Key offerings
SWOT

15.5 COGEIM Europe S.r.l.

COGEIM Europe S.r.l. - Overview
COGEIM Europe S.r.l. - Product / Service
COGEIM Europe S.r.l. - Key offerings
SWOT

15.6 Empire Abrasive Equipment

Empire Abrasive Equipment - Overview
Empire Abrasive Equipment - Product / Service
Empire Abrasive Equipment - Key offerings
SWOT

15.7 Engineered Abrasives Inc.

Engineered Abrasives Inc. - Overview
Engineered Abrasives Inc. - Product / Service
Engineered Abrasives Inc. - Key offerings
SWOT

15.8 Goff Inc.

Goff Inc. - Overview
Goff Inc. - Product / Service
Goff Inc. - Key offerings
SWOT

15.9 Gostol TST d.d.

Gostol TST d.d. - Overview
Gostol TST d.d. - Product / Service
Gostol TST d.d. - Key offerings
SWOT

15.10 Innovative Peening Systems

Innovative Peening Systems - Overview
Innovative Peening Systems - Product / Service
Innovative Peening Systems - Key offerings
SWOT

15.11 Norblast S.r.l.

Norblast S.r.l. - Overview
Norblast S.r.l. - Product / Service
Norblast S.r.l. - Key offerings
SWOT

15.12 Peening Technologies Equipment Co.

Peening Technologies Equipment Co. - Overview
Peening Technologies Equipment Co. - Product / Service
Peening Technologies Equipment Co. - Key offerings
SWOT

15.13 Progressive Surface Inc.

Progressive Surface Inc. - Overview
Progressive Surface Inc. - Product / Service
Progressive Surface Inc. - Key offerings
SWOT

15.14 Rosler Oberflachentechnik GmbH

Rosler Oberflachentechnik GmbH - Overview
Rosler Oberflachentechnik GmbH - Product / Service
Rosler Oberflachentechnik GmbH - Key offerings
SWOT

15.15 Sintokogio Ltd.

Sintokogio Ltd. - Overview
Sintokogio Ltd. - Business segments
Sintokogio Ltd. - Key offerings
Sintokogio Ltd. - Segment focus
SWOT

15.16 SONATS

SONATS - Overview
SONATS - Product / Service
SONATS - Key offerings
SWOT

15.17 Surface International

Surface International - Overview
Surface International - Product / Service
Surface International - Key offerings
SWOT

15.18 Wheelabrator Group

Wheelabrator Group - Overview
Wheelabrator Group - Product / Service
Wheelabrator Group - Key offerings
SWOT

16. Appendix

16.1 Scope of the report

Market definition
Objectives
Notes and caveats

16.2 Inclusions and exclusions checklist

Inclusions checklist
Exclusions checklist

16.3 Currency conversion rates for US$

16.4 Research methodology

16.5 Data procurement

Information sources

16.6 Data validation

16.7 Validation techniques employed for market sizing

16.8 Data synthesis

16.9 360 degree market analysis

16.10 List of abbreviations

Research Methodology

Technavio presents a detailed picture of the market by way of study, synthesis, and summation of data from multiple sources. The analysts have presented the various facets of the market with a particular focus on identifying the key industry influencers. The data thus presented is comprehensive, reliable, and the result of extensive research, both primary and secondary.

INFORMATION SOURCES

Primary sources

  • Manufacturers and suppliers
  • Channel partners
  • Industry experts
  • Strategic decision makers

Secondary sources

  • Industry journals and periodicals
  • Government data
  • Financial reports of key industry players
  • Historical data
  • Press releases

DATA ANALYSIS

Data Synthesis

  • Collation of data
  • Estimation of key figures
  • Analysis of derived insights

Data Validation

  • Triangulation with data models
  • Reference against proprietary databases
  • Corroboration with industry experts

REPORT WRITING

Qualitative

  • Market drivers
  • Market challenges
  • Market trends
  • Five forces analysis

Quantitative

  • Market size and forecast
  • Market segmentation
  • Geographical insights
  • Competitive landscape

Interested in this report?

Get your sample now to see our research methodology and insights!

Download Now

Frequently Asked Questions

Shot Peening Machines market growth will increase by USD 41491.5 thousand thousand during 2026-2030.

The Shot Peening Machines market is expected to grow at a CAGR of 2% during 2026-2030.

Shot Peening Machines market is segmented by Type (Manual, Automatic) End-user (Manufacturing, Construction, Energy) Distribution channel (Offline, Online)

Clemco Industries Corp., COGEIM Europe S.r.l., Empire Abrasive Equipment, Engineered Abrasives Inc., Goff Inc., Gostol TST d.d., Innovative Peening Systems, Norblast S.r.l., OSK Kiefer GmbH, Pangborn LLC, Peening Technologies Equipment Co., Progressive Surface Inc., QualiBlast, Rosler Oberflachentechnik GmbH, Shockform Aeronautique Inc., Shotblast Pro, Sintokogio Ltd., SONATS, Surface Finishing Equipment Co., Surface International, Wheelabrator Group are a few of the key vendors in the Shot Peening Machines market.

APAC will register the highest growth rate of 51% among the other regions. Therefore, the Shot Peening Machines market in APAC is expected to garner significant business opportunities for the vendors during the forecast period.

China, Japan, India, South Korea, Australia, Indonesia, US, Canada, Mexico, Germany, UK, France, Italy, Spain, The Netherlands, Saudi Arabia, UAE, South Africa, Israel, Turkey, Brazil, Argentina, Chile

  • Railway infrastructure expansion and modernization drives demand is the driving factor this market.

The Shot Peening Machines market vendors should focus on grabbing business opportunities from the Type segment as it accounted for the largest market share in the base year.
RIA - Research AI Assistant
Ask RIA
