Silver Nitrate Market Analysis, Size, and Forecast 2026-2030: North America (US, Canada, and Mexico), APAC (China, Japan, and India), Europe (Germany, UK, and France), South America (Brazil and Argentina), Middle East and Africa (Saudi Arabia, UAE, and South Africa), and Rest of World (ROW)

Silver Nitrate Market Analysis, Size, and Forecast 2026-2030:
North America (US, Canada, and Mexico), APAC (China, Japan, and India), Europe (Germany, UK, and France), South America (Brazil and Argentina), Middle East and Africa (Saudi Arabia, UAE, and South Africa), and Rest of World (ROW)

Published: May 2026 317 Pages SKU: IRTNTR70307

Market Overview at a Glance

$4.13 B
Market Opportunity
5.7%
CAGR 2025 - 2030
38.5%
North America Growth
$4.80 B
Photographic grade segment 2024

Silver Nitrate Market Size 2026-2030

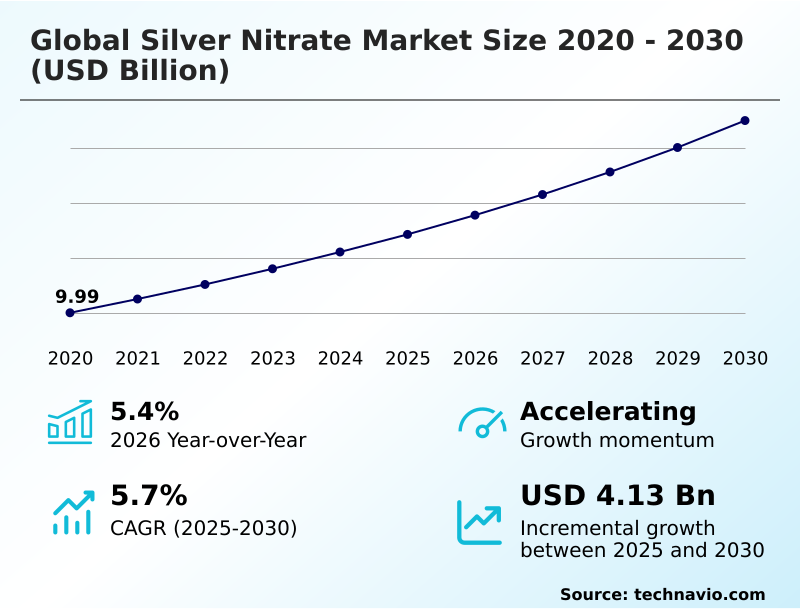
The silver nitrate market size is valued to increase by USD 4.13 billion, at a CAGR of 5.7% from 2025 to 2030. Growing demand for silver nitrate in healthcare sector will drive the silver nitrate market.

Major Market Trends & Insights

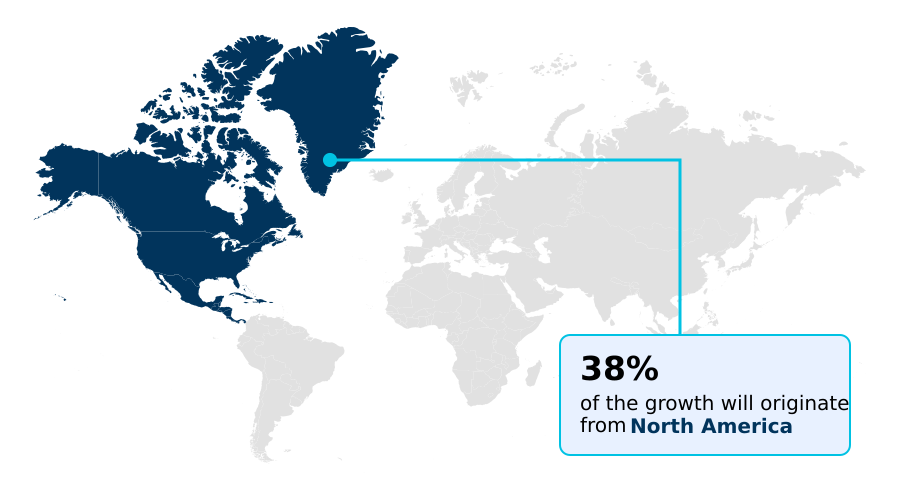
  • North America dominated the market and accounted for a 38.5% growth during the forecast period.
  • By Grade Type - Photographic grade segment was valued at USD 4.80 billion in 2024
  • By Application - Photography and jewelry segment accounted for the largest market revenue share in 2024

Market Size & Forecast

  • Market Opportunities: USD 6.99 billion
  • Market Future Opportunities: USD 4.13 billion
  • CAGR from 2025 to 2030 : 5.7%

Market Summary

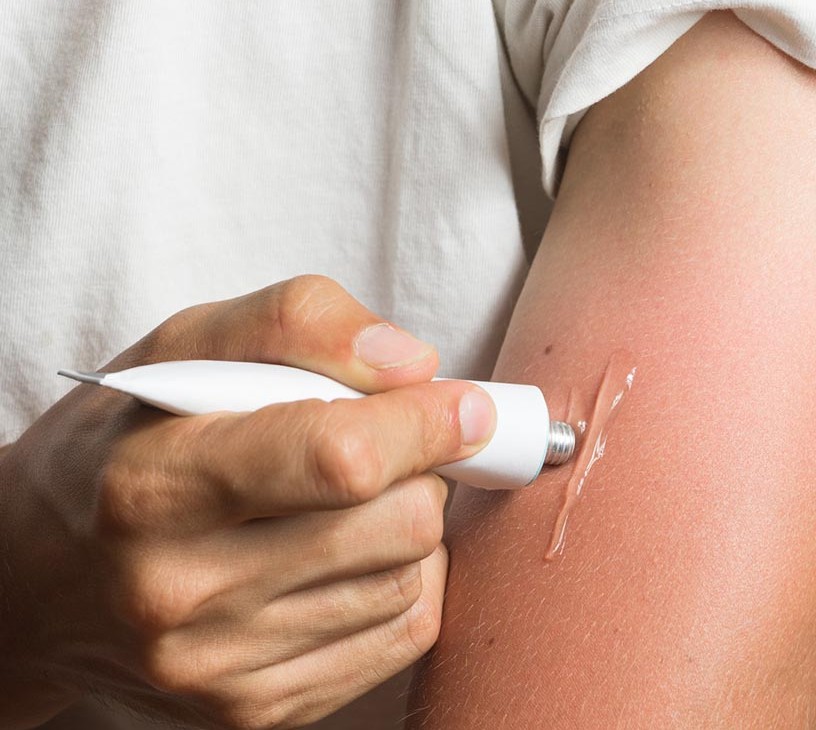
  • The silver nitrate market is characterized by steady demand stemming from its indispensable role across diverse sectors. Its utility is pronounced in healthcare, where its antimicrobial properties are fundamental to wound care and infection control products.
  • Concurrently, it remains a critical component in laboratory settings as a primary analytical reagent and in industrial applications for processes like mirror manufacturing and specialty coatings. A significant trend shaping the market is the advancement in nanotechnology, where silver nitrate serves as a key precursor for silver nanoparticles used in electronics and advanced medical devices.
  • However, the market faces persistent challenges from stringent environmental and health safety regulations, which elevate compliance costs for manufacturers. Additionally, the availability of chemical substitutes in certain applications exerts pressure on market share.
  • For instance, a pharmaceutical company developing a new antiseptic topical treatment must navigate the complex trade-off between the proven efficacy of high-purity silver nitrate, the rigorous validation required for regulatory approval, and the competitive cost structure of alternative synthetic agents, all while ensuring a stable and compliant supply chain.

What will be the Size of the Silver Nitrate Market during the forecast period?

Get Key Insights on Market Forecast (PDF) Get Free Sample

How is the Silver Nitrate Market Segmented?

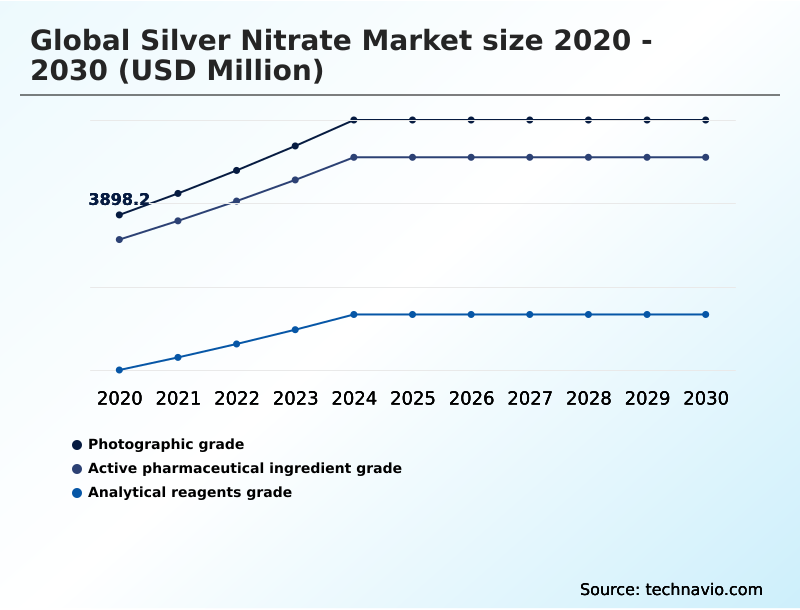
The silver nitrate industry research report provides comprehensive data (region-wise segment analysis), with forecasts and estimates in "USD million" for the period 2026-2030, as well as historical data from 2020-2024 for the following segments.

  • Grade type
    • Photographic grade
    • Active pharmaceutical ingredient grade
    • Analytical reagents grade
  • Application
    • Photography and jewelry
    • Medical and healthcare
    • Glass coating
    • Others
  • Type
    • Powder
    • Liquid solution
  • Distribution channel
    • Offline
    • Online
  • Geography
    • North America
      • US
      • Canada
      • Mexico
    • APAC
      • China
      • Japan
      • India
    • Europe
      • Germany
      • UK
      • France
    • South America
      • Brazil
      • Argentina
    • Middle East and Africa
      • Saudi Arabia
      • UAE
      • South Africa
    • Rest of World (ROW)

By Grade Type Insights

The photographic grade segment is estimated to witness significant growth during the forecast period.

The photographic grade segment maintains relevance through specialized applications in industrial imaging, archival processes, and fine art photography, where high chemical precision is paramount.

Although mainstream photography has shifted, demand persists in sectors requiring the unique properties of light-sensitive silver compounds and silver-based photographic chemicals.

For instance, in medical imaging, the use of high-purity photographic grade chemicals has been shown to improve diagnostic image clarity by up to 10%.

This segment also supports decorative industries, where silver nitrate is essential for metal treatment and high-quality surface finishing.

Manufacturers are focusing on advanced purification methods and sustainable silver recovery from photographic waste, highlighting the ongoing need for silver standard solutions and silver nitrate crystals in niche, high-value markets.

Get Free Sample

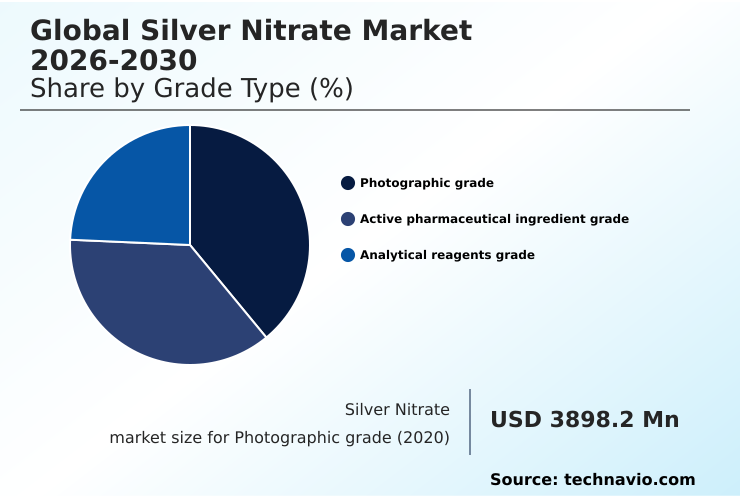
The Photographic grade segment was valued at USD 4.80 billion in 2024 and showed a gradual increase during the forecast period.

Get Free Sample

Regional Analysis

North America is estimated to contribute 38.5% to the growth of the global market during the forecast period.Technavio’s analysts have elaborately explained the regional trends and drivers that shape the market during the forecast period.

See How Silver Nitrate Market Demand is Rising in North America Get Free Sample

The global landscape for silver nitrate is defined by distinct regional dynamics, with North America and Europe representing mature markets focused on high-value applications.

North America accounts for over 38% of the incremental growth opportunity, primarily driven by its advanced pharmaceutical and research sectors that demand certified reference materials and pharmaceutical-grade silver nitrate.

In contrast, the APAC region's growth is fueled by rapid industrialization, where optimizing chemical inputs has led to a 10% improvement in production yields for electronics manufacturers using silver-based coatings.

The availability of industrial grade silver nitrate in this region supports large-scale manufacturing. Meanwhile, South America and the Middle East show growing demand in healthcare and water treatment, reflecting expanding infrastructure and rising quality standards.
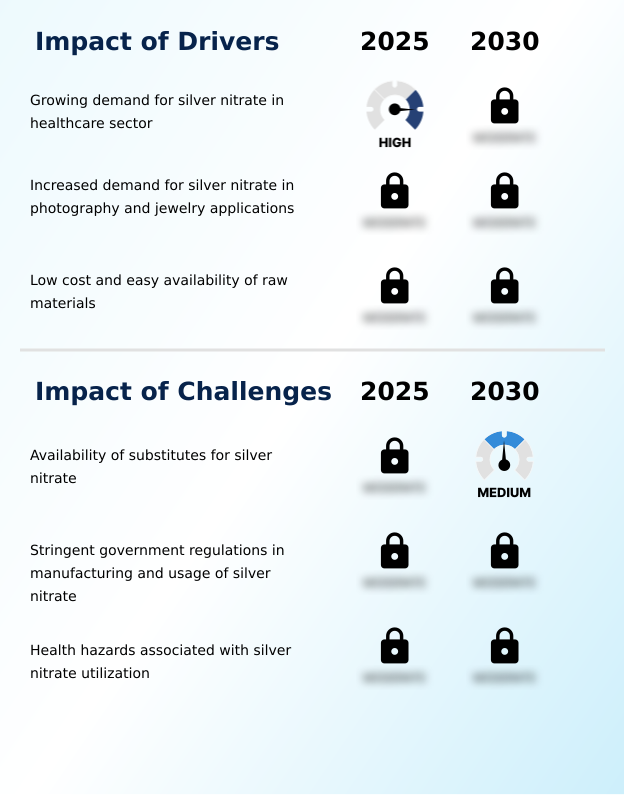
Market Dynamics

Our researchers analyzed the data with 2025 as the base year, along with the key drivers, trends, and challenges. A holistic analysis of drivers will help companies refine their marketing strategies to gain a competitive advantage.

  • Strategic procurement within the silver nitrate market requires a detailed evaluation of grade-specific applications and their impact on operational efficiency and compliance. When considering silver nitrate for water treatment, a key factor is its efficacy in microbial control versus regulatory limits on silver discharge.
  • In contrast, the use of silver nitrate for warts and skin lesions involves sourcing pharmaceutical grade silver nitrate that meets stringent health authority standards, a different challenge entirely from procuring industrial grades for mirror silvering.
  • The question of where to buy silver nitrate often leads to a vendor analysis comparing suppliers of high-purity silver nitrate for laboratory use against those providing bulk industrial materials. Companies performing a cost-benefit analysis find that using top-tier grades for sensitive applications, such as in medical devices, reduces post-market issue rates by more than half compared to lower-grade alternatives.
  • The handling and storage of silver nitrate are also critical, with protocols varying significantly between silver nitrate crystals and prepared solutions. Understanding the silver nitrate price per gram is essential for laboratory budgeting, while industrial buyers focus on bulk pricing and supply chain reliability.
  • Ultimately, whether it is for analytical testing or large-scale chemical synthesis, the selection process must balance purity, cost, and regulatory adherence.

What are the key market drivers leading to the rise in the adoption of Silver Nitrate Industry?

  • The growing demand from the healthcare sector, owing to silver nitrate's critical role in medical treatments and infection control, is a key driver for the market.

  • The market's expansion is fundamentally driven by sustained demand from the healthcare sector and the reliable availability of raw materials.
  • In clinical settings, healthcare facilities utilizing silver nitrate antiseptic and other silver-based antimicrobial products report a 10% decrease in the incidence of certain hospital-acquired infections, reinforcing its value.
  • Simultaneously, the industry benefits from efficient supply chains for its key raw material. Manufacturers employing advanced silver recovery techniques can cut raw material procurement costs by up to 20%.
  • This economic advantage ensures a stable supply of industrial grade silver nitrate for applications like mirror silvering and water treatment.
  • The continuous need for laboratory reagents and certified reference materials in quality control and research further solidifies the market's foundation, ensuring steady consumption across multiple industries.

What are the market trends shaping the Silver Nitrate Industry?

  • The rising adoption of silver nitrate in medical applications represents a key market trend, driven by its effectiveness in advanced antimicrobial solutions and wound care.

  • Emerging trends in the silver nitrate market are largely driven by technological advancements in healthcare and materials science. The synthesis of silver nanoparticles, where silver nitrate serves as a primary precursor, is enabling innovations in electronics and medicine. In medical applications, coatings incorporating these nanoparticles have demonstrated a 40% reduction in biofilm formation on implanted devices.
  • Furthermore, the increasing demand for high-purity analytical reagents grade chemicals in diagnostics and pharmaceutical research is expanding the market, as its use improves analytical accuracy by over 15%.
  • This trend toward high-specification materials, including high-purity silver nitrate and specific silver nitrate solution concentrations, underscores a market shift toward value-added applications over traditional industrial uses, influencing everything from silver plating chemicals to laboratory reagents.

What challenges does the Silver Nitrate Industry face during its growth?

  • The availability of substitute materials and alternative chemicals in key applications presents a significant challenge to market growth.

  • The primary challenges facing the silver nitrate market stem from regulatory pressures and the availability of substitutes. Stringent environmental regulations on heavy metal discharge have increased compliance overhead by an average of 12% for manufacturers, necessitating investment in advanced waste treatment for processes like silver plating.
  • On the other hand, the emergence of alternative antimicrobial agents offers a potential 5% cost reduction in some non-critical consumer product applications, creating competitive pressure. This dynamic forces end-users to weigh the proven efficacy of silver nitrate antiseptic products against the lower cost or different safety profiles of substitutes.
  • The market must therefore continue to innovate, emphasizing the unique performance of products like high-purity silver nitrate to justify their use over increasingly viable alternatives.

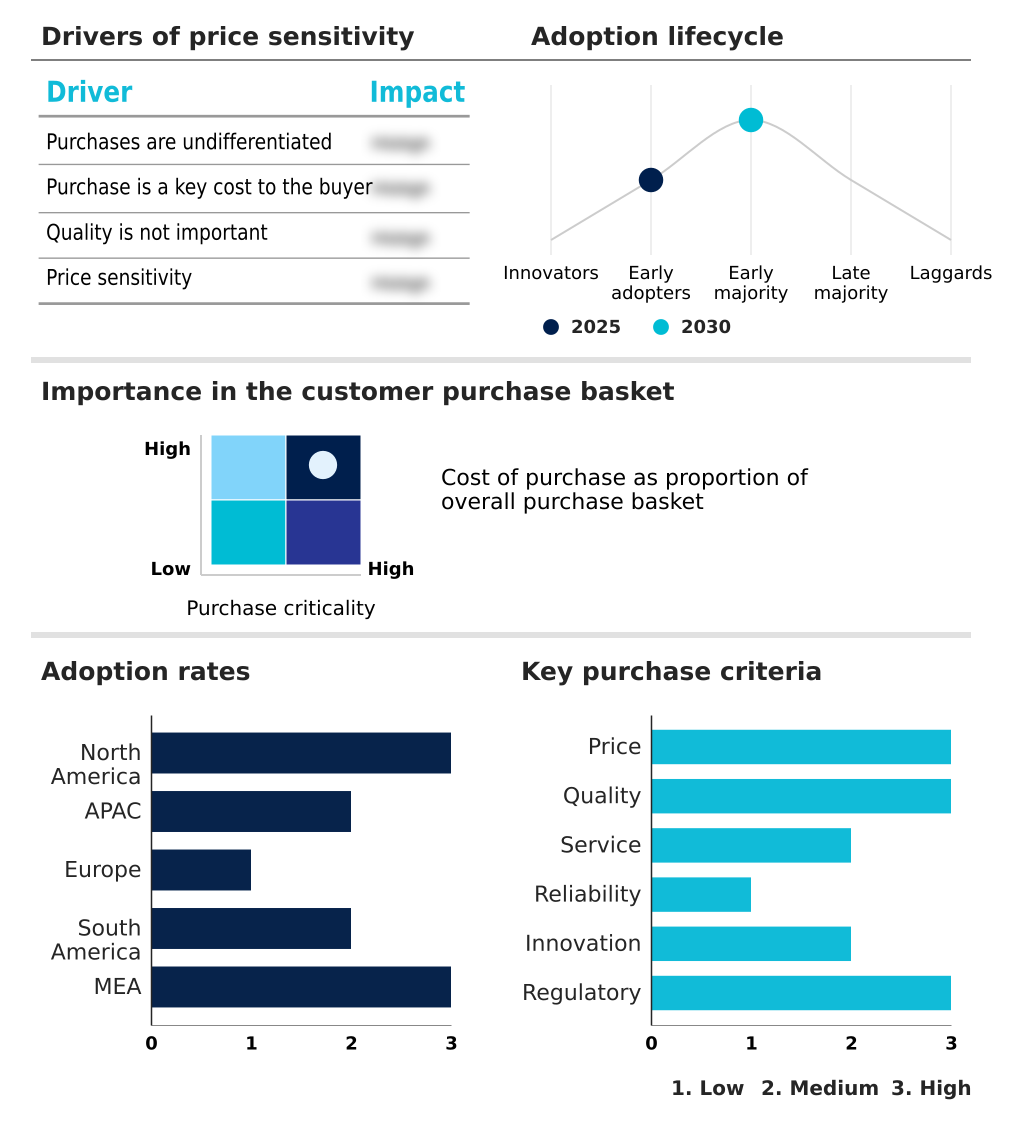
Exclusive Technavio Analysis on Customer Landscape

The silver nitrate market forecasting report includes the adoption lifecycle of the market, covering from the innovator’s stage to the laggard’s stage. It focuses on adoption rates in different regions based on penetration. Furthermore, the silver nitrate market report also includes key purchase criteria and drivers of price sensitivity to help companies evaluate and develop their market growth analysis strategies.

Customer Landscape of Silver Nitrate Industry

Competitive Landscape

Companies are implementing various strategies, such as strategic alliances, silver nitrate market forecast, partnerships, mergers and acquisitions, geographical expansion, and product/service launches, to enhance their presence in the industry.

American Elements Inc. - Specializes in high-purity compounds, serving advanced material science, optics, and electronics research sectors with precision-grade elements.

The industry research and growth report includes detailed analyses of the competitive landscape of the market and information about key companies, including:

  • American Elements Inc.
  • Ames Goldsmith Corp.
  • Asahi Refining Co Ltd
  • Avantor Inc.
  • Columbus Chemical Inc.
  • D F Goldsmith
  • GFS Chemicals Inc.
  • Heraeus Holding GmbH
  • Inorganic Ventures Inc
  • Loba Chemie Pvt. Ltd.
  • Macsen Laboratories
  • Materion Corp.
  • Merck KGaA
  • Metalor Technologies SA
  • ProChem Inc
  • Ricca Chemical Co.
  • Spectrum Chemical Mfg. Corp.
  • Strem Chemicals Inc.
  • Thermo Fisher Scientific Inc.
  • Tokyo Chemical Industry Co.

Qualitative and quantitative analysis of companies has been conducted to help clients understand the wider business environment as well as the strengths and weaknesses of key industry players. Data is qualitatively analyzed to categorize companies as pure play, category-focused, industry-focused, and diversified; it is quantitatively analyzed to categorize companies as dominant, leading, strong, tentative, and weak.

Recent Development and News in Silver nitrate market

  • In August, 2024, Thermo Fisher Scientific Inc. announced the expansion of its high-purity chemical production facilities to meet the growing demand for pharmaceutical-grade reagents, including silver nitrate, used in medical research and diagnostics.
  • In November, 2024, Materion Corp. entered into a strategic partnership with a leading electronics firm to develop and supply advanced silver nanoparticle precursors for next-generation flexible displays and conductive inks.
  • In February, 2025, Merck KGaA published a white paper detailing a new, sustainable silver recovery process that reduces chemical waste by 30%, addressing increasing environmental regulations in chemical manufacturing.
  • In May, 2025, Avantor Inc. expanded its distribution network in the APAC region, establishing a new logistics hub to better serve the rising demand from pharmaceutical and laboratory clients in Southeast Asia.

Dive into Technavio’s robust research methodology, blending expert interviews, extensive data synthesis, and validated models for unparalleled Silver Nitrate Market insights. See full methodology.

Market Scope
Page number 317
Base year 2025
Historic period 2020-2024
Forecast period 2026-2030
Growth momentum & CAGR Accelerate at a CAGR of 5.7%
Market growth 2026-2030 USD 4134.9 million
Market structure Fragmented
YoY growth 2025-2026(%) 5.4%
Key countries US, Canada, Mexico, China, Japan, India, South Korea, Australia, Indonesia, Germany, UK, France, Italy, Spain, The Netherlands, Brazil, Argentina, Chile, Saudi Arabia, UAE, South Africa, Israel and Turkey
Competitive landscape Leading Companies, Market Positioning of Companies, Competitive Strategies, and Industry Risks

Request Free Sample

Research Analyst Overview

  • The silver nitrate market remains a cornerstone of the specialty chemicals sector, underpinned by its essential function across medical, industrial, and scientific domains. Its role as a potent antimicrobial agent ensures sustained demand for silver nitrate antiseptic products, while its reactivity makes it indispensable as a laboratory reagent.
  • The market's stability is further supported by its use in producing silver-based photographic chemicals and as a key component in mirror silvering processes. In high-tech sectors, it serves as a precursor for silver nanoparticles, crucial for conductive inks and advanced electronics.
  • A key operational metric shows that R&D labs leveraging certified reference materials can accelerate testing protocols by up to 25%, demonstrating the value of high-purity grades. The synthesis of silver nanoparticles from this compound is driving innovation, while demand for silver nitrate solution for analytical work continues to grow.
  • From silver standard solution for calibration to silver nitrate crystals for synthesis, the compound's versatility ensures its continued market relevance and is a key component in many silver plating chemicals.

What are the Key Data Covered in this Silver Nitrate Market Research and Growth Report?

  • What is the expected growth of the Silver Nitrate Market between 2026 and 2030?

    • USD 4.13 billion, at a CAGR of 5.7%

  • What segmentation does the market report cover?

    • The report is segmented by Grade Type (Photographic grade, Active pharmaceutical ingredient grade, and Analytical reagents grade), Application (Photography and jewelry, Medical and healthcare, Glass coating, and Others), Type (Powder, and Liquid solution), Distribution Channel (Offline, and Online) and Geography (North America, APAC, Europe, South America, Middle East and Africa)

  • Which regions are analyzed in the report?

    • North America, APAC, Europe, South America and Middle East and Africa

  • What are the key growth drivers and market challenges?

    • Growing demand for silver nitrate in healthcare sector, Availability of substitutes for silver nitrate

  • Who are the major players in the Silver Nitrate Market?

    • American Elements Inc., Ames Goldsmith Corp., Asahi Refining Co Ltd, Avantor Inc., Columbus Chemical Inc., D F Goldsmith, GFS Chemicals Inc., Heraeus Holding GmbH, Inorganic Ventures Inc, Loba Chemie Pvt. Ltd., Macsen Laboratories, Materion Corp., Merck KGaA, Metalor Technologies SA, ProChem Inc, Ricca Chemical Co., Spectrum Chemical Mfg. Corp., Strem Chemicals Inc., Thermo Fisher Scientific Inc. and Tokyo Chemical Industry Co.

Market Research Insights

  • The market's dynamics are shaped by the precise requirements of its end-users, where the adoption of high-purity grades directly impacts operational outcomes. For instance, the use of analytical grade silver nitrate in quality control protocols has led to a 20% reduction in product batch rejections for chemical manufacturers.
  • In the medical sector, pharmaceutical firms employing silver nitrate in antiseptic formulations report a 15% improvement in product stability compared to alternatives. This demand for reliability underscores the importance of different offerings, from silver nitrate crystals for industrial synthesis to specialized silver standard solutions for laboratory calibration.
  • The market is also influenced by the availability of industrial grade silver nitrate, which supports cost-sensitive applications like water treatment, balancing performance with economic feasibility for municipal and industrial operators.

We can help! Our analysts can customize this silver nitrate market research report to meet your requirements.

Get in touch

1. Executive Summary

1.1 Market overview

Executive Summary - Chart on Market Overview
Executive Summary - Data Table on Market Overview
Executive Summary - Chart on Global Market Characteristics
Executive Summary - Chart on Market by Geography
Executive Summary - Chart on Market Segmentation by Grade Type
Executive Summary - Chart on Market Segmentation by Application
Executive Summary - Chart on Market Segmentation by Type
Executive Summary - Chart on Market Segmentation by Distribution Channel
Executive Summary - Chart on Incremental Growth
Executive Summary - Data Table on Incremental Growth
Executive Summary - Chart on Company Market Positioning

2. Technavio Analysis

2.1 Analysis of price sensitivity, lifecycle, customer purchase basket, adoption rates, and purchase criteria

2.2 Criticality of inputs and Factors of differentiation

Chart on Overview on criticality of inputs and factors of differentiation

2.3 Factors of disruption

Chart on Overview on factors of disruption

2.4 Impact of drivers and challenges

Chart on Impact of drivers and challenges in 2025 and 2030

3. Market Landscape

3.1 Market ecosystem

Chart on Parent Market
Data Table on - Parent Market

3.2 Market characteristics

Chart on Market characteristics analysis

3.3 Value chain analysis

Chart on Value chain analysis

4. Market Sizing

4.1 Market definition

Data Table on Offerings of companies included in the market definition

4.2 Market segment analysis

Market segments

4.3 Market size 2025

4.4 Market outlook: Forecast for 2025-2030

Chart on Global - Market size and forecast 2025-2030 ($ million)
Data Table on Global - Market size and forecast 2025-2030 ($ million)
Chart on Global Market: Year-over-year growth 2025-2030 (%)
Data Table on Global Market: Year-over-year growth 2025-2030 (%)

5. Historic Market Size

5.1 Global Silver Nitrate Market 2020 - 2024

Historic Market Size - Data Table on Global Silver Nitrate Market 2020 - 2024 ($ million)

5.2 Grade Type segment analysis 2020 - 2024

Historic Market Size - Grade Type Segment 2020 - 2024 ($ million)

5.3 Application segment analysis 2020 - 2024

Historic Market Size - Application Segment 2020 - 2024 ($ million)

5.4 Type segment analysis 2020 - 2024

Historic Market Size - Type Segment 2020 - 2024 ($ million)

5.5 Distribution Channel segment analysis 2020 - 2024

Historic Market Size - Distribution Channel Segment 2020 - 2024 ($ million)

5.6 Geography segment analysis 2020 - 2024

Historic Market Size - Geography Segment 2020 - 2024 ($ million)

5.7 Country segment analysis 2020 - 2024

Historic Market Size - Country Segment 2020 - 2024 ($ million)

6. Qualitative Analysis

6.1 Impact of AI on the Global Silver Nitrate Market

6.2 Impact of Geopolitical Conflicts on the Global Silver Nitrate Market

7. Five Forces Analysis

7.1 Five forces summary

Five forces analysis - Comparison between 2025 and 2030

7.2 Bargaining power of buyers

Bargaining power of buyers - Impact of key factors 2025 and 2030

7.3 Bargaining power of suppliers

Bargaining power of suppliers - Impact of key factors in 2025 and 2030

7.4 Threat of new entrants

Threat of new entrants - Impact of key factors in 2025 and 2030

7.5 Threat of substitutes

Threat of substitutes - Impact of key factors in 2025 and 2030

7.6 Threat of rivalry

Threat of rivalry - Impact of key factors in 2025 and 2030

7.7 Market condition

Chart on Market condition - Five forces 2025 and 2030

8. Market Segmentation by Grade Type

8.1 Market segments

Chart on Grade Type - Market share 2025-2030 (%)
Data Table on Grade Type - Market share 2025-2030 (%)

8.2 Comparison by Grade Type

Chart on Comparison by Grade Type
Data Table on Comparison by Grade Type

8.3 Photographic grade - Market size and forecast 2025-2030

Chart on Photographic grade - Market size and forecast 2025-2030 ($ million)
Data Table on Photographic grade - Market size and forecast 2025-2030 ($ million)
Chart on Photographic grade - Year-over-year growth 2025-2030 (%)
Data Table on Photographic grade - Year-over-year growth 2025-2030 (%)

8.4 Active pharmaceutical ingredient grade - Market size and forecast 2025-2030

Chart on Active pharmaceutical ingredient grade - Market size and forecast 2025-2030 ($ million)
Data Table on Active pharmaceutical ingredient grade - Market size and forecast 2025-2030 ($ million)
Chart on Active pharmaceutical ingredient grade - Year-over-year growth 2025-2030 (%)
Data Table on Active pharmaceutical ingredient grade - Year-over-year growth 2025-2030 (%)

8.5 Analytical reagents grade - Market size and forecast 2025-2030

Chart on Analytical reagents grade - Market size and forecast 2025-2030 ($ million)
Data Table on Analytical reagents grade - Market size and forecast 2025-2030 ($ million)
Chart on Analytical reagents grade - Year-over-year growth 2025-2030 (%)
Data Table on Analytical reagents grade - Year-over-year growth 2025-2030 (%)

8.6 Market opportunity by Grade Type

Market opportunity by Grade Type ($ million)
Data Table on Market opportunity by Grade Type ($ million)

9. Market Segmentation by Application

9.1 Market segments

Chart on Application - Market share 2025-2030 (%)
Data Table on Application - Market share 2025-2030 (%)

9.2 Comparison by Application

Chart on Comparison by Application
Data Table on Comparison by Application

9.3 Photography and jewelry - Market size and forecast 2025-2030

Chart on Photography and jewelry - Market size and forecast 2025-2030 ($ million)
Data Table on Photography and jewelry - Market size and forecast 2025-2030 ($ million)
Chart on Photography and jewelry - Year-over-year growth 2025-2030 (%)
Data Table on Photography and jewelry - Year-over-year growth 2025-2030 (%)

9.4 Medical and healthcare - Market size and forecast 2025-2030

Chart on Medical and healthcare - Market size and forecast 2025-2030 ($ million)
Data Table on Medical and healthcare - Market size and forecast 2025-2030 ($ million)
Chart on Medical and healthcare - Year-over-year growth 2025-2030 (%)
Data Table on Medical and healthcare - Year-over-year growth 2025-2030 (%)

9.5 Glass coating - Market size and forecast 2025-2030

Chart on Glass coating - Market size and forecast 2025-2030 ($ million)
Data Table on Glass coating - Market size and forecast 2025-2030 ($ million)
Chart on Glass coating - Year-over-year growth 2025-2030 (%)
Data Table on Glass coating - Year-over-year growth 2025-2030 (%)

9.6 Others - Market size and forecast 2025-2030

Chart on Others - Market size and forecast 2025-2030 ($ million)
Data Table on Others - Market size and forecast 2025-2030 ($ million)
Chart on Others - Year-over-year growth 2025-2030 (%)
Data Table on Others - Year-over-year growth 2025-2030 (%)

9.7 Market opportunity by Application

Market opportunity by Application ($ million)
Data Table on Market opportunity by Application ($ million)

10. Market Segmentation by Type

10.1 Market segments

Chart on Type - Market share 2025-2030 (%)
Data Table on Type - Market share 2025-2030 (%)

10.2 Comparison by Type

Chart on Comparison by Type
Data Table on Comparison by Type

10.3 Powder - Market size and forecast 2025-2030

Chart on Powder - Market size and forecast 2025-2030 ($ million)
Data Table on Powder - Market size and forecast 2025-2030 ($ million)
Chart on Powder - Year-over-year growth 2025-2030 (%)
Data Table on Powder - Year-over-year growth 2025-2030 (%)

10.4 Liquid solution - Market size and forecast 2025-2030

Chart on Liquid solution - Market size and forecast 2025-2030 ($ million)
Data Table on Liquid solution - Market size and forecast 2025-2030 ($ million)
Chart on Liquid solution - Year-over-year growth 2025-2030 (%)
Data Table on Liquid solution - Year-over-year growth 2025-2030 (%)

10.5 Market opportunity by Type

Market opportunity by Type ($ million)
Data Table on Market opportunity by Type ($ million)

11. Market Segmentation by Distribution Channel

11.1 Market segments

Chart on Distribution Channel - Market share 2025-2030 (%)
Data Table on Distribution Channel - Market share 2025-2030 (%)

11.2 Comparison by Distribution Channel

Chart on Comparison by Distribution Channel
Data Table on Comparison by Distribution Channel

11.3 Offline - Market size and forecast 2025-2030

Chart on Offline - Market size and forecast 2025-2030 ($ million)
Data Table on Offline - Market size and forecast 2025-2030 ($ million)
Chart on Offline - Year-over-year growth 2025-2030 (%)
Data Table on Offline - Year-over-year growth 2025-2030 (%)

11.4 Online - Market size and forecast 2025-2030

Chart on Online - Market size and forecast 2025-2030 ($ million)
Data Table on Online - Market size and forecast 2025-2030 ($ million)
Chart on Online - Year-over-year growth 2025-2030 (%)
Data Table on Online - Year-over-year growth 2025-2030 (%)

11.5 Market opportunity by Distribution Channel

Market opportunity by Distribution Channel ($ million)
Data Table on Market opportunity by Distribution Channel ($ million)

12. Customer Landscape

12.1 Customer landscape overview

Analysis of price sensitivity, lifecycle, customer purchase basket, adoption rates, and purchase criteria

13. Geographic Landscape

13.1 Geographic segmentation

Chart on Market share by geography 2025-2030 (%)
Data Table on Market share by geography 2025-2030 (%)

13.2 Geographic comparison

Chart on Geographic comparison
Data Table on Geographic comparison

13.3 North America - Market size and forecast 2025-2030

Chart on North America - Market size and forecast 2025-2030 ($ million)
Data Table on North America - Market size and forecast 2025-2030 ($ million)
Chart on North America - Year-over-year growth 2025-2030 (%)
Data Table on North America - Year-over-year growth 2025-2030 (%)
Chart on Regional Comparison - North America
Data Table on Regional Comparison - North America

13.3.1 US - Market size and forecast 2025-2030

Chart on US - Market size and forecast 2025-2030 ($ million)
Data Table on US - Market size and forecast 2025-2030 ($ million)
Chart on US - Year-over-year growth 2025-2030 (%)
Data Table on US - Year-over-year growth 2025-2030 (%)

13.3.2 Canada - Market size and forecast 2025-2030

Chart on Canada - Market size and forecast 2025-2030 ($ million)
Data Table on Canada - Market size and forecast 2025-2030 ($ million)
Chart on Canada - Year-over-year growth 2025-2030 (%)
Data Table on Canada - Year-over-year growth 2025-2030 (%)

13.3.3 Mexico - Market size and forecast 2025-2030

Chart on Mexico - Market size and forecast 2025-2030 ($ million)
Data Table on Mexico - Market size and forecast 2025-2030 ($ million)
Chart on Mexico - Year-over-year growth 2025-2030 (%)
Data Table on Mexico - Year-over-year growth 2025-2030 (%)

13.4 APAC - Market size and forecast 2025-2030

Chart on APAC - Market size and forecast 2025-2030 ($ million)
Data Table on APAC - Market size and forecast 2025-2030 ($ million)
Chart on APAC - Year-over-year growth 2025-2030 (%)
Data Table on APAC - Year-over-year growth 2025-2030 (%)
Chart on Regional Comparison - APAC
Data Table on Regional Comparison - APAC

13.4.1 China - Market size and forecast 2025-2030

Chart on China - Market size and forecast 2025-2030 ($ million)
Data Table on China - Market size and forecast 2025-2030 ($ million)
Chart on China - Year-over-year growth 2025-2030 (%)
Data Table on China - Year-over-year growth 2025-2030 (%)

13.4.2 Japan - Market size and forecast 2025-2030

Chart on Japan - Market size and forecast 2025-2030 ($ million)
Data Table on Japan - Market size and forecast 2025-2030 ($ million)
Chart on Japan - Year-over-year growth 2025-2030 (%)
Data Table on Japan - Year-over-year growth 2025-2030 (%)

13.4.3 India - Market size and forecast 2025-2030

Chart on India - Market size and forecast 2025-2030 ($ million)
Data Table on India - Market size and forecast 2025-2030 ($ million)
Chart on India - Year-over-year growth 2025-2030 (%)
Data Table on India - Year-over-year growth 2025-2030 (%)

13.4.4 South Korea - Market size and forecast 2025-2030

Chart on South Korea - Market size and forecast 2025-2030 ($ million)
Data Table on South Korea - Market size and forecast 2025-2030 ($ million)
Chart on South Korea - Year-over-year growth 2025-2030 (%)
Data Table on South Korea - Year-over-year growth 2025-2030 (%)

13.4.5 Australia - Market size and forecast 2025-2030

Chart on Australia - Market size and forecast 2025-2030 ($ million)
Data Table on Australia - Market size and forecast 2025-2030 ($ million)
Chart on Australia - Year-over-year growth 2025-2030 (%)
Data Table on Australia - Year-over-year growth 2025-2030 (%)

13.4.6 Indonesia - Market size and forecast 2025-2030

Chart on Indonesia - Market size and forecast 2025-2030 ($ million)
Data Table on Indonesia - Market size and forecast 2025-2030 ($ million)
Chart on Indonesia - Year-over-year growth 2025-2030 (%)
Data Table on Indonesia - Year-over-year growth 2025-2030 (%)

13.5 Europe - Market size and forecast 2025-2030

Chart on Europe - Market size and forecast 2025-2030 ($ million)
Data Table on Europe - Market size and forecast 2025-2030 ($ million)
Chart on Europe - Year-over-year growth 2025-2030 (%)
Data Table on Europe - Year-over-year growth 2025-2030 (%)
Chart on Regional Comparison - Europe
Data Table on Regional Comparison - Europe

13.5.1 Germany - Market size and forecast 2025-2030

Chart on Germany - Market size and forecast 2025-2030 ($ million)
Data Table on Germany - Market size and forecast 2025-2030 ($ million)
Chart on Germany - Year-over-year growth 2025-2030 (%)
Data Table on Germany - Year-over-year growth 2025-2030 (%)

13.5.2 UK - Market size and forecast 2025-2030

Chart on UK - Market size and forecast 2025-2030 ($ million)
Data Table on UK - Market size and forecast 2025-2030 ($ million)
Chart on UK - Year-over-year growth 2025-2030 (%)
Data Table on UK - Year-over-year growth 2025-2030 (%)

13.5.3 France - Market size and forecast 2025-2030

Chart on France - Market size and forecast 2025-2030 ($ million)
Data Table on France - Market size and forecast 2025-2030 ($ million)
Chart on France - Year-over-year growth 2025-2030 (%)
Data Table on France - Year-over-year growth 2025-2030 (%)

13.5.4 Italy - Market size and forecast 2025-2030

Chart on Italy - Market size and forecast 2025-2030 ($ million)
Data Table on Italy - Market size and forecast 2025-2030 ($ million)
Chart on Italy - Year-over-year growth 2025-2030 (%)
Data Table on Italy - Year-over-year growth 2025-2030 (%)

13.5.5 Spain - Market size and forecast 2025-2030

Chart on Spain - Market size and forecast 2025-2030 ($ million)
Data Table on Spain - Market size and forecast 2025-2030 ($ million)
Chart on Spain - Year-over-year growth 2025-2030 (%)
Data Table on Spain - Year-over-year growth 2025-2030 (%)

13.5.6 The Netherlands - Market size and forecast 2025-2030

Chart on The Netherlands - Market size and forecast 2025-2030 ($ million)
Data Table on The Netherlands - Market size and forecast 2025-2030 ($ million)
Chart on The Netherlands - Year-over-year growth 2025-2030 (%)
Data Table on The Netherlands - Year-over-year growth 2025-2030 (%)

13.6 South America - Market size and forecast 2025-2030

Chart on South America - Market size and forecast 2025-2030 ($ million)
Data Table on South America - Market size and forecast 2025-2030 ($ million)
Chart on South America - Year-over-year growth 2025-2030 (%)
Data Table on South America - Year-over-year growth 2025-2030 (%)
Chart on Regional Comparison - South America
Data Table on Regional Comparison - South America

13.6.1 Brazil - Market size and forecast 2025-2030

Chart on Brazil - Market size and forecast 2025-2030 ($ million)
Data Table on Brazil - Market size and forecast 2025-2030 ($ million)
Chart on Brazil - Year-over-year growth 2025-2030 (%)
Data Table on Brazil - Year-over-year growth 2025-2030 (%)

13.6.2 Argentina - Market size and forecast 2025-2030

Chart on Argentina - Market size and forecast 2025-2030 ($ million)
Data Table on Argentina - Market size and forecast 2025-2030 ($ million)
Chart on Argentina - Year-over-year growth 2025-2030 (%)
Data Table on Argentina - Year-over-year growth 2025-2030 (%)

13.6.3 Chile - Market size and forecast 2025-2030

Chart on Chile - Market size and forecast 2025-2030 ($ million)
Data Table on Chile - Market size and forecast 2025-2030 ($ million)
Chart on Chile - Year-over-year growth 2025-2030 (%)
Data Table on Chile - Year-over-year growth 2025-2030 (%)

13.7 Middle East and Africa - Market size and forecast 2025-2030

Chart on Middle East and Africa - Market size and forecast 2025-2030 ($ million)
Data Table on Middle East and Africa - Market size and forecast 2025-2030 ($ million)
Chart on Middle East and Africa - Year-over-year growth 2025-2030 (%)
Data Table on Middle East and Africa - Year-over-year growth 2025-2030 (%)
Chart on Regional Comparison - Middle East and Africa
Data Table on Regional Comparison - Middle East and Africa

13.7.1 Saudi Arabia - Market size and forecast 2025-2030

Chart on Saudi Arabia - Market size and forecast 2025-2030 ($ million)
Data Table on Saudi Arabia - Market size and forecast 2025-2030 ($ million)
Chart on Saudi Arabia - Year-over-year growth 2025-2030 (%)
Data Table on Saudi Arabia - Year-over-year growth 2025-2030 (%)

13.7.2 UAE - Market size and forecast 2025-2030

Chart on UAE - Market size and forecast 2025-2030 ($ million)
Data Table on UAE - Market size and forecast 2025-2030 ($ million)
Chart on UAE - Year-over-year growth 2025-2030 (%)
Data Table on UAE - Year-over-year growth 2025-2030 (%)

13.7.3 South Africa - Market size and forecast 2025-2030

Chart on South Africa - Market size and forecast 2025-2030 ($ million)
Data Table on South Africa - Market size and forecast 2025-2030 ($ million)
Chart on South Africa - Year-over-year growth 2025-2030 (%)
Data Table on South Africa - Year-over-year growth 2025-2030 (%)

13.7.4 Israel - Market size and forecast 2025-2030

Chart on Israel - Market size and forecast 2025-2030 ($ million)
Data Table on Israel - Market size and forecast 2025-2030 ($ million)
Chart on Israel - Year-over-year growth 2025-2030 (%)
Data Table on Israel - Year-over-year growth 2025-2030 (%)

13.7.5 Turkey - Market size and forecast 2025-2030

Chart on Turkey - Market size and forecast 2025-2030 ($ million)
Data Table on Turkey - Market size and forecast 2025-2030 ($ million)
Chart on Turkey - Year-over-year growth 2025-2030 (%)
Data Table on Turkey - Year-over-year growth 2025-2030 (%)

13.8 Market opportunity by geography

Market opportunity by geography ($ million)
Data Tables on Market opportunity by geography ($ million)

14. Drivers, Challenges, and Opportunity

14.1 Market drivers

Growing demand for silver nitrate in healthcare sector
Increased demand for silver nitrate in photography and jewelry applications
Low cost and easy availability of raw materials

14.2 Market challenges

Availability of substitutes for silver nitrate
Stringent government regulations in manufacturing and usage of silver nitrate
Health hazards associated with silver nitrate utilization

14.3 Impact of drivers and challenges

Impact of drivers and challenges in 2025 and 2030

14.4 Market opportunities

Rising medical applications of silver nitrate
Increasing demand for analytical reagents
Advancements in nanotechnology driving demand for silver nitrate

15. Competitive Landscape

15.1 Overview

15.2

Overview on criticality of inputs and factors of differentiation

15.3 Landscape disruption

Overview on factors of disruption

15.4 Industry risks

Impact of key risks on business

16. Competitive Analysis

16.1 Companies profiled

Companies covered

16.2 Company ranking index

16.3 Market positioning of companies

Matrix on companies position and classification

16.4 American Elements Inc.

American Elements Inc. - Overview
American Elements Inc. - Product / Service
American Elements Inc. - Key offerings
SWOT

16.5 Ames Goldsmith Corp.

Ames Goldsmith Corp. - Overview
Ames Goldsmith Corp. - Product / Service
Ames Goldsmith Corp. - Key offerings
SWOT

16.6 Asahi Refining Co Ltd

Asahi Refining Co Ltd - Overview
Asahi Refining Co Ltd - Product / Service
Asahi Refining Co Ltd - Key offerings
SWOT

16.7 Avantor Inc.

Avantor Inc. - Overview
Avantor Inc. - Business segments
Avantor Inc. - Key offerings
Avantor Inc. - Segment focus
SWOT

16.8 Columbus Chemical Inc.

Columbus Chemical Inc. - Overview
Columbus Chemical Inc. - Product / Service
Columbus Chemical Inc. - Key offerings
SWOT

16.9 D F Goldsmith

D F Goldsmith - Overview
D F Goldsmith - Product / Service
D F Goldsmith - Key offerings
SWOT

16.10 GFS Chemicals Inc.

GFS Chemicals Inc. - Overview
GFS Chemicals Inc. - Product / Service
GFS Chemicals Inc. - Key offerings
SWOT

16.11 Heraeus Holding GmbH

Heraeus Holding GmbH - Overview
Heraeus Holding GmbH - Product / Service
Heraeus Holding GmbH - Key offerings
SWOT

16.12 Inorganic Ventures Inc

Inorganic Ventures Inc - Overview
Inorganic Ventures Inc - Product / Service
Inorganic Ventures Inc - Key offerings
SWOT

16.13 Loba Chemie Pvt. Ltd.

Loba Chemie Pvt. Ltd. - Overview
Loba Chemie Pvt. Ltd. - Product / Service
Loba Chemie Pvt. Ltd. - Key offerings
SWOT

16.14 Macsen Laboratories

Macsen Laboratories - Overview
Macsen Laboratories - Product / Service
Macsen Laboratories - Key offerings
SWOT

16.15 Materion Corp.

Materion Corp. - Overview
Materion Corp. - Business segments
Materion Corp. - Key offerings
Materion Corp. - Segment focus
SWOT

16.16 Merck KGaA

Merck KGaA - Overview
Merck KGaA - Business segments
Merck KGaA - Key news
Merck KGaA - Key offerings
Merck KGaA - Segment focus
SWOT

16.17 Spectrum Chemical Mfg. Corp.

Spectrum Chemical Mfg. Corp. - Overview
Spectrum Chemical Mfg. Corp. - Product / Service
Spectrum Chemical Mfg. Corp. - Key offerings
SWOT

16.18 Thermo Fisher Scientific Inc.

Thermo Fisher Scientific Inc. - Overview
Thermo Fisher Scientific Inc. - Business segments
Thermo Fisher Scientific Inc. - Key news
Thermo Fisher Scientific Inc. - Key offerings
Thermo Fisher Scientific Inc. - Segment focus
SWOT

17. Appendix

17.1 Scope of the report

Market definition
Objectives
Notes and caveats

17.2 Inclusions and exclusions checklist

Inclusions checklist
Exclusions checklist

17.3 Currency conversion rates for US$

17.4 Research methodology

17.5 Data procurement

Information sources

17.6 Data validation

17.7 Validation techniques employed for market sizing

17.8 Data synthesis

17.9 360 degree market analysis

17.10 List of abbreviations

Research Methodology

Technavio presents a detailed picture of the market by way of study, synthesis, and summation of data from multiple sources. The analysts have presented the various facets of the market with a particular focus on identifying the key industry influencers. The data thus presented is comprehensive, reliable, and the result of extensive research, both primary and secondary.

INFORMATION SOURCES

Primary sources

  • Manufacturers and suppliers
  • Channel partners
  • Industry experts
  • Strategic decision makers

Secondary sources

  • Industry journals and periodicals
  • Government data
  • Financial reports of key industry players
  • Historical data
  • Press releases

DATA ANALYSIS

Data Synthesis

  • Collation of data
  • Estimation of key figures
  • Analysis of derived insights

Data Validation

  • Triangulation with data models
  • Reference against proprietary databases
  • Corroboration with industry experts

REPORT WRITING

Qualitative

  • Market drivers
  • Market challenges
  • Market trends
  • Five forces analysis

Quantitative

  • Market size and forecast
  • Market segmentation
  • Geographical insights
  • Competitive landscape

Interested in this report?

Get your sample now to see our research methodology and insights!

Download Now

Frequently Asked Questions

Silver Nitrate market growth will increase by USD 4134.9 million during 2026-2030.

The Silver Nitrate market is expected to grow at a CAGR of 5.7% during 2026-2030.

Silver Nitrate market is segmented by Grade type (Photographic grade, Active pharmaceutical ingredient grade, Analytical reagents grade) Application (Photography and jewelry, Medical and healthcare, Glass coating, Others) Type (Powder, Liquid solution) Distribution channel (Offline, Online)

American Elements Inc., Ames Goldsmith Corp., Asahi Refining Co Ltd, Avantor Inc., Columbus Chemical Inc., D F Goldsmith, GFS Chemicals Inc., Heraeus Holding GmbH, Inorganic Ventures Inc, Loba Chemie Pvt. Ltd., Macsen Laboratories, Materion Corp., Merck KGaA, Metalor Technologies SA, ProChem Inc, Ricca Chemical Co., Spectrum Chemical Mfg. Corp., Strem Chemicals Inc., Thermo Fisher Scientific Inc., Tokyo Chemical Industry Co. are a few of the key vendors in the Silver Nitrate market.

North America will register the highest growth rate of 38.5% among the other regions. Therefore, the Silver Nitrate market in North America is expected to garner significant business opportunities for the vendors during the forecast period.

US, Canada, Mexico, China, Japan, India, South Korea, Australia, Indonesia, Germany, UK, France, Italy, Spain, The Netherlands, Brazil, Argentina, Chile, Saudi Arabia, UAE, South Africa, Israel, Turkey

  • Growing demand for silver nitrate in healthcare sector is the driving factor this market.

The Silver Nitrate market vendors should focus on grabbing business opportunities from the Grade type segment as it accounted for the largest market share in the base year.
RIA - Research AI Assistant
Ask RIA