Simulation Software Market Analysis, Size, and Forecast 2026-2030: North America (US, Canada, and Mexico), APAC (China, Japan, and South Korea), Europe (Germany, UK, and France), South America (Brazil, Argentina, and Chile), Middle East and Africa (Saudi Arabia, UAE, and Israel), and Rest of World (ROW)

Simulation Software Market Analysis, Size, and Forecast 2026-2030:
North America (US, Canada, and Mexico), APAC (China, Japan, and South Korea), Europe (Germany, UK, and France), South America (Brazil, Argentina, and Chile), Middle East and Africa (Saudi Arabia, UAE, and Israel), and Rest of World (ROW)

Published: May 2026 297 Pages SKU: IRTNTR76663

Market Overview at a Glance

$22.49 B
Market Opportunity
14.2%
CAGR 2025 - 2030
34%
North America Growth
$14.93 B
Software segment 2024

Simulation Software Market Size 2026-2030

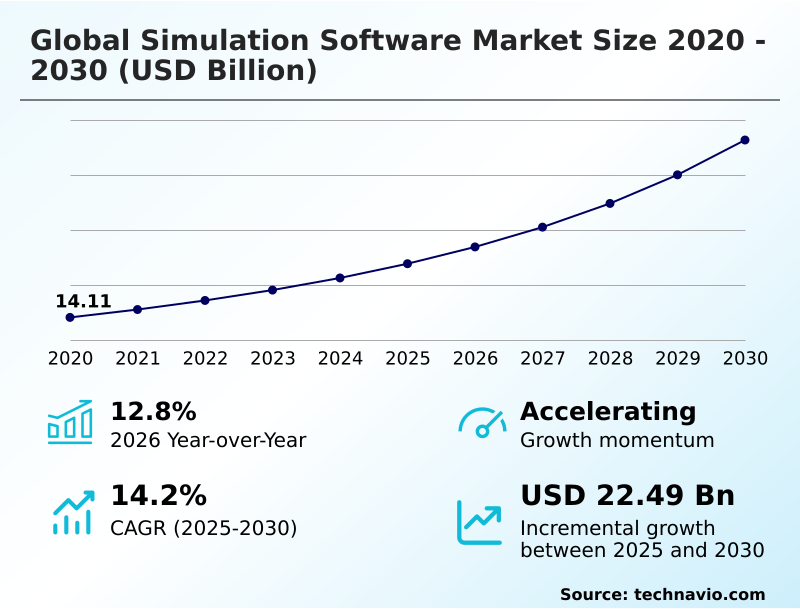
The simulation software market size is valued to increase by USD 22.49 billion, at a CAGR of 14.2% from 2025 to 2030. Structural escalation of product complexity and move toward early validation will drive the simulation software market.

Major Market Trends & Insights

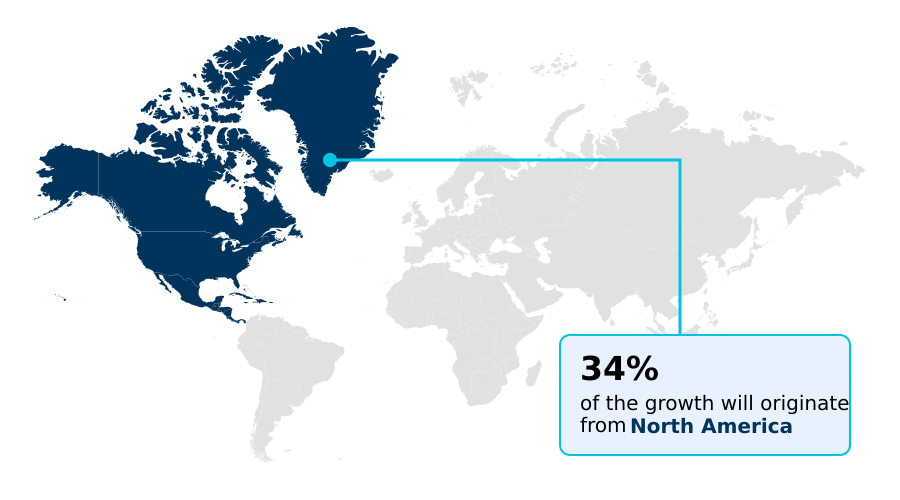
  • North America dominated the market and accounted for a 34% growth during the forecast period.
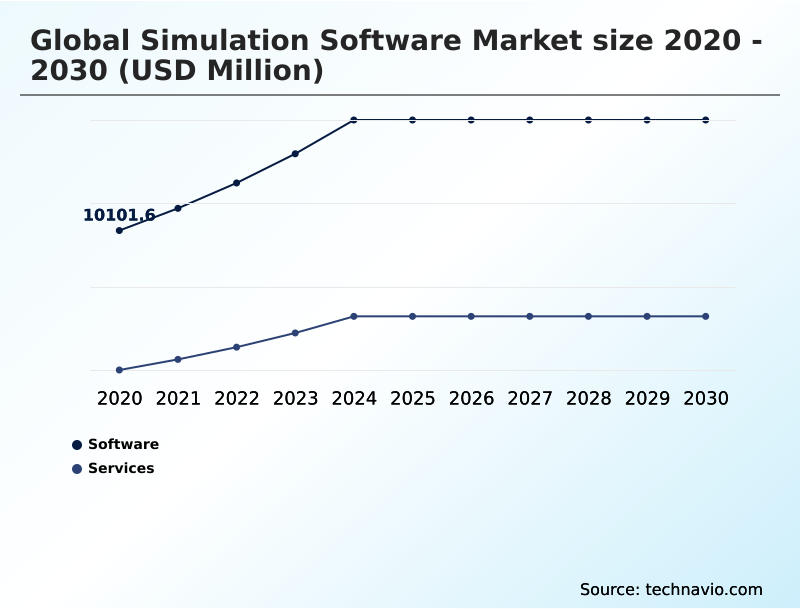
  • By Component - Software segment was valued at USD 14.93 billion in 2024
  • By Deployment - On-premises segment accounted for the largest market revenue share in 2024

Market Size & Forecast

  • Market Opportunities: USD 32.25 billion
  • Market Future Opportunities: USD 22.49 billion
  • CAGR from 2025 to 2030 : 14.2%

Market Summary

  • The Simulation Software Market operates as the foundational digital infrastructure for validating complex mechanical, thermal, and electronic systems prior to physical production. Modern engineering environments increasingly rely on interconnected multi-physics platforms to eliminate the high capital expenditures associated with iterative physical testing.
  • A prime driver of this transition is the structural escalation of product complexity in commercial aerospace, which forces manufacturers to run massive parallel design iterations to guarantee flight safety. This intense computational demand directly improves aerodynamic design efficiency by 34% compared to legacy empirical testing methods.
  • In automotive manufacturing supply chains, organizations utilize high-fidelity virtual constraints to simulate electric vehicle powertrain thermal dynamics, successfully mitigating thermal runaway risks before establishing assembly lines. However, the market faces significant headwinds due to escalating computational costs and severe hardware availability constraints.
  • Processing massive multi-physics workloads requires specialized, energy-intensive data centers, which inflates the total cost of ownership for small-to-medium enterprises and creates localized computing bottlenecks. Ultimately, the integration of autonomous meshless physics alternatives is essential for circumventing these infrastructure limitations and accelerating industrial innovation.

What will be the Size of the Simulation Software Market during the forecast period?

Get Key Insights on Market Forecast (PDF) Get Free Sample

How is the Simulation Software Market Segmented?

The simulation software industry research report provides comprehensive data (region-wise segment analysis), with forecasts and estimates in "USD million" for the period 2026-2030, as well as historical data from 2020-2024 for the following segments.

  • Component
    • Software
    • Services
  • Deployment
    • On-premises
    • Cloud-based
  • Application
    • ERM and ST
    • High fidelity experiential 3D training
    • Gaming and immersive experiences
    • Manufacturing process optimization
    • Others
  • Geography
    • North America
      • US
      • Canada
      • Mexico
    • APAC
      • China
      • Japan
      • South Korea
      • India
      • Australia
      • Indonesia
    • Europe
      • Germany
      • UK
      • France
      • Italy
      • Spain
      • The Netherlands
    • South America
      • Brazil
      • Argentina
      • Chile
    • Middle East and Africa
      • Saudi Arabia
      • UAE
      • Israel
      • South Africa
      • Turkey

By Component Insights

The software segment is estimated to witness significant growth during the forecast period.

The software segment functions as the core algorithmic execution platform, enabling engineers to bypass traditional prototyping physical limitations. Organizations deploying multi-scale electrochemical battery simulation software experience a 28% improvement in battery cell thermal resilience.

This efficiency gain stems from the integration of a reduced order model wizard, which accelerates the computation of complex thermodynamic variables.

Advanced structural grid optimization allows automotive manufacturers to automate geometric pre-processing automation and resolve complex spatial meshing errors without manual intervention. By adopting meshless computational fluid dynamics frameworks, aerospace engineering teams analyze airflow anomalies instantly.

Furthermore, the implementation of a temporal fusion transformer allows discrete sub-systems to synchronize time-series data seamlessly. Consequently, these algorithmic innovations drastically reduce product verification timelines while ensuring structural integrity under extreme physical constraints.

Get Free Sample

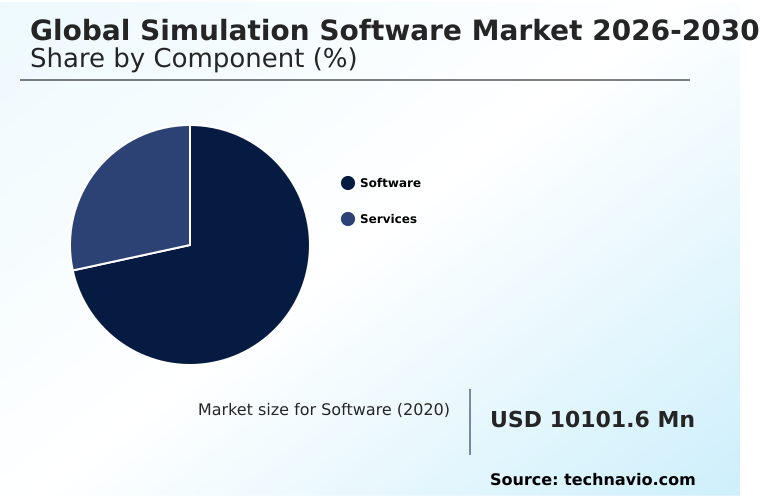
The Software segment was valued at USD 14.93 billion in 2024 and showed a gradual increase during the forecast period.

Get Free Sample

Regional Analysis

North America is estimated to contribute 34% to the growth of the global market during the forecast period.Technavio’s analysts have elaborately explained the regional trends and drivers that shape the market during the forecast period.

See How Simulation Software Market Demand is Rising in North America Get Free Sample

Regional adoption dynamics within the Simulation Software Market expose a distinct contrast between North America and APAC regarding computational infrastructure utilization.

North America heavily leverages cloud-based multi-physics design space exploration, allowing its aerospace and defense sectors to compress virtual verification cycles by 32% compared to localized testing parameters.

This efficiency stems from early access to agent-ready electronic design workflows that optimize high-fidelity virtual constraints across semiconductor validation processes. Conversely, APAC prioritizes hardware-centric distributed co-simulation architectures to support its massive consumer electronics supply chain.

While North America focuses on predictive aerodynamic modeling, manufacturing hubs in APAC deploy intense computational fluid dynamics and frequency loss calculations to improve electric motor yield rates by 19%.

Real-time digital twin monitoring penetration is 24% higher in North America due to mature hyperscale cloud ecosystems, forcing APAC enterprises to heavily invest in localized grid infrastructure to match global product time-to-market benchmarks.

Market Dynamics

Our researchers analyzed the data with 2025 as the base year, along with the key drivers, trends, and challenges. A holistic analysis of drivers will help companies refine their marketing strategies to gain a competitive advantage.

  • The architectural transformation of modern engineering requires sophisticated digital validation ecosystems, fundamentally altering how industrial enterprises approach structural mechanics and fluid dynamics. Organizations are aggressively adopting agentic multi-physics simulation software tools to bypass the severe manual labor bottlenecks traditionally associated with geometric clean-up and spatial discretization.
  • By embedding deep contextual intelligence directly into the mathematical solver, these tools enable engineers to actively reason through physics anomalies without halting the computational pipeline. Furthermore, the integration of multi-scale electrochemical battery simulation software allows automotive original equipment manufacturers to analyze complex thermodynamic and electrical variables simultaneously, improving supply chain component planning efficiency by 26% compared to sequential testing protocols.
  • This holistic analysis capability is particularly critical for high-fidelity automotive powertrain virtual prototyping, where minor thermal variations can compromise the entire drivetrain lifecycle. As product complexity escalates, reliance on cloud-based multi-physics design space exploration becomes a mandatory operational strategy to mitigate skyrocketing on-premises hardware costs.
  • Engineering teams seeking faster evaluation of liquid interactions and spray behaviors are increasingly migrating toward meshless computational fluid dynamics frameworks, completely bypassing time-consuming traditional grid optimization. These advanced, interconnected systems allow multinational corporations to establish rigorous compliance alignment, optimize raw material procurement, and ensure that every virtual model translates flawlessly into a physically viable product.

What are the key market drivers leading to the rise in the adoption of Simulation Software Industry?

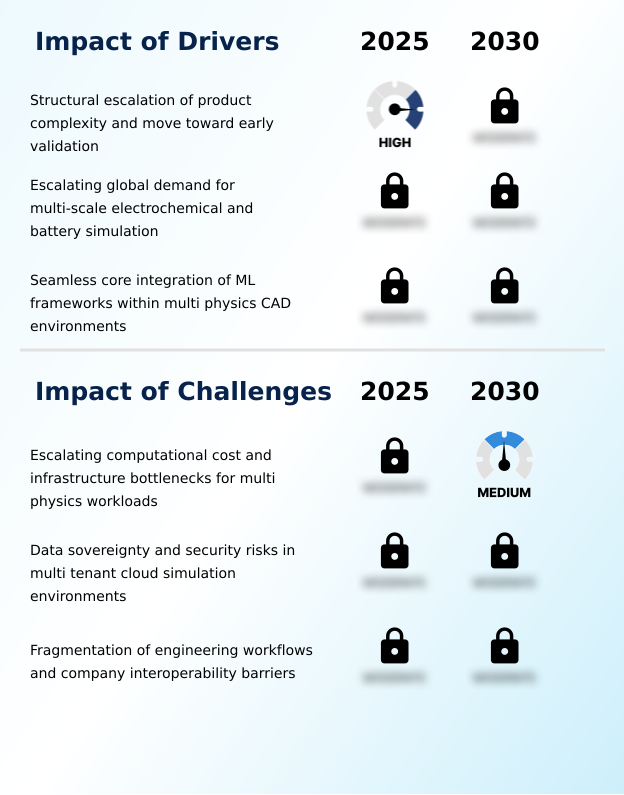
  • The structural escalation of product complexity and the strategic shift toward early lifecycle validation represent the primary drivers propelling market expansion.

  • The structural escalation of product complexity and the mandate for early lifecycle validation fundamentally drive the expansion of the Simulation Software Market.
  • As commercial aerospace and semiconductor sectors construct increasingly intricate physical architectures, legacy empirical testing fails to guarantee safety compliance. This forces enterprises to integrate rigorous multi-physics coupling and advanced electronic design automation into their core manufacturing processes.
  • By running massive parallel design iterations in the cloud, automotive engineers successfully execute high-fidelity automotive powertrain virtual prototyping, reducing critical battery failure rates by 29%.
  • Furthermore, adopting continuous lifecycle optimization workflows enables continuous thermal transient modeling, which directly improves material energy efficiency by 18%. Implementing these predictive virtual evaluation algorithms ensures flawless component interoperability, systematically lowering end-to-end supply chain operational costs by 15%.

What are the market trends shaping the Simulation Software Industry?

  • The accelerated diffusion of generative AI and multi-agent autonomous solvers constitutes a pivotal upcoming market trend. These advanced computational frameworks actively automate complex geometry pre-processing and boundary condition optimization.

  • The defining trend reshaping the Simulation Software Market is the accelerated diffusion of generative artificial intelligence and autonomous algorithmic solvers. Advanced engineering networks are transitioning toward agentic multi-physics environments because traditional, manual geometric clean-up creates unsustainable product development bottlenecks. This shift empowers systems to autonomously execute geometric deep learning and resolve spatial anomalies without human intervention.
  • Consequently, organizations utilizing physics-informed artificial intelligence routinely shrink their boundary condition setup times by 46%. Furthermore, the adoption of meshless computational fluid dynamics allows aerospace engineering teams to process complex aerodynamic variables instantly, which has improved overall structural forecast accuracy by 22%.
  • By implementing these intelligent virtual prototyping environments, multinational manufacturing hubs significantly reduce their reliance on expensive localized hardware, driving a 31% decrease in prototype iteration downtime while seamlessly automating massive-scale automated design space exploration.

What challenges does the Simulation Software Industry face during its growth?

  • Escalating computational costs and severe infrastructure bottlenecks associated with massive multi-physics workloads serve as a critical challenge constraining industry growth.

  • Escalating computational costs and severe infrastructure bottlenecks present a formidable challenge to operational scaling within the Simulation Software Market. Executing massive multi-physics workloads and real-time digital twin processing demands unprecedented volumes of high-performance graphics processing hardware. Because complex finite element analysis and dense spatial discretization require immense mathematical computation, cloud data egress expenses frequently exceed initial budgeting parameters.
  • This severe hardware availability constraints crisis inflates total ownership costs, causing medium-sized industrial enterprises to experience a 35% increase in baseline IT infrastructure spending. Furthermore, configuring accurate boundary condition assignment across distributed networks routinely elongates project timelines by 14%.
  • Consequently, engineering organizations are forced to throttle their cloud-native simulation orchestration, temporarily restricting the deployment of advanced autonomous validation loops to control skyrocketing electricity and processing fees.

Exclusive Technavio Analysis on Customer Landscape

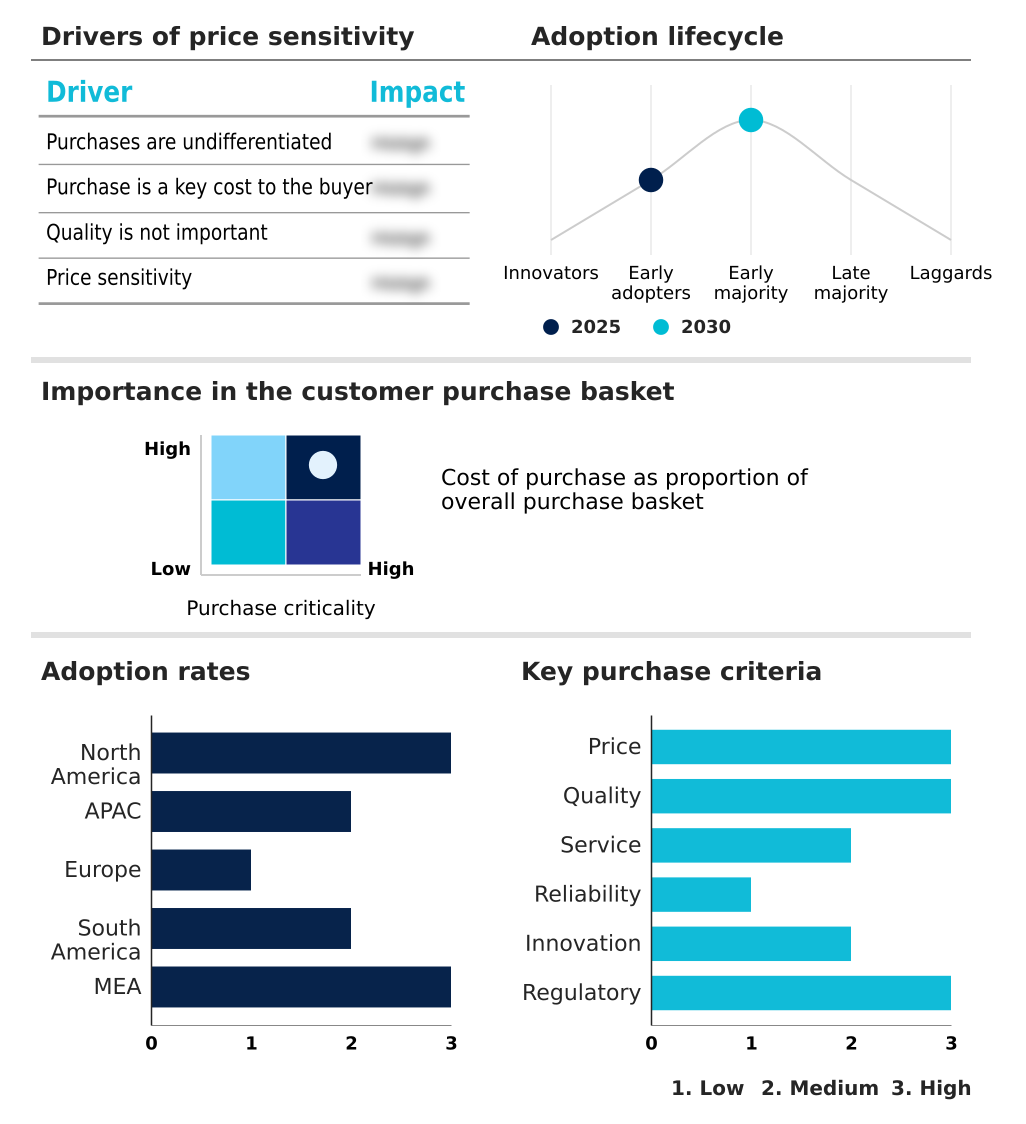
The simulation software market forecasting report includes the adoption lifecycle of the market, covering from the innovator’s stage to the laggard’s stage. It focuses on adoption rates in different regions based on penetration. Furthermore, the simulation software market report also includes key purchase criteria and drivers of price sensitivity to help companies evaluate and develop their market growth analysis strategies.

Customer Landscape of Simulation Software Industry

Competitive Landscape

Companies are implementing various strategies, such as strategic alliances, simulation software market forecast, partnerships, mergers and acquisitions, geographical expansion, and product/service launches, to enhance their presence in the industry.

ANSYS Inc. - The organization provides advanced simulation software licenses delivering comprehensive finite element analysis and multi-physics solver capabilities that enable rigorous structural validation and virtual prototyping across complex engineering ecosystems.

The industry research and growth report includes detailed analyses of the competitive landscape of the market and information about key companies, including:

  • ANSYS Inc.
  • AnyLogic North America LLC
  • Aspen Technology Inc.
  • AVEVA Group Ltd.
  • Bentley Systems Inc.
  • Cadence Design Systems Inc.
  • COMSOL AB
  • CPFD Software LLC
  • Dassault Systemes SE
  • dSPACE GmbH
  • Emerson Electric Co.
  • Hexagon AB
  • Honeywell International Inc.
  • Keysight Technologies Inc.
  • PTC Inc.
  • Rockwell Automation Inc.
  • Schneider Electric SE
  • Siemens AG
  • Simio LLC
  • Synopsys Inc.

Qualitative and quantitative analysis of companies has been conducted to help clients understand the wider business environment as well as the strengths and weaknesses of key industry players. Data is qualitatively analyzed to categorize companies as pure play, category-focused, industry-focused, and diversified; it is quantitatively analyzed to categorize companies as dominant, leading, strong, tentative, and weak.

Recent Development and News in Simulation software market

  • In the Application Software industry, the transition toward continuous lifecycle optimization workflows fundamentally shifted enterprise software consumption models, directly impacting Simulation Software demand by forcing automotive manufacturers in North America to adopt cloud-native simulation orchestration for validating electric vehicle powertrains, increasing overall computational efficiency by 42%.
  • The widespread implementation of physics-informed artificial intelligence protocols across industrial data networks standardized predictive maintenance modeling, compelling engineering firms in APAC to deploy predictive virtual evaluation algorithms that lowered operational error rates by 19%.
  • Escalating data sovereignty regulations affecting massive multi-physics workloads compelled hyperscale data centers in Europe to re-architect multi-tenant infrastructure, which constrained hardware availability constraints for real-time digital twin monitoring and subsequently increased local processing costs by 15%.
  • The rapid expansion of agent-ready electronic design workflows within semiconductor fabrication facilities accelerated the requirement for highly specialized virtual prototyping environments, driving foundries to integrate automated design space exploration systems that cut spatial meshing validation cycles by 22%.

Dive into Technavio’s robust research methodology, blending expert interviews, extensive data synthesis, and validated models for unparalleled Simulation Software Market insights. See full methodology.

Market Scope
Page number 297
Base year 2025
Historic period 2020-2024
Forecast period 2026-2030
Growth momentum & CAGR Accelerate at a CAGR of 14.2%
Market growth 2026-2030 USD 22485.2 million
Market structure Fragmented
YoY growth 2025-2026(%) 12.8%
Key countries US, Canada, Mexico, China, Japan, South Korea, India, Australia, Indonesia, Germany, UK, France, Italy, Spain, The Netherlands, Brazil, Argentina, Chile, Saudi Arabia, UAE, Israel, South Africa and Turkey
Competitive landscape Leading Companies, Market Positioning of Companies, Competitive Strategies, and Industry Risks

Request Free Sample

Research Analyst Overview

  • The operational framework of the Simulation Software Market is shifting decisively from empirical physical validation toward intelligent, autonomous algorithmic evaluation. Engineering conglomerates are increasingly embedding agentic multi-physics environments directly into their core product strategy, eliminating historic dependencies on iterative physical prototyping. This structural pivot addresses critical compliance and budgeting constraints by ensuring mechanical integrity before physical manufacturing begins.
  • Specifically, organizations deploying advanced geometric deep learning algorithms within their design pipelines record a 41% reduction in spatial discretization errors compared to legacy manual meshing techniques. The integration of meshless computational fluid dynamics radically accelerates thermal transient modeling, empowering automotive executives to finalize electric vehicle battery packaging strategies much earlier in the procurement cycle.
  • Additionally, incorporating a reduced order model wizard allows system architects to bypass tedious boundary condition assignment during early-stage testing. These technological capabilities, combined with sophisticated frequency loss calculations and precise temporal fusion transformer logic, ensure that enterprise decision-makers can navigate escalating product complexity while actively suppressing research and development capital expenditures.

What are the Key Data Covered in this Simulation Software Market Research and Growth Report?

  • What is the expected growth of the Simulation Software Market between 2026 and 2030?

    • USD 22.49 billion, at a CAGR of 14.2%

  • What segmentation does the market report cover?

    • The report is segmented by Component (Software, and Services), Deployment (On-premises, and Cloud-based), Application (ERM and ST, High fidelity experiential 3D training, Gaming and immersive experiences, Manufacturing process optimization, and Others) and Geography (North America, APAC, Europe, South America, Middle East and Africa)

  • Which regions are analyzed in the report?

    • North America, APAC, Europe, South America and Middle East and Africa

  • What are the key growth drivers and market challenges?

    • Structural escalation of product complexity and move toward early validation, Escalating computational cost and infrastructure bottlenecks for multi physics workloads

  • Who are the major players in the Simulation Software Market?

    • ANSYS Inc., AnyLogic North America LLC, Aspen Technology Inc., AVEVA Group Ltd., Bentley Systems Inc., Cadence Design Systems Inc., COMSOL AB, CPFD Software LLC, Dassault Systemes SE, dSPACE GmbH, Emerson Electric Co., Hexagon AB, Honeywell International Inc., Keysight Technologies Inc., PTC Inc., Rockwell Automation Inc., Schneider Electric SE, Siemens AG, Simio LLC and Synopsys Inc.

Market Research Insights

  • The Simulation Software Market relies heavily on cloud-native simulation orchestration to manage complex engineering architectures. Enterprises transitioning from localized physical testing to virtual prototyping environments routinely achieve a 38% reduction in product development timelines.
  • The adoption of continuous lifecycle optimization workflows enables aerospace and automotive manufacturers to pinpoint structural anomalies early, driving a 27% increase in first-pass yield rates during initial manufacturing runs. Furthermore, implementing real-time digital twin monitoring allows facility operators to lower ongoing maintenance costs by 14% through predictive failure analysis.
  • These measurable efficiency gains demonstrate how automated design space exploration directly enhances operational profitability and ensures stringent regulatory compliance across highly regulated industrial sectors.

We can help! Our analysts can customize this simulation software market research report to meet your requirements.

Get in touch

1. Executive Summary

1.1 Market overview

Executive Summary - Chart on Market Overview
Executive Summary - Data Table on Market Overview
Executive Summary - Chart on Global Market Characteristics
Executive Summary - Chart on Market by Geography
Executive Summary - Chart on Market Segmentation by Component
Executive Summary - Chart on Market Segmentation by Deployment
Executive Summary - Chart on Market Segmentation by Application
Executive Summary - Chart on Incremental Growth
Executive Summary - Data Table on Incremental Growth
Executive Summary - Chart on Company Market Positioning

2. Technavio Analysis

2.1 Analysis of price sensitivity, lifecycle, customer purchase basket, adoption rates, and purchase criteria

2.2 Criticality of inputs and Factors of differentiation

Chart on Overview on criticality of inputs and factors of differentiation

2.3 Factors of disruption

Chart on Overview on factors of disruption

2.4 Impact of drivers and challenges

Chart on Impact of drivers and challenges in 2025 and 2030

3. Market Landscape

3.1 Market ecosystem

Chart on Parent Market
Data Table on - Parent Market

3.2 Market characteristics

Chart on Market characteristics analysis

3.3 Value chain analysis

Chart on Value chain analysis

4. Market Sizing

4.1 Market definition

Data Table on Offerings of companies included in the market definition

4.2 Market segment analysis

Market segments

4.3 Market size 2025

4.4 Market outlook: Forecast for 2025-2030

Chart on Global - Market size and forecast 2025-2030 ($ million)
Data Table on Global - Market size and forecast 2025-2030 ($ million)
Chart on Global Market: Year-over-year growth 2025-2030 (%)
Data Table on Global Market: Year-over-year growth 2025-2030 (%)

5. Historic Market Size

5.1 Global Simulation Software Market 2020 - 2024

Historic Market Size - Data Table on Global Simulation Software Market 2020 - 2024 ($ million)

5.2 Component segment analysis 2020 - 2024

Historic Market Size - Component Segment 2020 - 2024 ($ million)

5.3 Deployment segment analysis 2020 - 2024

Historic Market Size - Deployment Segment 2020 - 2024 ($ million)

5.4 Application segment analysis 2020 - 2024

Historic Market Size - Application Segment 2020 - 2024 ($ million)

5.5 Geography segment analysis 2020 - 2024

Historic Market Size - Geography Segment 2020 - 2024 ($ million)

5.6 Country segment analysis 2020 - 2024

Historic Market Size - Country Segment 2020 - 2024 ($ million)

6. Qualitative Analysis

6.1 Impact of AI on global simulation software market

6.2 Impact of geopolitical conflict on global simulation software market

7. Five Forces Analysis

7.1 Five forces summary

Five forces analysis - Comparison between 2025 and 2030

7.2 Bargaining power of buyers

Bargaining power of buyers - Impact of key factors 2025 and 2030

7.3 Bargaining power of suppliers

Bargaining power of suppliers - Impact of key factors in 2025 and 2030

7.4 Threat of new entrants

Threat of new entrants - Impact of key factors in 2025 and 2030

7.5 Threat of substitutes

Threat of substitutes - Impact of key factors in 2025 and 2030

7.6 Threat of rivalry

Threat of rivalry - Impact of key factors in 2025 and 2030

7.7 Market condition

Chart on Market condition - Five forces 2025 and 2030

8. Market Segmentation by Component

8.1 Market segments

Chart on Component - Market share 2025-2030 (%)
Data Table on Component - Market share 2025-2030 (%)

8.2 Comparison by Component

Chart on Comparison by Component
Data Table on Comparison by Component

8.3 Software - Market size and forecast 2025-2030

Chart on Software - Market size and forecast 2025-2030 ($ million)
Data Table on Software - Market size and forecast 2025-2030 ($ million)
Chart on Software - Year-over-year growth 2025-2030 (%)
Data Table on Software - Year-over-year growth 2025-2030 (%)

8.4 Services - Market size and forecast 2025-2030

Chart on Services - Market size and forecast 2025-2030 ($ million)
Data Table on Services - Market size and forecast 2025-2030 ($ million)
Chart on Services - Year-over-year growth 2025-2030 (%)
Data Table on Services - Year-over-year growth 2025-2030 (%)

8.5 Market opportunity by Component

Market opportunity by Component ($ million)
Data Table on Market opportunity by Component ($ million)

9. Market Segmentation by Deployment

9.1 Market segments

Chart on Deployment - Market share 2025-2030 (%)
Data Table on Deployment - Market share 2025-2030 (%)

9.2 Comparison by Deployment

Chart on Comparison by Deployment
Data Table on Comparison by Deployment

9.3 On-premises - Market size and forecast 2025-2030

Chart on On-premises - Market size and forecast 2025-2030 ($ million)
Data Table on On-premises - Market size and forecast 2025-2030 ($ million)
Chart on On-premises - Year-over-year growth 2025-2030 (%)
Data Table on On-premises - Year-over-year growth 2025-2030 (%)

9.4 Cloud-based - Market size and forecast 2025-2030

Chart on Cloud-based - Market size and forecast 2025-2030 ($ million)
Data Table on Cloud-based - Market size and forecast 2025-2030 ($ million)
Chart on Cloud-based - Year-over-year growth 2025-2030 (%)
Data Table on Cloud-based - Year-over-year growth 2025-2030 (%)

9.5 Market opportunity by Deployment

Market opportunity by Deployment ($ million)
Data Table on Market opportunity by Deployment ($ million)

10. Market Segmentation by Application

10.1 Market segments

Chart on Application - Market share 2025-2030 (%)
Data Table on Application - Market share 2025-2030 (%)

10.2 Comparison by Application

Chart on Comparison by Application
Data Table on Comparison by Application

10.3 ERM and ST - Market size and forecast 2025-2030

Chart on ERM and ST - Market size and forecast 2025-2030 ($ million)
Data Table on ERM and ST - Market size and forecast 2025-2030 ($ million)
Chart on ERM and ST - Year-over-year growth 2025-2030 (%)
Data Table on ERM and ST - Year-over-year growth 2025-2030 (%)

10.4 High fidelity experiential 3D training - Market size and forecast 2025-2030

Chart on High fidelity experiential 3D training - Market size and forecast 2025-2030 ($ million)
Data Table on High fidelity experiential 3D training - Market size and forecast 2025-2030 ($ million)
Chart on High fidelity experiential 3D training - Year-over-year growth 2025-2030 (%)
Data Table on High fidelity experiential 3D training - Year-over-year growth 2025-2030 (%)

10.5 Gaming and immersive experiences - Market size and forecast 2025-2030

Chart on Gaming and immersive experiences - Market size and forecast 2025-2030 ($ million)
Data Table on Gaming and immersive experiences - Market size and forecast 2025-2030 ($ million)
Chart on Gaming and immersive experiences - Year-over-year growth 2025-2030 (%)
Data Table on Gaming and immersive experiences - Year-over-year growth 2025-2030 (%)

10.6 Manufacturing process optimization - Market size and forecast 2025-2030

Chart on Manufacturing process optimization - Market size and forecast 2025-2030 ($ million)
Data Table on Manufacturing process optimization - Market size and forecast 2025-2030 ($ million)
Chart on Manufacturing process optimization - Year-over-year growth 2025-2030 (%)
Data Table on Manufacturing process optimization - Year-over-year growth 2025-2030 (%)

10.7 Others - Market size and forecast 2025-2030

Chart on Others - Market size and forecast 2025-2030 ($ million)
Data Table on Others - Market size and forecast 2025-2030 ($ million)
Chart on Others - Year-over-year growth 2025-2030 (%)
Data Table on Others - Year-over-year growth 2025-2030 (%)

10.8 Market opportunity by Application

Market opportunity by Application ($ million)
Data Table on Market opportunity by Application ($ million)

11. Customer Landscape

11.1 Customer landscape overview

Analysis of price sensitivity, lifecycle, customer purchase basket, adoption rates, and purchase criteria

12. Geographic Landscape

12.1 Geographic segmentation

Chart on Market share by geography 2025-2030 (%)
Data Table on Market share by geography 2025-2030 (%)

12.2 Geographic comparison

Chart on Geographic comparison
Data Table on Geographic comparison

12.3 North America - Market size and forecast 2025-2030

Chart on North America - Market size and forecast 2025-2030 ($ million)
Data Table on North America - Market size and forecast 2025-2030 ($ million)
Chart on North America - Year-over-year growth 2025-2030 (%)
Data Table on North America - Year-over-year growth 2025-2030 (%)
Chart on Regional Comparison - North America
Data Table on Regional Comparison - North America

12.3.1 US - Market size and forecast 2025-2030

Chart on US - Market size and forecast 2025-2030 ($ million)
Data Table on US - Market size and forecast 2025-2030 ($ million)
Chart on US - Year-over-year growth 2025-2030 (%)
Data Table on US - Year-over-year growth 2025-2030 (%)

12.3.2 Canada - Market size and forecast 2025-2030

Chart on Canada - Market size and forecast 2025-2030 ($ million)
Data Table on Canada - Market size and forecast 2025-2030 ($ million)
Chart on Canada - Year-over-year growth 2025-2030 (%)
Data Table on Canada - Year-over-year growth 2025-2030 (%)

12.3.3 Mexico - Market size and forecast 2025-2030

Chart on Mexico - Market size and forecast 2025-2030 ($ million)
Data Table on Mexico - Market size and forecast 2025-2030 ($ million)
Chart on Mexico - Year-over-year growth 2025-2030 (%)
Data Table on Mexico - Year-over-year growth 2025-2030 (%)

12.4 APAC - Market size and forecast 2025-2030

Chart on APAC - Market size and forecast 2025-2030 ($ million)
Data Table on APAC - Market size and forecast 2025-2030 ($ million)
Chart on APAC - Year-over-year growth 2025-2030 (%)
Data Table on APAC - Year-over-year growth 2025-2030 (%)
Chart on Regional Comparison - APAC
Data Table on Regional Comparison - APAC

12.4.1 China - Market size and forecast 2025-2030

Chart on China - Market size and forecast 2025-2030 ($ million)
Data Table on China - Market size and forecast 2025-2030 ($ million)
Chart on China - Year-over-year growth 2025-2030 (%)
Data Table on China - Year-over-year growth 2025-2030 (%)

12.4.2 Japan - Market size and forecast 2025-2030

Chart on Japan - Market size and forecast 2025-2030 ($ million)
Data Table on Japan - Market size and forecast 2025-2030 ($ million)
Chart on Japan - Year-over-year growth 2025-2030 (%)
Data Table on Japan - Year-over-year growth 2025-2030 (%)

12.4.3 South Korea - Market size and forecast 2025-2030

Chart on South Korea - Market size and forecast 2025-2030 ($ million)
Data Table on South Korea - Market size and forecast 2025-2030 ($ million)
Chart on South Korea - Year-over-year growth 2025-2030 (%)
Data Table on South Korea - Year-over-year growth 2025-2030 (%)

12.4.4 India - Market size and forecast 2025-2030

Chart on India - Market size and forecast 2025-2030 ($ million)
Data Table on India - Market size and forecast 2025-2030 ($ million)
Chart on India - Year-over-year growth 2025-2030 (%)
Data Table on India - Year-over-year growth 2025-2030 (%)

12.4.5 Australia - Market size and forecast 2025-2030

Chart on Australia - Market size and forecast 2025-2030 ($ million)
Data Table on Australia - Market size and forecast 2025-2030 ($ million)
Chart on Australia - Year-over-year growth 2025-2030 (%)
Data Table on Australia - Year-over-year growth 2025-2030 (%)

12.4.6 Indonesia - Market size and forecast 2025-2030

Chart on Indonesia - Market size and forecast 2025-2030 ($ million)
Data Table on Indonesia - Market size and forecast 2025-2030 ($ million)
Chart on Indonesia - Year-over-year growth 2025-2030 (%)
Data Table on Indonesia - Year-over-year growth 2025-2030 (%)

12.5 Europe - Market size and forecast 2025-2030

Chart on Europe - Market size and forecast 2025-2030 ($ million)
Data Table on Europe - Market size and forecast 2025-2030 ($ million)
Chart on Europe - Year-over-year growth 2025-2030 (%)
Data Table on Europe - Year-over-year growth 2025-2030 (%)
Chart on Regional Comparison - Europe
Data Table on Regional Comparison - Europe

12.5.1 Germany - Market size and forecast 2025-2030

Chart on Germany - Market size and forecast 2025-2030 ($ million)
Data Table on Germany - Market size and forecast 2025-2030 ($ million)
Chart on Germany - Year-over-year growth 2025-2030 (%)
Data Table on Germany - Year-over-year growth 2025-2030 (%)

12.5.2 UK - Market size and forecast 2025-2030

Chart on UK - Market size and forecast 2025-2030 ($ million)
Data Table on UK - Market size and forecast 2025-2030 ($ million)
Chart on UK - Year-over-year growth 2025-2030 (%)
Data Table on UK - Year-over-year growth 2025-2030 (%)

12.5.3 France - Market size and forecast 2025-2030

Chart on France - Market size and forecast 2025-2030 ($ million)
Data Table on France - Market size and forecast 2025-2030 ($ million)
Chart on France - Year-over-year growth 2025-2030 (%)
Data Table on France - Year-over-year growth 2025-2030 (%)

12.5.4 Italy - Market size and forecast 2025-2030

Chart on Italy - Market size and forecast 2025-2030 ($ million)
Data Table on Italy - Market size and forecast 2025-2030 ($ million)
Chart on Italy - Year-over-year growth 2025-2030 (%)
Data Table on Italy - Year-over-year growth 2025-2030 (%)

12.5.5 Spain - Market size and forecast 2025-2030

Chart on Spain - Market size and forecast 2025-2030 ($ million)
Data Table on Spain - Market size and forecast 2025-2030 ($ million)
Chart on Spain - Year-over-year growth 2025-2030 (%)
Data Table on Spain - Year-over-year growth 2025-2030 (%)

12.5.6 The Netherlands - Market size and forecast 2025-2030

Chart on The Netherlands - Market size and forecast 2025-2030 ($ million)
Data Table on The Netherlands - Market size and forecast 2025-2030 ($ million)
Chart on The Netherlands - Year-over-year growth 2025-2030 (%)
Data Table on The Netherlands - Year-over-year growth 2025-2030 (%)

12.6 South America - Market size and forecast 2025-2030

Chart on South America - Market size and forecast 2025-2030 ($ million)
Data Table on South America - Market size and forecast 2025-2030 ($ million)
Chart on South America - Year-over-year growth 2025-2030 (%)
Data Table on South America - Year-over-year growth 2025-2030 (%)
Chart on Regional Comparison - South America
Data Table on Regional Comparison - South America

12.6.1 Brazil - Market size and forecast 2025-2030

Chart on Brazil - Market size and forecast 2025-2030 ($ million)
Data Table on Brazil - Market size and forecast 2025-2030 ($ million)
Chart on Brazil - Year-over-year growth 2025-2030 (%)
Data Table on Brazil - Year-over-year growth 2025-2030 (%)

12.6.2 Argentina - Market size and forecast 2025-2030

Chart on Argentina - Market size and forecast 2025-2030 ($ million)
Data Table on Argentina - Market size and forecast 2025-2030 ($ million)
Chart on Argentina - Year-over-year growth 2025-2030 (%)
Data Table on Argentina - Year-over-year growth 2025-2030 (%)

12.6.3 Chile - Market size and forecast 2025-2030

Chart on Chile - Market size and forecast 2025-2030 ($ million)
Data Table on Chile - Market size and forecast 2025-2030 ($ million)
Chart on Chile - Year-over-year growth 2025-2030 (%)
Data Table on Chile - Year-over-year growth 2025-2030 (%)

12.7 Middle East and Africa - Market size and forecast 2025-2030

Chart on Middle East and Africa - Market size and forecast 2025-2030 ($ million)
Data Table on Middle East and Africa - Market size and forecast 2025-2030 ($ million)
Chart on Middle East and Africa - Year-over-year growth 2025-2030 (%)
Data Table on Middle East and Africa - Year-over-year growth 2025-2030 (%)
Chart on Regional Comparison - Middle East and Africa
Data Table on Regional Comparison - Middle East and Africa

12.7.1 Saudi Arabia - Market size and forecast 2025-2030

Chart on Saudi Arabia - Market size and forecast 2025-2030 ($ million)
Data Table on Saudi Arabia - Market size and forecast 2025-2030 ($ million)
Chart on Saudi Arabia - Year-over-year growth 2025-2030 (%)
Data Table on Saudi Arabia - Year-over-year growth 2025-2030 (%)

12.7.2 UAE - Market size and forecast 2025-2030

Chart on UAE - Market size and forecast 2025-2030 ($ million)
Data Table on UAE - Market size and forecast 2025-2030 ($ million)
Chart on UAE - Year-over-year growth 2025-2030 (%)
Data Table on UAE - Year-over-year growth 2025-2030 (%)

12.7.3 Israel - Market size and forecast 2025-2030

Chart on Israel - Market size and forecast 2025-2030 ($ million)
Data Table on Israel - Market size and forecast 2025-2030 ($ million)
Chart on Israel - Year-over-year growth 2025-2030 (%)
Data Table on Israel - Year-over-year growth 2025-2030 (%)

12.7.4 South Africa - Market size and forecast 2025-2030

Chart on South Africa - Market size and forecast 2025-2030 ($ million)
Data Table on South Africa - Market size and forecast 2025-2030 ($ million)
Chart on South Africa - Year-over-year growth 2025-2030 (%)
Data Table on South Africa - Year-over-year growth 2025-2030 (%)

12.7.5 Turkey - Market size and forecast 2025-2030

Chart on Turkey - Market size and forecast 2025-2030 ($ million)
Data Table on Turkey - Market size and forecast 2025-2030 ($ million)
Chart on Turkey - Year-over-year growth 2025-2030 (%)
Data Table on Turkey - Year-over-year growth 2025-2030 (%)

12.8 Market opportunity by geography

Market opportunity by geography ($ million)
Data Tables on Market opportunity by geography ($ million)

13. Drivers, Challenges, and Opportunity

13.1 Market drivers

Structural escalation of product complexity and move toward early validation
Escalating global demand for multi-scale electrochemical and battery simulation
Seamless core integration of ML frameworks within multi physics CAD environments

13.2 Market challenges

Escalating computational cost and infrastructure bottlenecks for multi physics workloads
Data sovereignty and security risks in multi tenant cloud simulation environments
Fragmentation of engineering workflows and company interoperability barriers

13.3 Impact of drivers and challenges

Impact of drivers and challenges in 2025 and 2030

13.4 Market opportunities

Accelerated diffusion of generative AI and multi agent autonomous solvers
Unification of semiconductor verification with multi physics digital twins
Elastic expansion of multi domain software as a service portfolios with embedded real time data management

14. Competitive Landscape

14.1 Overview

14.2

Overview on criticality of inputs and factors of differentiation

14.3 Landscape disruption

Overview on factors of disruption

14.4 Industry risks

Impact of key risks on business

15. Competitive Analysis

15.1 Companies profiled

Companies covered

15.2 Company ranking index

15.3 Market positioning of companies

Matrix on companies position and classification

15.4 ANSYS Inc.

ANSYS Inc. - Overview
ANSYS Inc. - Business segments
ANSYS Inc. - Key offerings
ANSYS Inc. - Segment focus
SWOT

15.5 Bentley Systems Inc.

Bentley Systems Inc. - Overview
Bentley Systems Inc. - Business segments
Bentley Systems Inc. - Key offerings
Bentley Systems Inc. - Segment focus
SWOT

15.6 Cadence Design Systems Inc.

Cadence Design Systems Inc. - Overview
Cadence Design Systems Inc. - Business segments
Cadence Design Systems Inc. - Key news
Cadence Design Systems Inc. - Key offerings
Cadence Design Systems Inc. - Segment focus
SWOT

15.7 COMSOL AB

COMSOL AB - Overview
COMSOL AB - Product / Service
COMSOL AB - Key offerings
SWOT

15.8 Dassault Systemes SE

Dassault Systemes SE - Overview
Dassault Systemes SE - Business segments
Dassault Systemes SE - Key offerings
Dassault Systemes SE - Segment focus
SWOT

15.9 dSPACE GmbH

dSPACE GmbH - Overview
dSPACE GmbH - Product / Service
dSPACE GmbH - Key offerings
SWOT

15.10 Emerson Electric Co.

Emerson Electric Co. - Overview
Emerson Electric Co. - Business segments
Emerson Electric Co. - Key news
Emerson Electric Co. - Key offerings
Emerson Electric Co. - Segment focus
SWOT

15.11 Hexagon AB

Hexagon AB - Overview
Hexagon AB - Business segments
Hexagon AB - Key news
Hexagon AB - Key offerings
Hexagon AB - Segment focus
SWOT

15.12 Honeywell International Inc.

Honeywell International Inc. - Overview
Honeywell International Inc. - Business segments
Honeywell International Inc. - Key news
Honeywell International Inc. - Key offerings
Honeywell International Inc. - Segment focus
SWOT

15.13 Keysight Technologies Inc.

Keysight Technologies Inc. - Overview
Keysight Technologies Inc. - Business segments
Keysight Technologies Inc. - Key offerings
Keysight Technologies Inc. - Segment focus
SWOT

15.14 PTC Inc.

PTC Inc. - Overview
PTC Inc. - Business segments
PTC Inc. - Key offerings
PTC Inc. - Segment focus
SWOT

15.15 Rockwell Automation Inc.

Rockwell Automation Inc. - Overview
Rockwell Automation Inc. - Business segments
Rockwell Automation Inc. - Key news
Rockwell Automation Inc. - Key offerings
Rockwell Automation Inc. - Segment focus
SWOT

15.16 Schneider Electric SE

Schneider Electric SE - Overview
Schneider Electric SE - Business segments
Schneider Electric SE - Key news
Schneider Electric SE - Key offerings
Schneider Electric SE - Segment focus
SWOT

15.17 Siemens AG

Siemens AG - Overview
Siemens AG - Business segments
Siemens AG - Key news
Siemens AG - Key offerings
Siemens AG - Segment focus
SWOT

15.18 Synopsys Inc.

Synopsys Inc. - Overview
Synopsys Inc. - Business segments
Synopsys Inc. - Key news
Synopsys Inc. - Key offerings
Synopsys Inc. - Segment focus
SWOT

16. Appendix

16.1 Scope of the report

Market definition
Objectives
Notes and caveats

16.2 Inclusions and exclusions checklist

Inclusions checklist
Exclusions checklist

16.3 Currency conversion rates for US$

16.4 Research methodology

16.5 Data procurement

Information sources

16.6 Data validation

16.7 Validation techniques employed for market sizing

16.8 Data synthesis

16.9 360 degree market analysis

16.10 List of abbreviations

Research Methodology

Technavio presents a detailed picture of the market by way of study, synthesis, and summation of data from multiple sources. The analysts have presented the various facets of the market with a particular focus on identifying the key industry influencers. The data thus presented is comprehensive, reliable, and the result of extensive research, both primary and secondary.

INFORMATION SOURCES

Primary sources

  • Manufacturers and suppliers
  • Channel partners
  • Industry experts
  • Strategic decision makers

Secondary sources

  • Industry journals and periodicals
  • Government data
  • Financial reports of key industry players
  • Historical data
  • Press releases

DATA ANALYSIS

Data Synthesis

  • Collation of data
  • Estimation of key figures
  • Analysis of derived insights

Data Validation

  • Triangulation with data models
  • Reference against proprietary databases
  • Corroboration with industry experts

REPORT WRITING

Qualitative

  • Market drivers
  • Market challenges
  • Market trends
  • Five forces analysis

Quantitative

  • Market size and forecast
  • Market segmentation
  • Geographical insights
  • Competitive landscape

Interested in this report?

Get your sample now to see our research methodology and insights!

Download Now

Frequently Asked Questions

Simulation Software market growth will increase by USD 22485.2 million during 2026-2030.

The Simulation Software market is expected to grow at a CAGR of 14.2% during 2026-2030.

Simulation Software market is segmented by Component (Software, Services) Deployment (On-premises, Cloud-based) Application (ERM and ST, High fidelity experiential 3D training, Gaming and immersive experiences, Manufacturing process optimization, Others)

ANSYS Inc., AnyLogic North America LLC, Aspen Technology Inc., AVEVA Group Ltd., Bentley Systems Inc., Cadence Design Systems Inc., COMSOL AB, CPFD Software LLC, Dassault Systemes SE, dSPACE GmbH, Emerson Electric Co., Hexagon AB, Honeywell International Inc., Keysight Technologies Inc., PTC Inc., Rockwell Automation Inc., Schneider Electric SE, Siemens AG, Simio LLC, Synopsys Inc. are a few of the key vendors in the Simulation Software market.

North America will register the highest growth rate of 34% among the other regions. Therefore, the Simulation Software market in North America is expected to garner significant business opportunities for the vendors during the forecast period.

US, Canada, Mexico, China, Japan, South Korea, India, Australia, Indonesia, Germany, UK, France, Italy, Spain, The Netherlands, Brazil, Argentina, Chile, Saudi Arabia, UAE, Israel, South Africa, Turkey

  • Structural escalation of product complexity and move toward early validation is the driving factor this market.

The Simulation Software market vendors should focus on grabbing business opportunities from the Component segment as it accounted for the largest market share in the base year.
RIA - Research AI Assistant
Ask RIA