Skin Care Emulsion Market Analysis Europe, North America, APAC, South America, Middle East and Africa - US, China, Japan, Germany, France - Size and Forecast 2024-2028

Skin Care Emulsion Market Analysis Europe, North America, APAC, South America, Middle East and Africa - US, China, Japan, Germany, France - Size and Forecast 2024-2028

Published: Nov 2023 164 Pages SKU: IRTNTR76819

Market Overview at a Glance

$261.18 Mn
Market Opportunity
7.29%
CAGR
6.65
YoY growth 2023-2024(%)

Skin Care Emulsion Market Size 2024-2028 

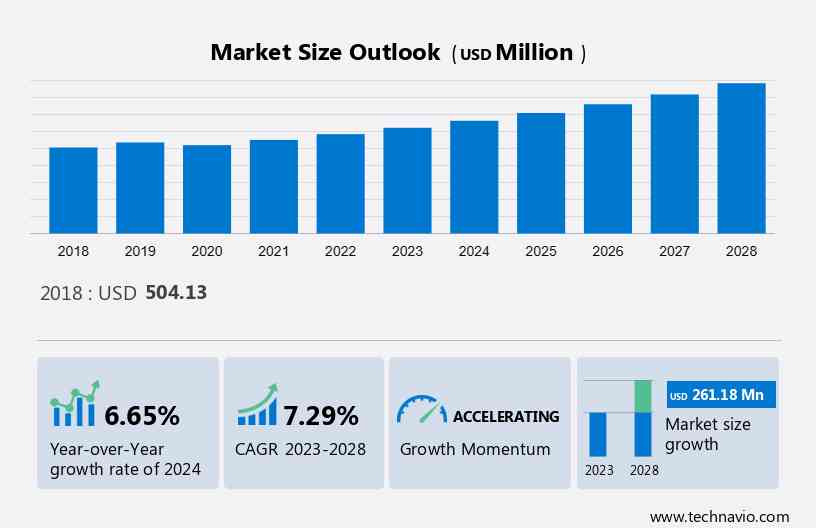
The skin care emulsion market size is estimated to grow at a CAGR of 7.29% between 2023 and 2028. The market size is forecast to increase by USD 261.18 million. Several factors play a crucial role in the market's growth, such as increasing online availability of skin care emulsions, rising beauty consciousness among people modern-day lifestyle changes and growing facial skin-related issues. 

The report offers extensive research analysis on the skin care emulsion market, with a categorization based on Distribution Channel, including offline and online. It further segments the market by Product Type, encompassing lotion and skin cream. Additionally, the report provides Geographical segmentation, covering APAC, Europe, North America, Middle East and Africa, and South America. Market size, historical data (2018-2022), and future projections are presented in terms of value (in USD million) for all the mentioned segments.

What will be the size of the Skin Care Emulsion Market During the Forecast Period?

Skin Care Emulsion Market Size

For More Highlights About this Report, Download Free Sample in a Minute 

Skin Care Emulsion Market: Key Drivers, Trends and Challenges

Our researchers analyzed the data with 2023 as the base year, along with the key drivers, trends, and challenges. A holistic analysis of drivers will help companies refine their marketing strategies to gain a competitive advantage.

Key Skin Care Emulsion Market Driver

Increasing online availability of skin care emulsions is notably driving the market growth.  Increasing internet penetration is leading to a rise in awareness about the online purchasing of skin care products such as skin care cosmetic emulsions. Sales through online channels are gradually penetrating, as products such as skin care emulsions are sold online to meet the increasing needs of consumers. Skincare emulsion product companies are increasingly adopting online platforms for selling their products in different regions. Such platforms also help customers save time, as they reduce the need to visit a retail store while enabling companies to connect directly with customers.

Moreover, increasing the online presence of skin care emulsions is further leading to more companies selling their products online. Thus, the increase in the number of digital portals offering skin care emulsion helps consumers around the world to purchase products with ease after comparing prices and product features. This, in turn, is expected to drive the growth of the skincare emulsion market during the forecast period.

Key Skin Care Emulsion Market Trends

Increasing focus on premiumization of skin care emulsion products is an emerging trend shaping the market growth. In recent times, the popularity and presence of premium skin care brands have led to market growth. Affluent consumers always look to update and advance their knowledge about skin care and are receptive to learning and engaging with luxury and premium brands online. These affluent consumers are, in turn, influencing premium skin care brands to build up their digital appeal and credibility to boost their market share. Premium brands are expanding their consumer base through product innovations, such as serums and retinol creams, not only to capture market share but also to address the skin problems of consumers effectively.

For instance, L'Oreal's premiumization and innovation division is pursuing its premiumization strategy, making high-end products affordable in a supply-driven market such as China. The brands continue to democratize high-value-added innovations. Thus, companies are focusing on new premium skin care products, including premium skin care emulsion products. Also, the demand for premium products is particularly high in North America and Western Europe. Such factors are expected to drive the growth of the market during the forecast period.

Major Skin Care Emulsion Market Challenge

Growing preferences for do-it-yourself (DIY) natural skincare products at home is a significant challenge hindering the market growth. DIY natural skincare products at home are trending among consumers, especially in North American and European countries. Social media and blogging about making natural skincare products at home allow people to access several recipes for preparing glycolic acid ,natural  care products. Consumers perceive that the natural and organic skincare products available in the market contain certain amounts of oleochemicals and chemicals, which is encouraging such consumers to shift to DIY natural skincare products at home. 

In addition, every ingredient in the DIY natural skincare product offers some beneficial properties to the user. These DIY natural skincare products can be stored at room temperature and last long without any deterioration in the quality of the ingredients. Therefore, the growing preference among consumers for DIY natural skincare products at home and the availability of DIY natural skincare product recipes on the Internet are expected to hinder the growth of the skincare emulsion market during the forecast period.

Skin Care Emulsion Market Customer Landscape

The market research report includes the adoption lifecycle of the market, covering from the innovator’s stage to the laggard’s stage. It focuses on adoption rates in different regions based on penetration. Furthermore, the report also includes key purchase criteria and drivers of price sensitivity to help companies evaluate and develop their growth strategies.

Skin Care Emulsion Market Share by Geography

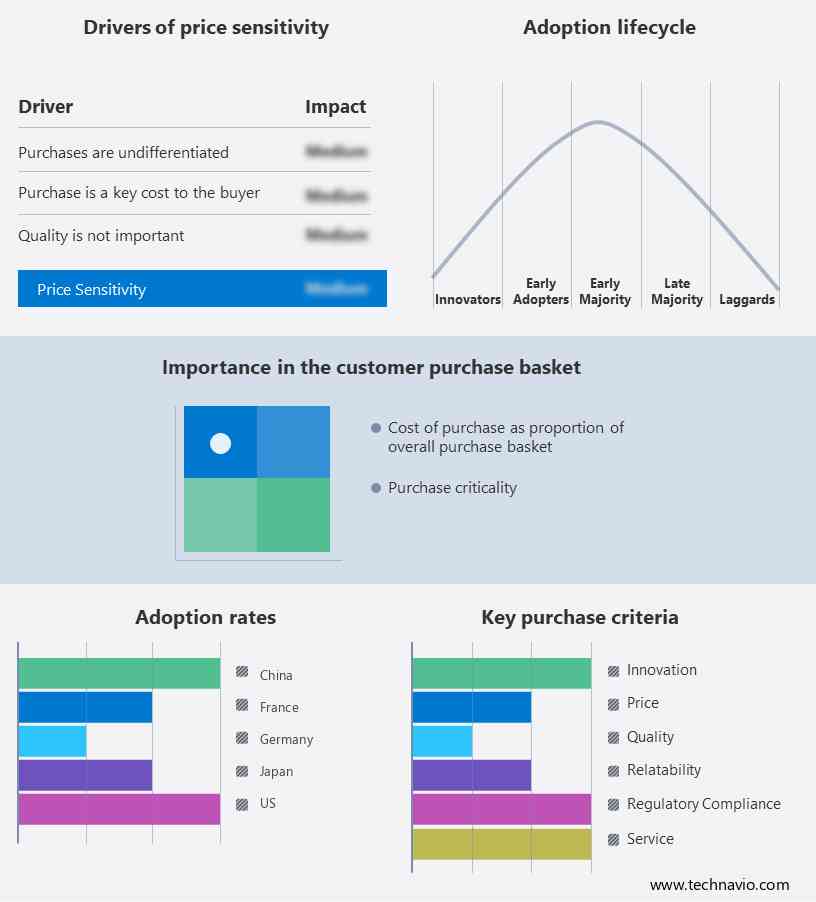
Global Skin Care Emulsion Market Customer Landscape

Who are the Major Skin Care Emulsion Market Companies?

Companies are implementing various strategies, such as strategic alliances, partnerships, mergers and acquisitions, geographical expansion, and product/service launches, to enhance their presence in the market.

AMOREPACIFIC Group Inc. - The company offers skin care emulsions such as Time response skin reserve fluid, this concentrated fluid contains first-harvest Green Tea ingredients that nourish and hydrate skin, improving visible signs of ageing.

The research report also includes detailed analyses of the competitive landscape of the market and information about 20 market companies, including:

  • Aloisia Beauty
  • Ayouthveda
  • Beiersdorf AG
  • Canadian Glacial Clay Cosmetics Corp.
  • Clarins USA Inc.
  • Daily life Forever52
  • Galderma SA
  • Johnson and Johnson
  • Kao Corp.
  • KOSE Corp.
  • LOreal SA
  • Natura and Co Holding SA
  • Nutricare Holding Pty Ltd
  • Pechoin Inc.
  • Shiseido Co. Ltd.
  • Skeyndor S.L.U
  • The Estee Lauder Companies
  • The Procter and Gamble Co.
  • Unilever PLC

Qualitative and quantitative analysis of companies has been conducted to help clients understand the wider business environment as well as the strengths and weaknesses of key market players. Data is qualitatively analyzed to categorize companies as pure play, category-focused, industry-focused, and diversified; it is quantitatively analyzed to categorize companies as dominant, leading, strong, tentative, and weak.

What are the Largest-Growing Segments in the Skin Care Emulsion Market?

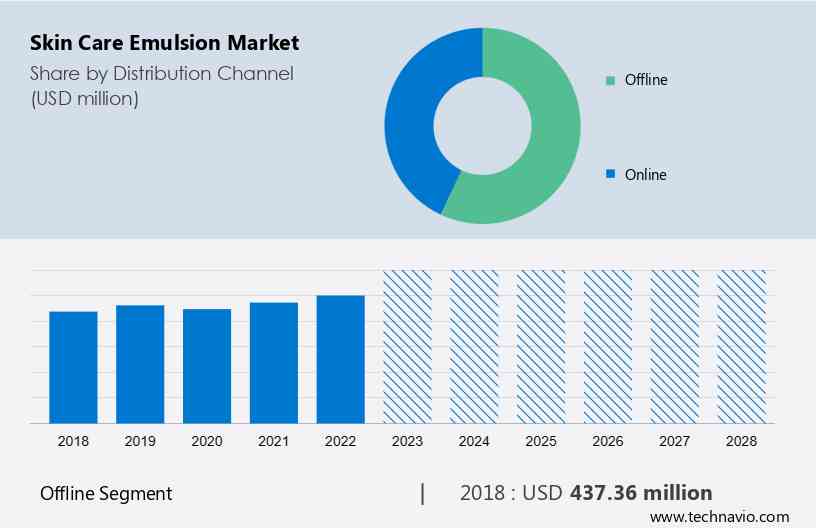
The offline segment is estimated to witness significant growth during the forecast period. The offline distribution channel accounted for the highest share of the global skincare emulsion market in 2023. The offline distribution segment is considered the most effective and influential mode of distribution as it offers a touch-and-feel experience to consumers. 

Skin Care Emulsion Market Size

Get a glance at the market contribution of various segments Download the PDF Sample

The offline segment was the largest and was valued at USD 437.36 million in 2018. Speciality stores, hypermarkets and supermarkets, convenience stores, and drug stores are the major offline channels that will contribute significantly to the global skincare emulsion market. The preference of consumers for personal care products, including skincare products through drugstores, is increasing significantly. Salons and spas are also encouraging the sales of premium skincare products as per product specifications. Moreover, salons and spas are becoming vital marketing stations for new products launched by skincare brands in the market. Hence, the sales and consumption of skincare products, such as skin care emulsions through salons and spas, are expected to grow, which will drive the growth of the market in focus during the forecast period.

Which are the Key Regions for the Skin Care Emulsion Market?

Skin Care Emulsion Market Share by Geography

For more insights on the market share of various regions Download PDF Sample now!

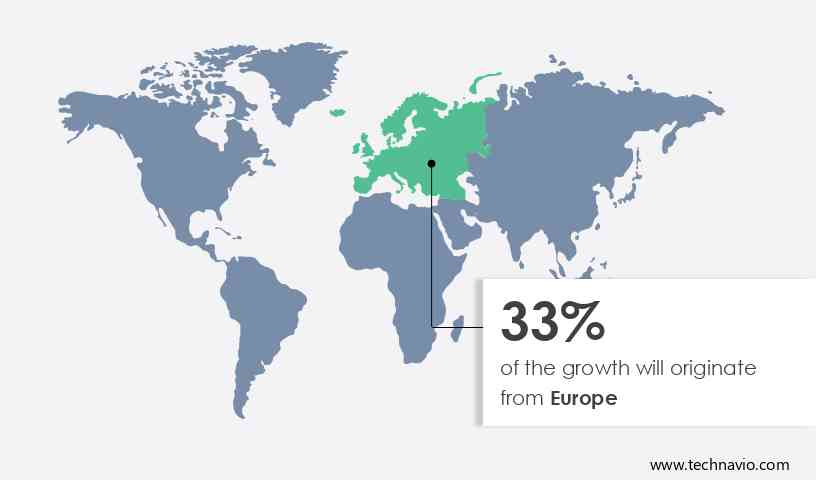
Europe is estimated to contribute 33% to the growth of the global market during the forecast period. Technavio’s analysts have elaborately explained the regional trends and drivers that shape the market during the forecast period. The top three countries in Europe include Germany, the UK, and France. The skin care emulsion market in Europe was largely supported by the growing number of fashion-conscious consumers. Conglomerate companies like Unilever PLC, LOreal SA, and Beiersdorf offer skin care emulsion products in the region and are involved in R&D related to skincare and product innovation, thus aiding in the rapid growth of the market in focus. 

In addition, with the presence of several companies offering a wide range of products and the extensive availability of resources, raw material suppliers, and manufacturing plants, the skin care emulsion market in Europe is expected to grow significantly during the forecast period.

The COVID-19 outbreak in 2020 had a significant negative impact on the expansion of the skin care emulsion market in Europe. However, in 2021, due to the initiation of large-scale COVID-19 vaccination drives led to the lifting of lockdown restrictions in a significant number of countries. Furthermore, retailers are focusing on marketing strategies, e-commerce supply-chain innovations, and increasing spending on skin care products. Thus, these factors are expected to increase the demand for skin care emulsion products,makeup base which, in turn, is expected to drive the growth of the regional skin care emulsion market during the forecast period.

Segment Overview

The skin care emulsion market report forecasts market growth by revenue at global, regional & country levels and provides an analysis of the latest trends and growth opportunities from 2018 to 2028. 

  • Distribution Channel Outlook 
    • Offline
    • Online
  • Product Type Outlook 
    • Lotion
    • Skin cream
  • Region Outlook 
    • North America
      • The U.S.
      • Canada
    • South America
      • Chile
      • Brazil
      • Argentina 
    • Europe
      • U.K.
      • Germany
      • France
      • Rest of Europe
    • APAC
      • China
      • India
    • Middle East & Africa
      • Saudi Arabia
      • South Africa
      • Rest of the Middle East & Africa

Skin Care Emulsion Market Scope

Report Coverage

Details

Page number

164

Base year

2023

Historic period

2018-2022

Forecast period

2024-2028

Growth momentum & CAGR

Accelerate at a CAGR of 7.29%

Market Growth 2024-2028

USD 261.18 million

Market structure

Fragmented

YoY growth 2023-2024(%)

6.65

Regional analysis

Europe, North America, APAC, South America, and Middle East and Africa

Performing market contribution

Europe at 33%

Key countries

US, China, Japan, Germany, and France

Competitive landscape

Leading Companies, Market Positioning of Companies, Competitive Strategies, and Industry Risks

Key companies profiled

Aloisia Beauty, AMOREPACIFIC Group Inc., Ayouthveda, Beiersdorf AG, Canadian Glacial Clay Cosmetics Corp., Clarins USA Inc., Daily life Forever52, Galderma SA, Johnson and Johnson, Kao Corp., KOSE Corp., LOreal SA, Natura and Co Holding SA, Nutricare Holding Pty Ltd, Pechoin Inc., Shiseido Co. Ltd., Skeyndor S.L.U, The Estee Lauder Companies, The Procter and Gamble Co., and Unilever PLC

Market dynamics

Parent market analysis, Market growth inducers and obstacles, Fast-growing and slow-growing segment analysis, COVID-19 impact and recovery analysis and future consumer dynamics, Market condition analysis for the forecast period. 

Customization purview

If our report has not included the data that you are looking for, you can reach out to our analysts and get segments customized.

Download PDF Sample

What are the Key Data Covered in this Skin Care Emulsion Market Research Report?

  • CAGR of the market during the forecast period
  • Detailed information on factors that will drive the growth of the market between 2024 and 2028
  • Precise estimation of the market  size and its contribution to the market in focus on the parent market
  • Accurate predictions about upcoming trends and changes in consumer behaviour
  • Growth of the market across Europe, North America, APAC, South America, and Middle East and Africa
  • A thorough analysis of the market’s competitive landscape and detailed information about companies
  • Comprehensive analysis of factors that will challenge the growth of market companies

We can help! Our analysts can customize this market research report to meet your requirements. 

Get in touch

1 Executive Summary

  • 1.1 Market overview
    • Exhibit 01: Executive Summary – Chart on Market Overview
    • Exhibit 02: Executive Summary – Data Table on Market Overview
    • Exhibit 03: Executive Summary – Chart on Global Market Characteristics
    • Exhibit 04: Executive Summary – Chart on Market by Geography
    • Exhibit 05: Executive Summary – Chart on Market Segmentation by Distribution Channel
    • Exhibit 06: Executive Summary – Chart on Market Segmentation by Product Type
    • Exhibit 07: Executive Summary – Chart on Incremental Growth
    • Exhibit 08: Executive Summary – Data Table on Incremental Growth
    • Exhibit 09: Executive Summary – Chart on Vendor Market Positioning

2 Market Landscape

  • 2.1 Market ecosystem
    • Exhibit 10: Parent market
    • Exhibit 11: Market Characteristics

3 Market Sizing

  • 3.1 Market definition
    • Exhibit 12: Offerings of vendors included in the market definition
  • 3.2 Market segment analysis
    • Exhibit 13: Market segments
  • 3.3 Market size 2023
    • 3.4 Market outlook: Forecast for 2023-2028
      • Exhibit 14: Chart on Global - Market size and forecast 2023-2028 ($ million)
      • Exhibit 15: Data Table on Global - Market size and forecast 2023-2028 ($ million)
      • Exhibit 16: Chart on Global Market: Year-over-year growth 2023-2028 (%)
      • Exhibit 17: Data Table on Global Market: Year-over-year growth 2023-2028 (%)

    4 Historic Market Size

    • 4.1 Global skin care emulsion market 2018 - 2022
      • Exhibit 18: Historic Market Size – Data Table on global skin care emulsion market 2018 - 2022 ($ million)
    • 4.2 Distribution Channel Segment Analysis 2018 - 2022
      • Exhibit 19: Historic Market Size – Distribution Channel Segment 2018 - 2022 ($ million)
    • 4.3 Type Segment Analysis 2018 - 2022
      • Exhibit 20: Historic Market Size – Type Segment 2018 - 2022 ($ million)
    • 4.4 Geography Segment Analysis 2018 - 2022
      • Exhibit 21: Historic Market Size – Geography Segment 2018 - 2022 ($ million)
    • 4.5 Country Segment Analysis 2018 - 2022
      • Exhibit 22: Historic Market Size – Country Segment 2018 - 2022 ($ million)

    5 Five Forces Analysis

    • 5.1 Five forces summary
      • Exhibit 23: Five forces analysis - Comparison between 2023 and 2028
    • 5.2 Bargaining power of buyers
      • Exhibit 24: Chart on Bargaining power of buyers – Impact of key factors 2023 and 2028
    • 5.3 Bargaining power of suppliers
      • Exhibit 25: Bargaining power of suppliers – Impact of key factors in 2023 and 2028
    • 5.4 Threat of new entrants
      • Exhibit 26: Threat of new entrants – Impact of key factors in 2023 and 2028
    • 5.5 Threat of substitutes
      • Exhibit 27: Threat of substitutes – Impact of key factors in 2023 and 2028
    • 5.6 Threat of rivalry
      • Exhibit 28: Threat of rivalry – Impact of key factors in 2023 and 2028
    • 5.7 Market condition
      • Exhibit 29: Chart on Market condition - Five forces 2023 and 2028

    6 Market Segmentation by Distribution Channel

    • 6.1 Market segments
      • Exhibit 30: Chart on Distribution Channel - Market share 2023-2028 (%)
      • Exhibit 31: Data Table on Distribution Channel - Market share 2023-2028 (%)
    • 6.2 Comparison by Distribution Channel
      • Exhibit 32: Chart on Comparison by Distribution Channel
      • Exhibit 33: Data Table on Comparison by Distribution Channel
    • 6.3 Offline - Market size and forecast 2023-2028
      • Exhibit 34: Chart on Offline - Market size and forecast 2023-2028 ($ million)
      • Exhibit 35: Data Table on Offline - Market size and forecast 2023-2028 ($ million)
      • Exhibit 36: Chart on Offline - Year-over-year growth 2023-2028 (%)
      • Exhibit 37: Data Table on Offline - Year-over-year growth 2023-2028 (%)
    • 6.4 Online - Market size and forecast 2023-2028
      • Exhibit 38: Chart on Online - Market size and forecast 2023-2028 ($ million)
      • Exhibit 39: Data Table on Online - Market size and forecast 2023-2028 ($ million)
      • Exhibit 40: Chart on Online - Year-over-year growth 2023-2028 (%)
      • Exhibit 41: Data Table on Online - Year-over-year growth 2023-2028 (%)
    • 6.5 Market opportunity by Distribution Channel
      • Exhibit 42: Market opportunity by Distribution Channel ($ million)
      • Exhibit 43: Data Table on Market opportunity by Distribution Channel ($ million)

    7 Market Segmentation by Product Type

    • 7.1 Market segments
      • Exhibit 44: Chart on Product Type - Market share 2023-2028 (%)
      • Exhibit 45: Data Table on Product Type - Market share 2023-2028 (%)
    • 7.2 Comparison by Product Type
      • Exhibit 46: Chart on Comparison by Product Type
      • Exhibit 47: Data Table on Comparison by Product Type
    • 7.3 Lotion - Market size and forecast 2023-2028
      • Exhibit 48: Chart on Lotion - Market size and forecast 2023-2028 ($ million)
      • Exhibit 49: Data Table on Lotion - Market size and forecast 2023-2028 ($ million)
      • Exhibit 50: Chart on Lotion - Year-over-year growth 2023-2028 (%)
      • Exhibit 51: Data Table on Lotion - Year-over-year growth 2023-2028 (%)
    • 7.4 Skin cream - Market size and forecast 2023-2028
      • Exhibit 52: Chart on Skin cream - Market size and forecast 2023-2028 ($ million)
      • Exhibit 53: Data Table on Skin cream - Market size and forecast 2023-2028 ($ million)
      • Exhibit 54: Chart on Skin cream - Year-over-year growth 2023-2028 (%)
      • Exhibit 55: Data Table on Skin cream - Year-over-year growth 2023-2028 (%)
    • 7.5 Market opportunity by Product Type
      • Exhibit 56: Market opportunity by Product Type ($ million)
      • Exhibit 57: Data Table on Market opportunity by Product Type ($ million)

    8 Customer Landscape

    • 8.1 Customer landscape overview
      • Exhibit 58: Analysis of price sensitivity, lifecycle, customer purchase basket, adoption rates, and purchase criteria

    9 Geographic Landscape

    • 9.1 Geographic segmentation
      • Exhibit 59: Chart on Market share by geography 2023-2028 (%)
      • Exhibit 60: Data Table on Market share by geography 2023-2028 (%)
    • 9.2 Geographic comparison
      • Exhibit 61: Chart on Geographic comparison
      • Exhibit 62: Data Table on Geographic comparison
    • 9.3 Europe - Market size and forecast 2023-2028
      • Exhibit 63: Chart on Europe - Market size and forecast 2023-2028 ($ million)
      • Exhibit 64: Data Table on Europe - Market size and forecast 2023-2028 ($ million)
      • Exhibit 65: Chart on Europe - Year-over-year growth 2023-2028 (%)
      • Exhibit 66: Data Table on Europe - Year-over-year growth 2023-2028 (%)
    • 9.4 North America - Market size and forecast 2023-2028
      • Exhibit 67: Chart on North America - Market size and forecast 2023-2028 ($ million)
      • Exhibit 68: Data Table on North America - Market size and forecast 2023-2028 ($ million)
      • Exhibit 69: Chart on North America - Year-over-year growth 2023-2028 (%)
      • Exhibit 70: Data Table on North America - Year-over-year growth 2023-2028 (%)
    • 9.5 APAC - Market size and forecast 2023-2028
      • Exhibit 71: Chart on APAC - Market size and forecast 2023-2028 ($ million)
      • Exhibit 72: Data Table on APAC - Market size and forecast 2023-2028 ($ million)
      • Exhibit 73: Chart on APAC - Year-over-year growth 2023-2028 (%)
      • Exhibit 74: Data Table on APAC - Year-over-year growth 2023-2028 (%)
    • 9.6 South America - Market size and forecast 2023-2028
      • Exhibit 75: Chart on South America - Market size and forecast 2023-2028 ($ million)
      • Exhibit 76: Data Table on South America - Market size and forecast 2023-2028 ($ million)
      • Exhibit 77: Chart on South America - Year-over-year growth 2023-2028 (%)
      • Exhibit 78: Data Table on South America - Year-over-year growth 2023-2028 (%)
    • 9.7 Middle East and Africa - Market size and forecast 2023-2028
      • Exhibit 79: Chart on Middle East and Africa - Market size and forecast 2023-2028 ($ million)
      • Exhibit 80: Data Table on Middle East and Africa - Market size and forecast 2023-2028 ($ million)
      • Exhibit 81: Chart on Middle East and Africa - Year-over-year growth 2023-2028 (%)
      • Exhibit 82: Data Table on Middle East and Africa - Year-over-year growth 2023-2028 (%)
    • 9.8 US - Market size and forecast 2023-2028
      • Exhibit 83: Chart on US - Market size and forecast 2023-2028 ($ million)
      • Exhibit 84: Data Table on US - Market size and forecast 2023-2028 ($ million)
      • Exhibit 85: Chart on US - Year-over-year growth 2023-2028 (%)
      • Exhibit 86: Data Table on US - Year-over-year growth 2023-2028 (%)
    • 9.9 China - Market size and forecast 2023-2028
      • Exhibit 87: Chart on China - Market size and forecast 2023-2028 ($ million)
      • Exhibit 88: Data Table on China - Market size and forecast 2023-2028 ($ million)
      • Exhibit 89: Chart on China - Year-over-year growth 2023-2028 (%)
      • Exhibit 90: Data Table on China - Year-over-year growth 2023-2028 (%)
    • 9.10 Germany - Market size and forecast 2023-2028
      • Exhibit 91: Chart on Germany - Market size and forecast 2023-2028 ($ million)
      • Exhibit 92: Data Table on Germany - Market size and forecast 2023-2028 ($ million)
      • Exhibit 93: Chart on Germany - Year-over-year growth 2023-2028 (%)
      • Exhibit 94: Data Table on Germany - Year-over-year growth 2023-2028 (%)
    • 9.11 Japan - Market size and forecast 2023-2028
      • Exhibit 95: Chart on Japan - Market size and forecast 2023-2028 ($ million)
      • Exhibit 96: Data Table on Japan - Market size and forecast 2023-2028 ($ million)
      • Exhibit 97: Chart on Japan - Year-over-year growth 2023-2028 (%)
      • Exhibit 98: Data Table on Japan - Year-over-year growth 2023-2028 (%)
    • 9.12 France - Market size and forecast 2023-2028
      • Exhibit 99: Chart on France - Market size and forecast 2023-2028 ($ million)
      • Exhibit 100: Data Table on France - Market size and forecast 2023-2028 ($ million)
      • Exhibit 101: Chart on France - Year-over-year growth 2023-2028 (%)
      • Exhibit 102: Data Table on France - Year-over-year growth 2023-2028 (%)
    • 9.13 Market opportunity by geography
      • Exhibit 103: Market opportunity by geography ($ million)
      • Exhibit 104: Data Tables on Market opportunity by geography ($ million)

    10 Drivers, Challenges, and Trends

    • 10.1 Market drivers
      • 10.2 Market challenges
        • 10.3 Impact of drivers and challenges
          • Exhibit 105: Impact of drivers and challenges in 2023 and 2028
        • 10.4 Market trends

          11 Vendor Landscape

          • 11.1 Overview
            • 11.2 Vendor landscape
              • Exhibit 106: Overview on Criticality of inputs and Factors of differentiation
            • 11.3 Landscape disruption
              • Exhibit 107: Overview on factors of disruption
            • 11.4 Industry risks
              • Exhibit 108: Impact of key risks on business

            12 Vendor Analysis

            • 12.1 Vendors covered
              • Exhibit 109: Vendors covered
            • 12.2 Market positioning of vendors
              • Exhibit 110: Matrix on vendor position and classification
            • 12.3 AMOREPACIFIC Group Inc.
              • Exhibit 111: AMOREPACIFIC Group Inc. - Overview
              • Exhibit 112: AMOREPACIFIC Group Inc. - Business segments
              • Exhibit 113: AMOREPACIFIC Group Inc. - Key news
              • Exhibit 114: AMOREPACIFIC Group Inc. - Key offerings
              • Exhibit 115: AMOREPACIFIC Group Inc. - Segment focus
            • 12.4 Beiersdorf AG
              • Exhibit 116: Beiersdorf AG - Overview
              • Exhibit 117: Beiersdorf AG - Business segments
              • Exhibit 118: Beiersdorf AG - Key news
              • Exhibit 119: Beiersdorf AG - Key offerings
              • Exhibit 120: Beiersdorf AG - Segment focus
            • 12.5 Clarins USA Inc.
              • Exhibit 121: Clarins USA Inc. - Overview
              • Exhibit 122: Clarins USA Inc. - Product / Service
              • Exhibit 123: Clarins USA Inc. - Key offerings
            • 12.6 Galderma SA
              • Exhibit 124: Galderma SA - Overview
              • Exhibit 125: Galderma SA - Product / Service
              • Exhibit 126: Galderma SA - Key news
              • Exhibit 127: Galderma SA - Key offerings
            • 12.7 Johnson and Johnson
              • Exhibit 128: Johnson and Johnson - Overview
              • Exhibit 129: Johnson and Johnson - Business segments
              • Exhibit 130: Johnson and Johnson - Key news
              • Exhibit 131: Johnson and Johnson - Key offerings
              • Exhibit 132: Johnson and Johnson - Segment focus
            • 12.8 Kao Corp.
              • Exhibit 133: Kao Corp. - Overview
              • Exhibit 134: Kao Corp. - Business segments
              • Exhibit 135: Kao Corp. - Key offerings
              • Exhibit 136: Kao Corp. - Segment focus
            • 12.9 KOSE Corp.
              • Exhibit 137: KOSE Corp. - Overview
              • Exhibit 138: KOSE Corp. - Product / Service
              • Exhibit 139: KOSE Corp. - Key offerings
            • 12.10 LOreal SA
              • Exhibit 140: LOreal SA - Overview
              • Exhibit 141: LOreal SA - Business segments
              • Exhibit 142: LOreal SA - Key news
              • Exhibit 143: LOreal SA - Key offerings
              • Exhibit 144: LOreal SA - Segment focus
            • 12.11 Natura and Co Holding SA
              • Exhibit 145: Natura and Co Holding SA - Overview
              • Exhibit 146: Natura and Co Holding SA - Business segments
              • Exhibit 147: Natura and Co Holding SA - Key offerings
              • Exhibit 148: Natura and Co Holding SA - Segment focus
            • 12.12 Nutricare Holding Pty Ltd
              • Exhibit 149: Nutricare Holding Pty Ltd - Overview
              • Exhibit 150: Nutricare Holding Pty Ltd - Key offerings
            • 12.13 Shiseido Co. Ltd.
              • Exhibit 151: Shiseido Co. Ltd. - Overview
              • Exhibit 152: Shiseido Co. Ltd. - Product / Service
              • Exhibit 153: Shiseido Co. Ltd. - Key offerings
            • 12.14 Skeyndor S.L.U
              • Exhibit 154: Skeyndor S.L.U - Overview
              • Exhibit 155: Skeyndor S.L.U - Product / Service
              • Exhibit 156: Skeyndor S.L.U - Key offerings
            • 12.15 The Estee Lauder Companies
              • Exhibit 157: The Estee Lauder Companies - Overview
              • Exhibit 158: The Estee Lauder Companies - Product / Service
              • Exhibit 159: The Estee Lauder Companies - Key offerings
            • 12.16 The Procter and Gamble Co.
              • Exhibit 160: The Procter and Gamble Co. - Overview
              • Exhibit 161: The Procter and Gamble Co. - Business segments
              • Exhibit 162: The Procter and Gamble Co. - Key news
              • Exhibit 163: The Procter and Gamble Co. - Key offerings
              • Exhibit 164: The Procter and Gamble Co. - Segment focus
            • 12.17 Unilever PLC
              • Exhibit 165: Unilever PLC - Overview
              • Exhibit 166: Unilever PLC - Business segments
              • Exhibit 167: Unilever PLC - Key news
              • Exhibit 168: Unilever PLC - Key offerings
              • Exhibit 169: Unilever PLC - Segment focus

            13 Appendix

            • 13.1 Scope of the report
              • 13.2 Inclusions and exclusions checklist
                • Exhibit 170: Inclusions checklist
                • Exhibit 171: Exclusions checklist
              • 13.3 Currency conversion rates for US$
                • Exhibit 172: Currency conversion rates for US$
              • 13.4 Research methodology
                • Exhibit 173: Research methodology
                • Exhibit 174: Validation techniques employed for market sizing
                • Exhibit 175: Information sources
              • 13.5 List of abbreviations
                • Exhibit 176: List of abbreviations

              Research Methodology

              Technavio presents a detailed picture of the market by way of study, synthesis, and summation of data from multiple sources. The analysts have presented the various facets of the market with a particular focus on identifying the key industry influencers. The data thus presented is comprehensive, reliable, and the result of extensive research, both primary and secondary.

              INFORMATION SOURCES

              Primary sources

              • Manufacturers and suppliers
              • Channel partners
              • Industry experts
              • Strategic decision makers

              Secondary sources

              • Industry journals and periodicals
              • Government data
              • Financial reports of key industry players
              • Historical data
              • Press releases

              DATA ANALYSIS

              Data Synthesis

              • Collation of data
              • Estimation of key figures
              • Analysis of derived insights

              Data Validation

              • Triangulation with data models
              • Reference against proprietary databases
              • Corroboration with industry experts

              REPORT WRITING

              Qualitative

              • Market drivers
              • Market challenges
              • Market trends
              • Five forces analysis

              Quantitative

              • Market size and forecast
              • Market segmentation
              • Geographical insights
              • Competitive landscape

              Interested in this report?

              Get your sample now to see our research methodology and insights!

              Download Now

              Frequently Asked Questions

              Skin Care Emulsion market growth will increase by $ 261.18 mn during 2024-2028.

              The Skin Care Emulsion market is expected to grow at a CAGR of 7.29% during 2024-2028.

              Skin Care Emulsion market is segmented by Distribution Channel( Offline, Online) Product Type( Lotion, Skin cream)

              Aloisia Beauty, AMOREPACIFIC Group Inc., Ayouthveda, Beiersdorf AG, Canadian Glacial Clay Cosmetics Corp., Clarins USA Inc., Daily life Forever52, Galderma SA, Johnson and Johnson, Kao Corp., KOSE Corp., LOreal SA, Natura and Co Holding SA, Nutricare Holding Pty Ltd, Pechoin Inc., Shiseido Co. Ltd., Skeyndor S.L.U, The Estee Lauder Companies, The Procter and Gamble Co., Unilever PLC are a few of the key vendors in the Skin Care Emulsion market.

              Europe will register the highest growth rate of 33% among the other regions. Therefore, the Skin Care Emulsion market in Europe is expected to garner significant business opportunities for the vendors during the forecast period.

              US, China, Japan, Germany, France

              • Increasing online availability of skin care emulsionsIncreasing internet penetration is leading to a rise in awareness about the online purchasing of skin care products such as skin care emulsions. Sales through online channels are gradually penetrating is the driving factor this market.
              • as products such as skin care emulsions are sold online to meet the increasing needs of consumers. Skin care emulsion product companies are increasingly adopting online platforms for selling their products in different regions. Such platforms also help customers save time is the driving factor this market.
              • as they reduce the need to visit a retail store while enabling companies to connect directly with customers. For instance is the driving factor this market.
              • key players such as LOreal SA e-commerce sales increased by 8.9% in 2022 as compared to 2021.   Skin care emulsions are also sold through third-party distributors such as Walgreens is the driving factor this market.
              • Amazon is the driving factor this market.
              • and eBay. Such portals offer a wide range of products to reach places and regions that lack suppliers and distributors. The increasing online presence of skin care emulsions is further leading to more companies selling their products online. Thus is the driving factor this market.
              • the increase in the number of digital portals offering skin care emulsion helps consumers around the world to purchase products with ease after comparing prices and product features. This is the driving factor this market.
              • in turn is the driving factor this market.
              • is expected to drive the growth of the global skin care emulsion market during the forecast period. is the driving factor this market.

              The Skin Care Emulsion market vendors should focus on grabbing business opportunities from the Offline segment as it accounted for the largest market share in the base year.