
Smart Advisor Market Size 2024-2028
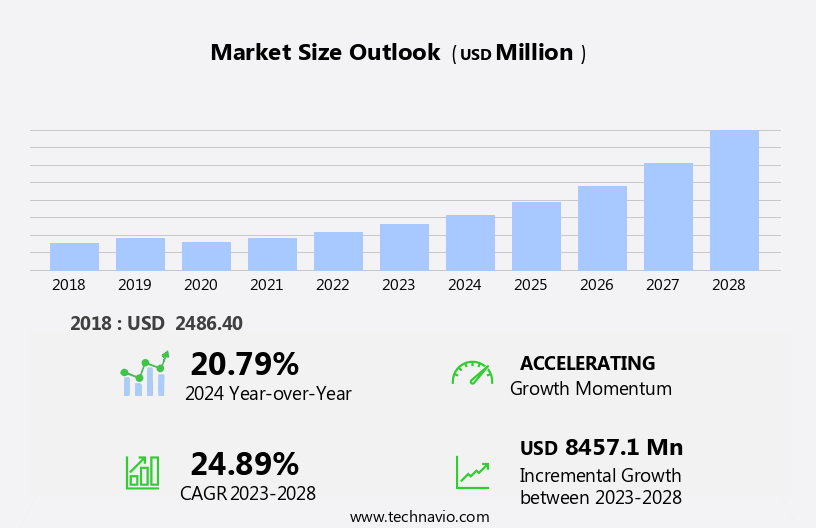
The smart advisor market size is forecast to increase by USD 8.46 billion at a CAGR of 24.89% between 2023 and 2028.
What will be the Size of the Smart Advisor Market During the Forecast Period?
How is this Smart Advisor Industry segmented and which is the largest segment?
The smart advisor industry research report provides comprehensive data (region-wise segment analysis), with forecasts and estimates in "USD million" for the period 2024-2028, as well as historical data from 2018-2022 for the following segments.
- Type
- Software
- Services
- Geography
- North America
- Canada
- US
- APAC
- China
- Europe
- Germany
- UK
- South America
- Middle East and Africa
- North America
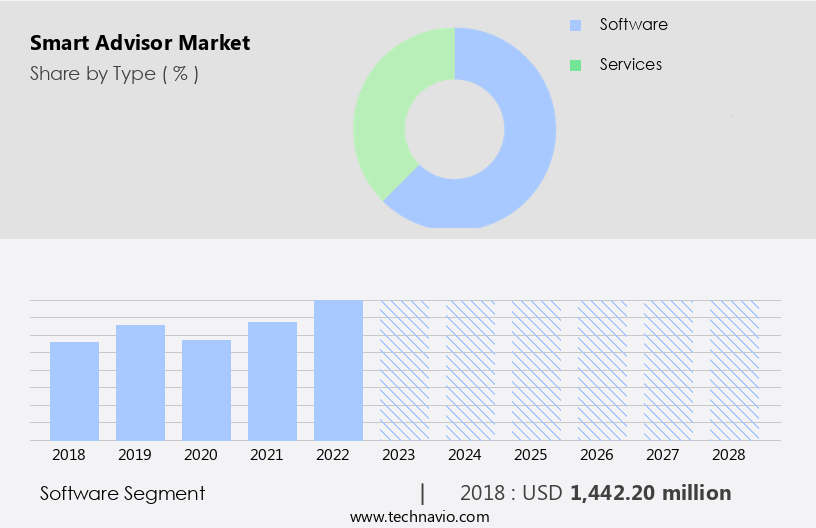
By Type Insights
- The software segment is estimated to witness significant growth during the forecast period.
The market is primarily driven by the software segment, which accounted for the largest market share in 2023. This segment's growth can be attributed to the increasing adoption of smart advisor solutions across various industries, including finance and healthcare. In the financial sector, robo-advisors and passive investing platforms are gaining popularity, offering personalized investment planning and budgeting guidance to individuals. In healthcare, conversational AI and intelligent document processors are being used to enhance patient care and streamline administrative processes. Business intelligence companies are also integrating AI/ML technologies to provide real-time insights and improve decision-making. The healthcare sector's growing use of virtual financial counselors and chatbots for financial education and literacy is further fueling the market's growth.
companies are continuously innovating to meet the evolving needs of customers, with offerings ranging from CRM systems and machine learning algorithms to voice assistants and ESG investing tools. Data security and user trust remain critical factors as the market continues to expand, with legacy systems being gradually replaced by more advanced, digital financial services.
Get a glance at the Smart Advisor Industry report of share of various segments Request Free Sample
The Software segment was valued at USD 1.44 billion in 2018 and showed a gradual increase during the forecast period.
Regional Analysis
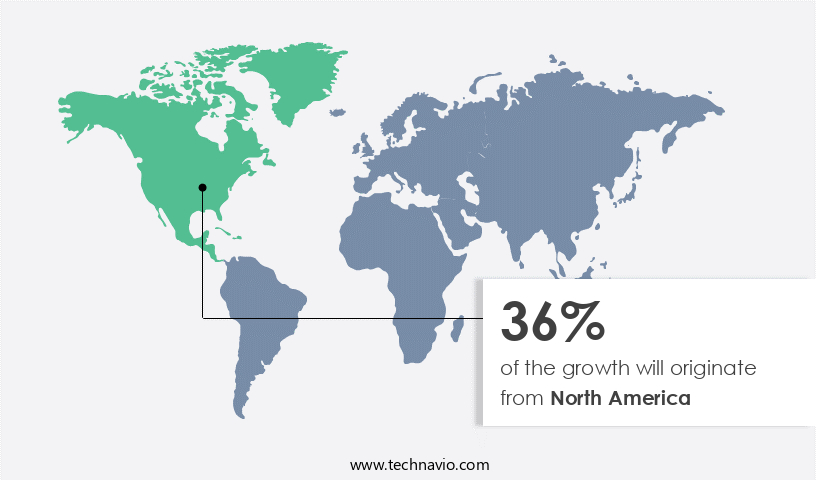
- North America is estimated to contribute 36% to the growth of the global market during the forecast period.
Technavio’s analysts have elaborately explained the regional trends and drivers that shape the market during the forecast period.
For more insights on the market share of various regions, Request Free Sample
The North American market leads the global smart advisor industry due to the increasing adoption of financial technology (fintech) companies and their innovative offerings, such as conversational AI, In the banking and retail sectors. This trend is driven by the integration of AI/ML technologies, including intelligent document processors and chatbots, in financial services. The shift towards passive investing and robo-advisory services, as well as the growing importance of financial education and literacy, particularly among millennials, further fuels market growth. Business intelligence companies and real estate firms are also adopting smart advisors for data-driven decision-making and improved customer experience. The integration of ESG factors and voice assistants in financial advice platforms adds to the market's potential.
Despite the advancements, data security and user trust remain critical concerns, necessitating robust solutions. Technological innovations, including CRM systems and machine learning algorithms, are addressing these challenges, ensuring the continued growth of the market in North America.
Market Dynamics
Our researchers analyzed the data with 2023 as the base year, along with the key drivers, trends, and challenges. A holistic analysis of drivers will help companies refine their marketing strategies to gain a competitive advantage.
What are the key market drivers leading to the rise In the adoption of Smart Advisor Industry?
Rising number of high-net-worth individuals (HNWIs) globally is the key driver of the market.
What are the market trends shaping the Smart Advisor Industry?
Adoption of technological advancements is the upcoming market trend.
What challenges does the Smart Advisor Industry face during its growth?
Growth of fintech companies is a key challenge affecting the industry growth.
Exclusive Customer Landscape
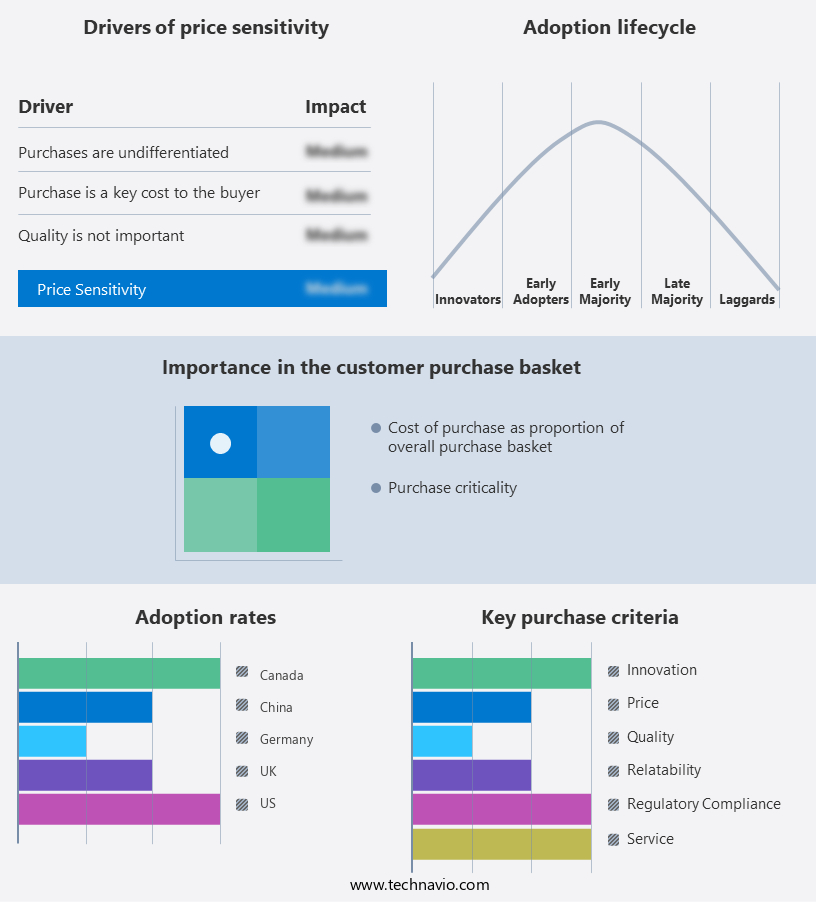
The smart advisor market forecasting report includes the adoption lifecycle of the market, covering from the innovator’s stage to the laggard’s stage. It focuses on adoption rates in different regions based on penetration. Furthermore, the smart advisor market report also includes key purchase criteria and drivers of price sensitivity to help companies evaluate and develop their market growth analysis strategies.
Customer Landscape
Key Companies & Market Insights
Companies are implementing various strategies, such as strategic alliances, smart advisor market forecast, partnerships, mergers and acquisitions, geographical expansion, and product/service launches, to enhance their presence In the industry.
Ally Financial Inc. - The company delivers a smart advisor solution designed for financial advisors, enhancing their ability to provide personalized investment recommendations and financial planning services to clients through advanced technology and data analysis. This innovative approach enables advisors to streamline their processes, improve client engagement, and make informed decisions based on real-time market data and trends. By leveraging the power of machine learning and artificial intelligence, the smart advisor system offers actionable insights and customized strategies tailored to each client's unique financial situation and goals. With a user-friendly interface and seamless integration into existing workflows, this solution empowers advisors to deliver superior value and service to their clients while staying competitive In the ever-evolving financial services industry.
The industry research and growth report includes detailed analyses of the competitive landscape of the market and information about key companies, including:
- Ally Financial Inc.
- Alphabet Inc.
- Apple Inc.
- Artificial Solutions International AB
- Broadridge Financial Solutions Inc.
- CodeBaby LLC
- eGain Corp.
- Hexagon AB
- Insider Biz
- International Business Machines Corp.
- Microsoft Corp.
- Oracle Corp.
- SmartAsset Advisors LLC
- Verint Systems Inc.
Qualitative and quantitative analysis of companies has been conducted to help clients understand the wider business environment as well as the strengths and weaknesses of key industry players. Data is qualitatively analyzed to categorize companies as pure play, category-focused, industry-focused, and diversified; it is quantitatively analyzed to categorize companies as dominant, leading, strong, tentative, and weak.
Research Analyst Overview
The market represents a significant shift In the financial services industry, as technology continues to transform the way individuals and businesses manage their financial affairs. This market encompasses a range of innovative solutions, including conversational AI, business intelligence, and machine learning applications, designed to provide personalized financial advice and guidance. One key area of growth In the market is the integration of AI and ML technologies into financial counseling services. These technologies enable more efficient data analysis, allowing for individualized investment recommendations and budgeting plans. Additionally, natural language processing capabilities enable more effective communication between clients and advisors, enhancing the overall user experience.
Another trend In the market is the increasing adoption of smart advisors in various sectors, such as healthcare and real estate. In healthcare, these solutions can help patients manage their medical expenses and plan for future healthcare costs. In real estate, smart advisors can assist in property management and investment decisions. The use of chatbots and voice assistants is also becoming increasingly common In the market. These tools provide a more convenient and accessible way for users to access financial advice and guidance, particularly among the millennial demographic. However, the implementation of smart advisors also presents challenges, particularly in terms of data security and user trust.
Legacy systems and CRM platforms must be updated to accommodate these new technologies, and companies must ensure that user data is protected. Moreover, the integration of ESG (Environmental, Social, and Governance) considerations into smart advisor platforms is becoming increasingly important. This trend reflects a growing awareness of the importance of sustainability and social responsibility in financial decision-making. Despite these challenges, The market is expected to continue growing at a robust pace. The increasing popularity of digital financial services, passive investing, and robo-advisory services is driving demand for more advanced and personalized financial advice and guidance. In conclusion, the market represents a significant opportunity for fintech companies and financial institutions to provide more efficient, personalized, and accessible financial advice and guidance to individuals and businesses.
However, the implementation of these solutions also presents challenges, particularly in terms of data security, user trust, and legacy systems. Companies that can effectively address these challenges and provide innovative and effective smart advisor solutions will be well-positioned to succeed in this dynamic and growing market.
|
Market Scope |
|
|
Report Coverage |
Details |
|
Page number |
151 |
|
Base year |
2023 |
|
Historic period |
2018-2022 |
|
Forecast period |
2024-2028 |
|
Growth momentum & CAGR |
Accelerate at a CAGR of 24.89% |
|
Market growth 2024-2028 |
USD 8457.1 million |
|
Market structure |
Concentrated |
|
YoY growth 2023-2024(%) |
20.79 |
|
Key countries |
US, China, UK, Canada, and Germany |
|
Competitive landscape |
Leading Companies, Market Positioning of Companies, Competitive Strategies, and Industry Risks |
What are the Key Data Covered in this Smart Advisor Market Research and Growth Report?
- CAGR of the Smart Advisor industry during the forecast period
- Detailed information on factors that will drive the growth and forecasting between 2024 and 2028
- Precise estimation of the size of the market and its contribution of the industry in focus to the parent market
- Accurate predictions about upcoming growth and trends and changes in consumer behaviour
- Growth of the market across North America, APAC, Europe, South America, and Middle East and Africa
- Thorough analysis of the market’s competitive landscape and detailed information about companies
- Comprehensive analysis of factors that will challenge the smart advisor market growth of industry companies
We can help! Our analysts can customize this smart advisor market research report to meet your requirements.
 RIA -
RIA - 
