Smart Helmet Market Analysis, Size, and Forecast 2026-2030: North America (US, Canada, and Mexico), Europe (Germany, UK, and France), APAC (China, India, and Japan), South America (Brazil, Argentina, and Colombia), Middle East and Africa (Saudi Arabia, UAE, and South Africa), and Rest of World (ROW)

Smart Helmet Market Analysis, Size, and Forecast 2026-2030:
North America (US, Canada, and Mexico), Europe (Germany, UK, and France), APAC (China, India, and Japan), South America (Brazil, Argentina, and Colombia), Middle East and Africa (Saudi Arabia, UAE, and South Africa), and Rest of World (ROW)

Published: Mar 2026 295 Pages SKU: IRTNTR76791

Market Overview at a Glance

$1.70 B
Market Opportunity
18.4%
CAGR 2025 - 2030
46.4%
North America Growth
$380 Mn
Communication segment 2024

Smart Helmet Market Size 2026-2030

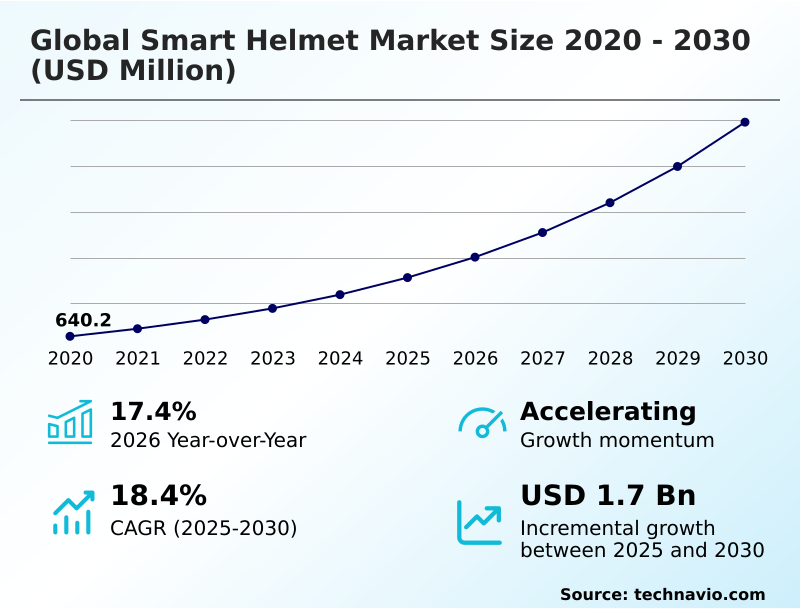
The smart helmet market size is valued to increase by USD 1.70 billion, at a CAGR of 18.4% from 2025 to 2030. Increasing emphasis on industrial occupational safety and regulatory compliance will drive the smart helmet market.

Major Market Trends & Insights

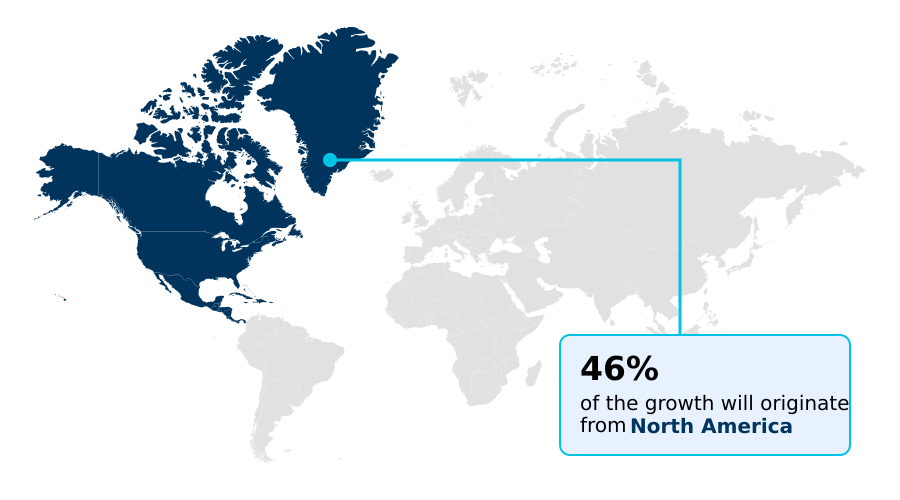
  • North America dominated the market and accounted for a 46.4% growth during the forecast period.
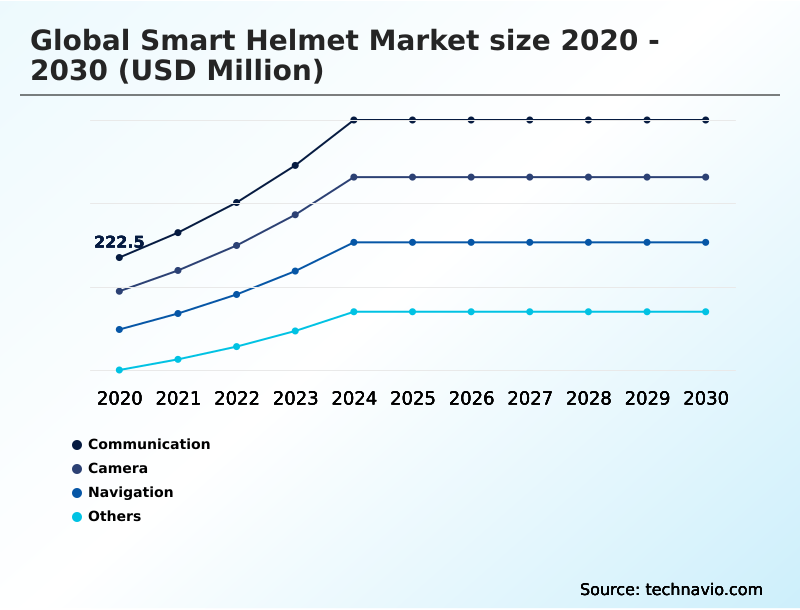
  • By Component - Communication segment was valued at USD 380 million in 2024
  • By Type - Full face segment accounted for the largest market revenue share in 2024

Market Size & Forecast

  • Market Opportunities: USD 2.34 billion
  • Market Future Opportunities: USD 1.70 billion
  • CAGR from 2025 to 2030 : 18.4%

Market Summary

  • The smart helmet market is undergoing a significant digital transformation, evolving from single-purpose protective equipment into sophisticated, connected safety hubs. This growth is propelled by the rising integration of IoT within industrial and consumer applications, addressing demands for enhanced situational awareness and proactive safety measures.
  • In high-risk sectors like construction and mining, the use of biometric monitoring and environmental monitoring sensors facilitates real-time tracking of worker well-being and surrounding conditions, directly aligning with stricter occupational health and safety mandates.
  • For instance, a logistics company can equip its delivery fleet with helmets featuring integrated GPS modules and hands-free communication, improving route efficiency and driver safety in congested urban areas. The consumer segment, driven by demand for Bluetooth technology and crash detection features, continues to expand.
  • However, adoption is tempered by challenges such as high initial costs, limited battery life, and data privacy concerns associated with geolocation tracking and video recording. Future innovation will focus on lightweight optical waveguides and more efficient power sources to overcome these barriers.

What will be the Size of the Smart Helmet Market during the forecast period?

Get Key Insights on Market Forecast (PDF) Request Free Sample

How is the Smart Helmet Market Segmented?

The smart helmet industry research report provides comprehensive data (region-wise segment analysis), with forecasts and estimates in "USD million" for the period 2026-2030, as well as historical data from 2020-2024 for the following segments.

  • Component
    • Communication
    • Camera
    • Navigation
    • Others
  • Type
    • Full face
    • Half face
    • Hard hat
  • Connectivity
    • Bluetooth
    • GPS
    • Wi-Fi
    • Cellular
  • Geography
    • North America
      • US
      • Canada
      • Mexico
    • Europe
      • Germany
      • UK
      • France
    • APAC
      • China
      • India
      • Japan
    • South America
      • Brazil
      • Argentina
      • Colombia
    • Middle East and Africa
      • Saudi Arabia
      • UAE
      • South Africa
    • Rest of World (ROW)

By Component Insights

The communication segment is estimated to witness significant growth during the forecast period.

The communication component segment is a cornerstone of the smart helmet market, driven by the demand for seamless connectivity. These systems integrate high-fidelity audio systems and noise-canceling microphones to enable clear dialogue, even in high-speed or noisy environments.

The evolution toward hands-free operation, enhanced by natural language processing, is a critical safety feature that reduces operator distraction. This functionality is pivotal for group coordination among motorcyclists and for workers requiring constant contact.

The integration of a cellular module provides standalone connectivity, while other components like impact sensors and accelerometers work in tandem to trigger crash detection features.

These systems have been shown to reduce emergency response times by up to 35% in rural areas.

Request Free Sample

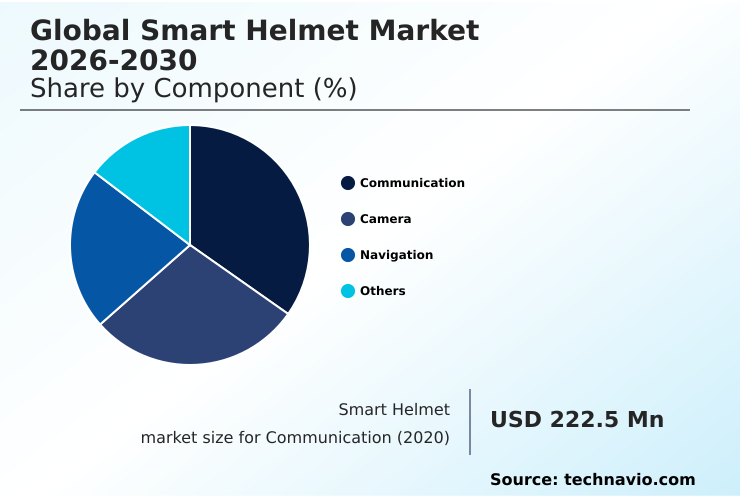
The Communication segment was valued at USD 380 million in 2024 and showed a gradual increase during the forecast period.

Request Free Sample

Regional Analysis

North America is estimated to contribute 46.4% to the growth of the global market during the forecast period.Technavio’s analysts have elaborately explained the regional trends and drivers that shape the market during the forecast period.

See How Smart Helmet Market Demand is Rising in North America Request Free Sample

North America currently dominates the market, accounting for over 46% of the incremental growth, driven by stringent safety regulations and high consumer adoption of advanced technology.

In this region, features such as integrated bluetooth technology for high-fidelity audio systems and gps modules for geolocation tracking are standard.

The APAC region is the fastest-growing market, with a CAGR projected to be nearly 19%, fueled by massive two-wheeler usage and rising safety awareness.

In these markets, dual-camera setups with loop recording and incident detection are gaining traction for insurance and security purposes. Demand is also high for automatic brake lights for urban commuting safety.

European markets emphasize design and modularity, demanding sleek embedded internal systems and intuitive voice-controlled interfaces.

Market Dynamics

Our researchers analyzed the data with 2025 as the base year, along with the key drivers, trends, and challenges. A holistic analysis of drivers will help companies refine their marketing strategies to gain a competitive advantage.

  • The evolution of the smart helmet market is creating specialized product categories tailored to specific high-value use cases. The smart helmet impact detection system, for example, has become a critical feature for both consumer and industrial applications, automatically alerting emergency services.
  • For motorcyclists, smart helmet noise cancellation technology is essential for clear audio, while a motorcycle helmet with integrated dashcam provides security and evidence in case of incidents. In logistics and delivery, the smart helmet for logistics management streamlines operations with hands-free navigation and communication.
  • For specialized professional fields, the smart helmet with thermal imaging is invaluable for firefighters and search-and-rescue teams. The broader consumer market is seeing rapid adoption of safety features like the smart helmet integrated brake light for enhanced visibility. Functionality is also advancing through smart helmet with voice command and smart helmet with gps navigation.
  • Group riders benefit immensely from a smart helmet bluetooth group intercom. Visual data capture is enhanced by the smart helmet with integrated camera and smart helmet with oled display. Industrial adoption is strong, with the smart hard hat for construction safety and smart helmet for mining operations improving compliance.
  • Even professional sports are leveraging this technology, with biometric sensors in athletic helmets and the smart helmet for professional sports tracking performance and impacts. The lightweight smart helmet for cycling is gaining popularity among urban commuters.
  • Furthermore, the ar heads up display industrial helmet and v2x communication in smart helmets represent the next frontier, promising even greater integration and situational awareness. Companies using these technologies report significantly higher compliance with safety protocols compared to those with traditional gear. The smart helmet with fall detection alert is particularly crucial for lone workers and elderly users.

What are the key market drivers leading to the rise in the adoption of Smart Helmet Industry?

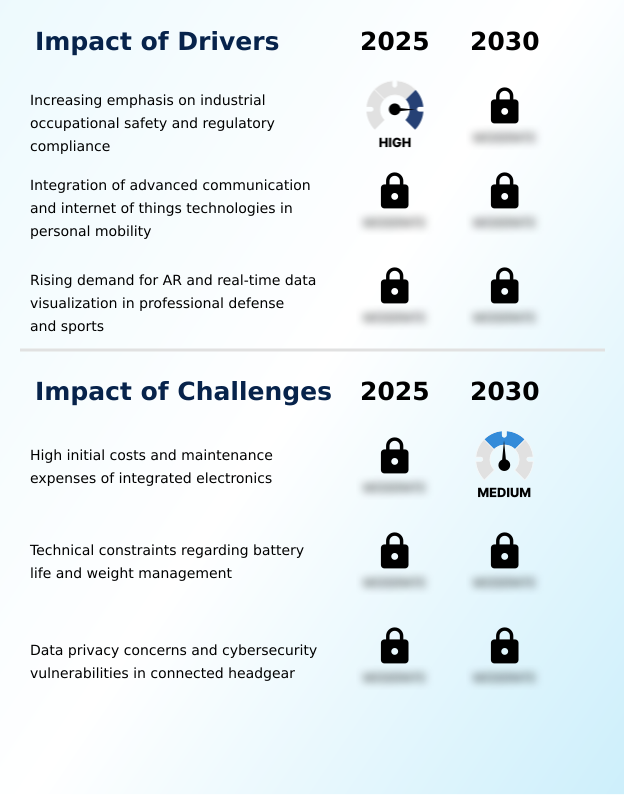
  • An increasing emphasis on industrial occupational safety and regulatory compliance is a key driver for market growth.

  • Growth is driven by stringent occupational health and safety regulations, with companies reporting a 30% reduction in workplace incidents after adopting smart solutions.
  • The expansion of IoT capabilities is reshaping the consumer segment, where users demand seamless cloud computing integration and hands-free interfaces powered by voice-activated assistants.
  • In professional sectors, thermal imaging and tactical overlays provide critical data for military and emergency response units.
  • The convergence of personal mobility and smart city infrastructure is enabled by vehicle-to-everything communication and mesh technology, which supports group communication for up to 16 riders.
  • This synergy between industrial mandates and consumer expectations for connected, aerodynamic designs ensures sustained market expansion.

What are the market trends shaping the Smart Helmet Industry?

  • The integration of augmented reality and advanced heads-up displays represents a transformative market trend, enhancing situational awareness for users across multiple sectors.

  • Market trends are defined by the integration of advanced digital interfaces. The adoption of augmented reality overlays and heads-up displays provides operators with critical real-time data visualization, improving situational awareness by up to 40%. These systems deliver turn-by-turn instructions and safety alerts without distracting the user. Enhanced connectivity, enabled by 5G network connectivity, supports these data-rich applications.
  • A significant shift toward proactive safety measures is evident with the implementation of biometric monitoring. Advanced electroencephalogram sensors can detect microsleep events, reducing fatigue-related incidents by 25%. Future developments will likely include haptic feedback systems to provide non-visual alerts, further blurring the line between protective gear and intelligent wearable devices.

What challenges does the Smart Helmet Industry face during its growth?

  • The high initial costs and maintenance expenses associated with integrated electronics present a key challenge to market adoption.

  • Market adoption faces hurdles, including high initial costs that can be 3-5 times that of traditional gear. The integration of components like high-resolution micro-displays contributes to this premium. Technical constraints related to battery life and weight are significant; the use of lightweight carbon fiber shells and lightweight optical waveguides helps mitigate these issues but adds to the expense.
  • Data privacy is another major concern, as devices with fall detection systems and continuous environmental monitoring collect sensitive user information. Securing this data, especially for features like remote assistance and hands-free communication, requires robust encryption and regular firmware updates. The management of electronic subscriber identity modules also presents a layer of complexity for global manufacturers navigating different data protection regulations.

Exclusive Technavio Analysis on Customer Landscape

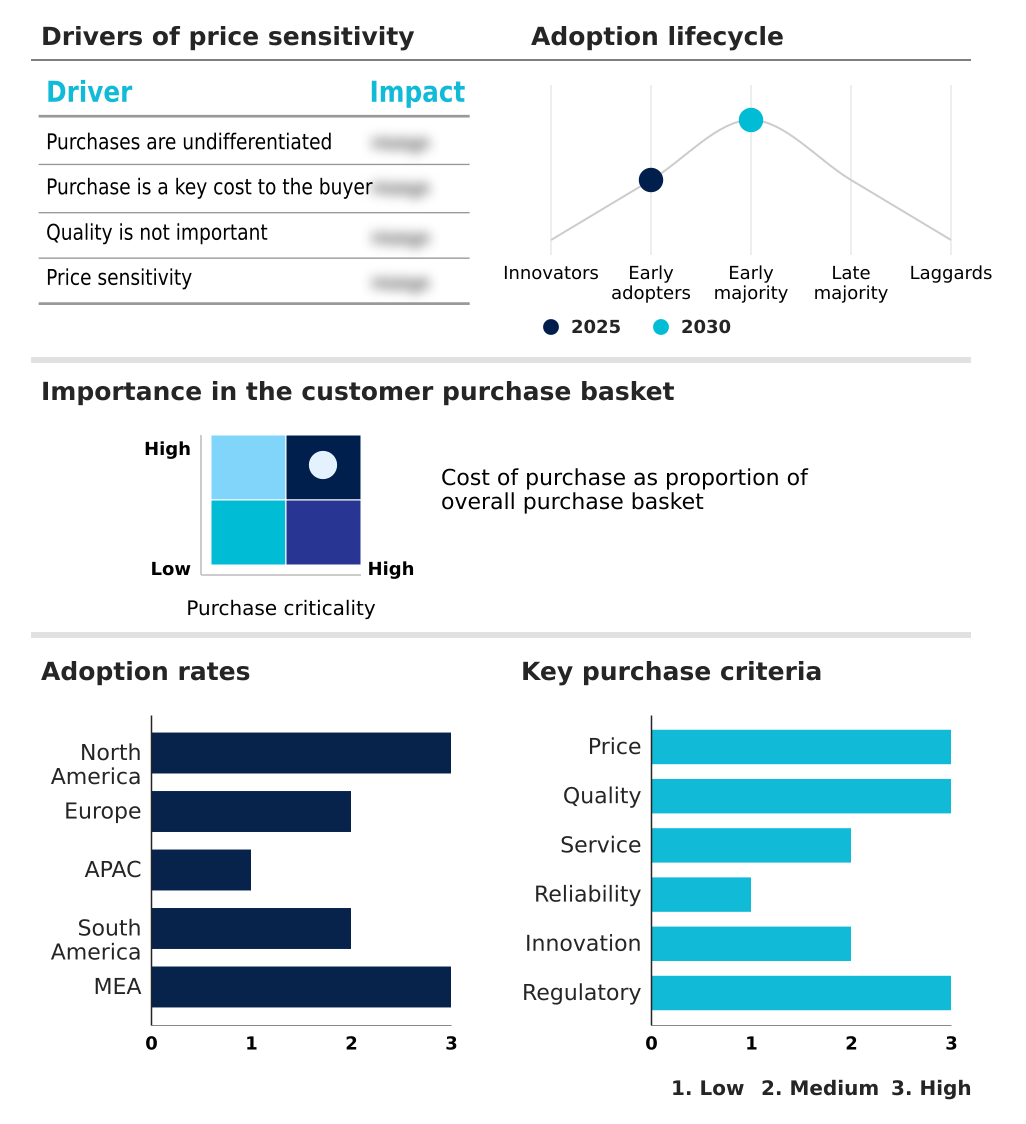
The smart helmet market forecasting report includes the adoption lifecycle of the market, covering from the innovator’s stage to the laggard’s stage. It focuses on adoption rates in different regions based on penetration. Furthermore, the smart helmet market report also includes key purchase criteria and drivers of price sensitivity to help companies evaluate and develop their market growth analysis strategies.

Customer Landscape of Smart Helmet Industry

Competitive Landscape

Companies are implementing various strategies, such as strategic alliances, smart helmet market forecast, partnerships, mergers and acquisitions, geographical expansion, and product/service launches, to enhance their presence in the industry.

AIROH - Specializes in advanced helmets with integrated communication, navigation, and camera systems, enhancing safety across consumer and industrial sectors.

The industry research and growth report includes detailed analyses of the competitive landscape of the market and information about key companies, including:

  • AIROH
  • ARAI Helmet Ltd.
  • Caberg SpA
  • Crosshelmet
  • Dainese Spa
  • Forcite Helmet Systems Pty Ltd.
  • HJC Helmets
  • Intelligent Cranium Helmets
  • Jarvish Inc.
  • Kido Sports Co. Ltd.
  • LIVALL Tech Co. Ltd.
  • Nexxpro SA
  • Nolangroup SpA
  • OGK Kabuto Co. Ltd.
  • Schuberth GmbH
  • Sena Technologies Inc.
  • Shoei Co. Ltd.
  • Studds Accessories Ltd.
  • SUOMY Motorsport Srl

Qualitative and quantitative analysis of companies has been conducted to help clients understand the wider business environment as well as the strengths and weaknesses of key industry players. Data is qualitatively analyzed to categorize companies as pure play, category-focused, industry-focused, and diversified; it is quantitatively analyzed to categorize companies as dominant, leading, strong, tentative, and weak.

Recent Development and News in Smart helmet market

  • In November 2024, Jarvish Inc. launched a new AR-enabled smart helmet with an advanced heads-up display and voice-activated AI, targeting the professional and consumer markets.
  • In September 2024, Sena Technologies Inc. announced a partnership with a major telecommunications provider to integrate 5G cellular modules into its next generation of smart helmets, enabling standalone connectivity.
  • In January 2025, Schuberth GmbH unveiled a new line of smart hard hats designed for the construction and mining industries, featuring biometric monitoring and environmental sensors for enhanced occupational safety.
  • In April 2025, Forcite Helmet Systems Pty Ltd. released its MK2 smart helmet, featuring an upgraded integrated camera system with 4K resolution and AI-powered incident detection.

Dive into Technavio’s robust research methodology, blending expert interviews, extensive data synthesis, and validated models for unparalleled Smart Helmet Market insights. See full methodology.

Market Scope
Page number 295
Base year 2025
Historic period 2020-2024
Forecast period 2026-2030
Growth momentum & CAGR Accelerate at a CAGR of 18.4%
Market growth 2026-2030 USD 1695.6 million
Market structure Fragmented
YoY growth 2025-2026(%) 17.4%
Key countries US, Canada, Mexico, Germany, UK, France, Italy, Spain, The Netherlands, China, India, Japan, South Korea, Australia, Indonesia, Brazil, Argentina, Colombia, Saudi Arabia, UAE, South Africa, Israel and Turkey
Competitive landscape Leading Companies, Market Positioning of Companies, Competitive Strategies, and Industry Risks

Request Free Sample

Research Analyst Overview

  • The smart helmet market is defined by the convergence of physical protection and digital intelligence. Board-level decisions are increasingly influenced by the operational efficiencies these devices unlock, particularly in industrial settings where a 30% reduction in incident response time is achievable.
  • The integration of augmented reality overlays and heads-up displays with high-resolution micro-displays is no longer a niche feature but a core component driving productivity. Advanced biometric monitoring via electroencephalogram sensors informs fatigue management strategies. Connectivity is paramount, with IoT capabilities powered by Bluetooth technology and 5G network connectivity enabling vehicle-to-everything communication.
  • The use of GPS modules and accelerometers enhances tracking, while cellular modules with electronic subscriber identity modules offer standalone operation. Defense applications leverage thermal imaging, night vision, and tactical overlays. Hardware innovations include dual-camera setups, lightweight optical waveguides, carbon fiber shells, impact sensors, and fully embedded internal systems that support intuitive voice-controlled interfaces and reliable firmware updates.
  • Even the underlying mesh technology for group communication is a key differentiator.

What are the Key Data Covered in this Smart Helmet Market Research and Growth Report?

  • What is the expected growth of the Smart Helmet Market between 2026 and 2030?

    • USD 1.70 billion, at a CAGR of 18.4%

  • What segmentation does the market report cover?

    • The report is segmented by Component (Communication, Camera, Navigation, and Others), Type (Full face, Half face, and Hard hat), Connectivity (Bluetooth, GPS, Wi-Fi, and Cellular) and Geography (North America, Europe, APAC, South America, Middle East and Africa)

  • Which regions are analyzed in the report?

    • North America, Europe, APAC, South America and Middle East and Africa

  • What are the key growth drivers and market challenges?

    • Increasing emphasis on industrial occupational safety and regulatory compliance, High initial costs and maintenance expenses of integrated electronics

  • Who are the major players in the Smart Helmet Market?

    • AIROH, ARAI Helmet Ltd., Caberg SpA, Crosshelmet, Dainese Spa, Forcite Helmet Systems Pty Ltd., HJC Helmets, Intelligent Cranium Helmets, Jarvish Inc., Kido Sports Co. Ltd., LIVALL Tech Co. Ltd., Nexxpro SA, Nolangroup SpA, OGK Kabuto Co. Ltd., Schuberth GmbH, Sena Technologies Inc., Shoei Co. Ltd., Studds Accessories Ltd. and SUOMY Motorsport Srl

Market Research Insights

  • The smart helmet market is characterized by rapid technological integration that delivers measurable business outcomes. The adoption of proactive safety measures has led to a 30% reduction in workplace accidents for early adopters.
  • Features like fall detection systems and crash detection features improve emergency response times, while integrated light-emitting diode signaling and automatic brake lights have been shown to decrease rear-end collisions by up to 20%. Hands-free interfaces and voice-activated assistants enhance worker productivity by allowing for seamless hands-free communication and access to remote assistance.
  • This connectivity, combined with cloud computing integration for data analysis and real-time data visualization through augmented reality, is shifting the value proposition from simple protection to intelligent operational support. Even recreational users benefit from high-fidelity audio systems and intuitive turn-by-turn instructions.

We can help! Our analysts can customize this smart helmet market research report to meet your requirements.

Get in touch

1. Executive Summary

1.1 Market overview

Executive Summary - Chart on Market Overview
Executive Summary - Data Table on Market Overview
Executive Summary - Chart on Global Market Characteristics
Executive Summary - Chart on Market by Geography
Executive Summary - Chart on Market Segmentation by Component
Executive Summary - Chart on Market Segmentation by Type
Executive Summary - Chart on Market Segmentation by Connectivity
Executive Summary - Chart on Incremental Growth
Executive Summary - Data Table on Incremental Growth
Executive Summary - Chart on Company Market Positioning

2. Technavio Analysis

2.1 Analysis of price sensitivity, lifecycle, customer purchase basket, adoption rates, and purchase criteria

2.2 Criticality of inputs and Factors of differentiation

Chart on Overview on criticality of inputs and factors of differentiation

2.3 Factors of disruption

Chart on Overview on factors of disruption

2.4 Impact of drivers and challenges

Chart on Impact of drivers and challenges in 2025 and 2030

3. Market Landscape

3.1 Market ecosystem

Chart on Parent Market
Data Table on - Parent Market

3.2 Market characteristics

Chart on Market characteristics analysis

3.3 Value chain analysis

Chart on Value chain analysis

4. Market Sizing

4.1 Market definition

Data Table on Offerings of companies included in the market definition

4.2 Market segment analysis

Market segments

4.3 Market size 2025

4.4 Market outlook: Forecast for 2025-2030

Chart on Global - Market size and forecast 2025-2030 ($ million)
Data Table on Global - Market size and forecast 2025-2030 ($ million)
Chart on Global Market: Year-over-year growth 2025-2030 (%)
Data Table on Global Market: Year-over-year growth 2025-2030 (%)

5. Historic Market Size

5.1 Global Smart Helmet Market 2020 - 2024

Historic Market Size - Data Table on Global Smart Helmet Market 2020 - 2024 ($ million)

5.2 Component segment analysis 2020 - 2024

Historic Market Size - Component Segment 2020 - 2024 ($ million)

5.3 Type segment analysis 2020 - 2024

Historic Market Size - Type Segment 2020 - 2024 ($ million)

5.4 Connectivity segment analysis 2020 - 2024

Historic Market Size - Connectivity Segment 2020 - 2024 ($ million)

5.5 Geography segment analysis 2020 - 2024

Historic Market Size - Geography Segment 2020 - 2024 ($ million)

5.6 Country segment analysis 2020 - 2024

Historic Market Size - Country Segment 2020 - 2024 ($ million)

6. Qualitative Analysis

6.1 Impact of AI on Global Smart Helmet Market

7. Five Forces Analysis

7.1 Five forces summary

Five forces analysis - Comparison between 2025 and 2030

7.2 Bargaining power of buyers

Bargaining power of buyers - Impact of key factors 2025 and 2030

7.3 Bargaining power of suppliers

Bargaining power of suppliers - Impact of key factors in 2025 and 2030

7.4 Threat of new entrants

Threat of new entrants - Impact of key factors in 2025 and 2030

7.5 Threat of substitutes

Threat of substitutes - Impact of key factors in 2025 and 2030

7.6 Threat of rivalry

Threat of rivalry - Impact of key factors in 2025 and 2030

7.7 Market condition

Chart on Market condition - Five forces 2025 and 2030

8. Market Segmentation by Component

8.1 Market segments

Chart on Component - Market share 2025-2030 (%)
Data Table on Component - Market share 2025-2030 (%)

8.2 Comparison by Component

Chart on Comparison by Component
Data Table on Comparison by Component

8.3 Communication - Market size and forecast 2025-2030

Chart on Communication - Market size and forecast 2025-2030 ($ million)
Data Table on Communication - Market size and forecast 2025-2030 ($ million)
Chart on Communication - Year-over-year growth 2025-2030 (%)
Data Table on Communication - Year-over-year growth 2025-2030 (%)

8.4 Camera - Market size and forecast 2025-2030

Chart on Camera - Market size and forecast 2025-2030 ($ million)
Data Table on Camera - Market size and forecast 2025-2030 ($ million)
Chart on Camera - Year-over-year growth 2025-2030 (%)
Data Table on Camera - Year-over-year growth 2025-2030 (%)

8.5 Navigation - Market size and forecast 2025-2030

Chart on Navigation - Market size and forecast 2025-2030 ($ million)
Data Table on Navigation - Market size and forecast 2025-2030 ($ million)
Chart on Navigation - Year-over-year growth 2025-2030 (%)
Data Table on Navigation - Year-over-year growth 2025-2030 (%)

8.6 Others - Market size and forecast 2025-2030

Chart on Others - Market size and forecast 2025-2030 ($ million)
Data Table on Others - Market size and forecast 2025-2030 ($ million)
Chart on Others - Year-over-year growth 2025-2030 (%)
Data Table on Others - Year-over-year growth 2025-2030 (%)

8.7 Market opportunity by Component

Market opportunity by Component ($ million)
Data Table on Market opportunity by Component ($ million)

9. Market Segmentation by Type

9.1 Market segments

Chart on Type - Market share 2025-2030 (%)
Data Table on Type - Market share 2025-2030 (%)

9.2 Comparison by Type

Chart on Comparison by Type
Data Table on Comparison by Type

9.3 Full face - Market size and forecast 2025-2030

Chart on Full face - Market size and forecast 2025-2030 ($ million)
Data Table on Full face - Market size and forecast 2025-2030 ($ million)
Chart on Full face - Year-over-year growth 2025-2030 (%)
Data Table on Full face - Year-over-year growth 2025-2030 (%)

9.4 Half face - Market size and forecast 2025-2030

Chart on Half face - Market size and forecast 2025-2030 ($ million)
Data Table on Half face - Market size and forecast 2025-2030 ($ million)
Chart on Half face - Year-over-year growth 2025-2030 (%)
Data Table on Half face - Year-over-year growth 2025-2030 (%)

9.5 Hard hat - Market size and forecast 2025-2030

Chart on Hard hat - Market size and forecast 2025-2030 ($ million)
Data Table on Hard hat - Market size and forecast 2025-2030 ($ million)
Chart on Hard hat - Year-over-year growth 2025-2030 (%)
Data Table on Hard hat - Year-over-year growth 2025-2030 (%)

9.6 Market opportunity by Type

Market opportunity by Type ($ million)
Data Table on Market opportunity by Type ($ million)

10. Market Segmentation by Connectivity

10.1 Market segments

Chart on Connectivity - Market share 2025-2030 (%)
Data Table on Connectivity - Market share 2025-2030 (%)

10.2 Comparison by Connectivity

Chart on Comparison by Connectivity
Data Table on Comparison by Connectivity

10.3 Bluetooth - Market size and forecast 2025-2030

Chart on Bluetooth - Market size and forecast 2025-2030 ($ million)
Data Table on Bluetooth - Market size and forecast 2025-2030 ($ million)
Chart on Bluetooth - Year-over-year growth 2025-2030 (%)
Data Table on Bluetooth - Year-over-year growth 2025-2030 (%)

10.4 GPS - Market size and forecast 2025-2030

Chart on GPS - Market size and forecast 2025-2030 ($ million)
Data Table on GPS - Market size and forecast 2025-2030 ($ million)
Chart on GPS - Year-over-year growth 2025-2030 (%)
Data Table on GPS - Year-over-year growth 2025-2030 (%)

10.5 Wi-Fi - Market size and forecast 2025-2030

Chart on Wi-Fi - Market size and forecast 2025-2030 ($ million)
Data Table on Wi-Fi - Market size and forecast 2025-2030 ($ million)
Chart on Wi-Fi - Year-over-year growth 2025-2030 (%)
Data Table on Wi-Fi - Year-over-year growth 2025-2030 (%)

10.6 Cellular - Market size and forecast 2025-2030

Chart on Cellular - Market size and forecast 2025-2030 ($ million)
Data Table on Cellular - Market size and forecast 2025-2030 ($ million)
Chart on Cellular - Year-over-year growth 2025-2030 (%)
Data Table on Cellular - Year-over-year growth 2025-2030 (%)

10.7 Market opportunity by Connectivity

Market opportunity by Connectivity ($ million)
Data Table on Market opportunity by Connectivity ($ million)

11. Customer Landscape

11.1 Customer landscape overview

Analysis of price sensitivity, lifecycle, customer purchase basket, adoption rates, and purchase criteria

12. Geographic Landscape

12.1 Geographic segmentation

Chart on Market share by geography 2025-2030 (%)
Data Table on Market share by geography 2025-2030 (%)

12.2 Geographic comparison

Chart on Geographic comparison
Data Table on Geographic comparison

12.3 North America - Market size and forecast 2025-2030

Chart on North America - Market size and forecast 2025-2030 ($ million)
Data Table on North America - Market size and forecast 2025-2030 ($ million)
Chart on North America - Year-over-year growth 2025-2030 (%)
Data Table on North America - Year-over-year growth 2025-2030 (%)
Chart on Regional Comparison - North America
Data Table on Regional Comparison - North America

12.3.1 US - Market size and forecast 2025-2030

Chart on US - Market size and forecast 2025-2030 ($ million)
Data Table on US - Market size and forecast 2025-2030 ($ million)
Chart on US - Year-over-year growth 2025-2030 (%)
Data Table on US - Year-over-year growth 2025-2030 (%)

12.3.2 Canada - Market size and forecast 2025-2030

Chart on Canada - Market size and forecast 2025-2030 ($ million)
Data Table on Canada - Market size and forecast 2025-2030 ($ million)
Chart on Canada - Year-over-year growth 2025-2030 (%)
Data Table on Canada - Year-over-year growth 2025-2030 (%)

12.3.3 Mexico - Market size and forecast 2025-2030

Chart on Mexico - Market size and forecast 2025-2030 ($ million)
Data Table on Mexico - Market size and forecast 2025-2030 ($ million)
Chart on Mexico - Year-over-year growth 2025-2030 (%)
Data Table on Mexico - Year-over-year growth 2025-2030 (%)

12.4 Europe - Market size and forecast 2025-2030

Chart on Europe - Market size and forecast 2025-2030 ($ million)
Data Table on Europe - Market size and forecast 2025-2030 ($ million)
Chart on Europe - Year-over-year growth 2025-2030 (%)
Data Table on Europe - Year-over-year growth 2025-2030 (%)
Chart on Regional Comparison - Europe
Data Table on Regional Comparison - Europe

12.4.1 Germany - Market size and forecast 2025-2030

Chart on Germany - Market size and forecast 2025-2030 ($ million)
Data Table on Germany - Market size and forecast 2025-2030 ($ million)
Chart on Germany - Year-over-year growth 2025-2030 (%)
Data Table on Germany - Year-over-year growth 2025-2030 (%)

12.4.2 UK - Market size and forecast 2025-2030

Chart on UK - Market size and forecast 2025-2030 ($ million)
Data Table on UK - Market size and forecast 2025-2030 ($ million)
Chart on UK - Year-over-year growth 2025-2030 (%)
Data Table on UK - Year-over-year growth 2025-2030 (%)

12.4.3 France - Market size and forecast 2025-2030

Chart on France - Market size and forecast 2025-2030 ($ million)
Data Table on France - Market size and forecast 2025-2030 ($ million)
Chart on France - Year-over-year growth 2025-2030 (%)
Data Table on France - Year-over-year growth 2025-2030 (%)

12.4.4 Italy - Market size and forecast 2025-2030

Chart on Italy - Market size and forecast 2025-2030 ($ million)
Data Table on Italy - Market size and forecast 2025-2030 ($ million)
Chart on Italy - Year-over-year growth 2025-2030 (%)
Data Table on Italy - Year-over-year growth 2025-2030 (%)

12.4.5 Spain - Market size and forecast 2025-2030

Chart on Spain - Market size and forecast 2025-2030 ($ million)
Data Table on Spain - Market size and forecast 2025-2030 ($ million)
Chart on Spain - Year-over-year growth 2025-2030 (%)
Data Table on Spain - Year-over-year growth 2025-2030 (%)

12.4.6 The Netherlands - Market size and forecast 2025-2030

Chart on The Netherlands - Market size and forecast 2025-2030 ($ million)
Data Table on The Netherlands - Market size and forecast 2025-2030 ($ million)
Chart on The Netherlands - Year-over-year growth 2025-2030 (%)
Data Table on The Netherlands - Year-over-year growth 2025-2030 (%)

12.5 APAC - Market size and forecast 2025-2030

Chart on APAC - Market size and forecast 2025-2030 ($ million)
Data Table on APAC - Market size and forecast 2025-2030 ($ million)
Chart on APAC - Year-over-year growth 2025-2030 (%)
Data Table on APAC - Year-over-year growth 2025-2030 (%)
Chart on Regional Comparison - APAC
Data Table on Regional Comparison - APAC

12.5.1 China - Market size and forecast 2025-2030

Chart on China - Market size and forecast 2025-2030 ($ million)
Data Table on China - Market size and forecast 2025-2030 ($ million)
Chart on China - Year-over-year growth 2025-2030 (%)
Data Table on China - Year-over-year growth 2025-2030 (%)

12.5.2 India - Market size and forecast 2025-2030

Chart on India - Market size and forecast 2025-2030 ($ million)
Data Table on India - Market size and forecast 2025-2030 ($ million)
Chart on India - Year-over-year growth 2025-2030 (%)
Data Table on India - Year-over-year growth 2025-2030 (%)

12.5.3 Japan - Market size and forecast 2025-2030

Chart on Japan - Market size and forecast 2025-2030 ($ million)
Data Table on Japan - Market size and forecast 2025-2030 ($ million)
Chart on Japan - Year-over-year growth 2025-2030 (%)
Data Table on Japan - Year-over-year growth 2025-2030 (%)

12.5.4 South Korea - Market size and forecast 2025-2030

Chart on South Korea - Market size and forecast 2025-2030 ($ million)
Data Table on South Korea - Market size and forecast 2025-2030 ($ million)
Chart on South Korea - Year-over-year growth 2025-2030 (%)
Data Table on South Korea - Year-over-year growth 2025-2030 (%)

12.5.5 Australia - Market size and forecast 2025-2030

Chart on Australia - Market size and forecast 2025-2030 ($ million)
Data Table on Australia - Market size and forecast 2025-2030 ($ million)
Chart on Australia - Year-over-year growth 2025-2030 (%)
Data Table on Australia - Year-over-year growth 2025-2030 (%)

12.5.6 Indonesia - Market size and forecast 2025-2030

Chart on Indonesia - Market size and forecast 2025-2030 ($ million)
Data Table on Indonesia - Market size and forecast 2025-2030 ($ million)
Chart on Indonesia - Year-over-year growth 2025-2030 (%)
Data Table on Indonesia - Year-over-year growth 2025-2030 (%)

12.6 South America - Market size and forecast 2025-2030

Chart on South America - Market size and forecast 2025-2030 ($ million)
Data Table on South America - Market size and forecast 2025-2030 ($ million)
Chart on South America - Year-over-year growth 2025-2030 (%)
Data Table on South America - Year-over-year growth 2025-2030 (%)
Chart on Regional Comparison - South America
Data Table on Regional Comparison - South America

12.6.1 Brazil - Market size and forecast 2025-2030

Chart on Brazil - Market size and forecast 2025-2030 ($ million)
Data Table on Brazil - Market size and forecast 2025-2030 ($ million)
Chart on Brazil - Year-over-year growth 2025-2030 (%)
Data Table on Brazil - Year-over-year growth 2025-2030 (%)

12.6.2 Argentina - Market size and forecast 2025-2030

Chart on Argentina - Market size and forecast 2025-2030 ($ million)
Data Table on Argentina - Market size and forecast 2025-2030 ($ million)
Chart on Argentina - Year-over-year growth 2025-2030 (%)
Data Table on Argentina - Year-over-year growth 2025-2030 (%)

12.6.3 Colombia - Market size and forecast 2025-2030

Chart on Colombia - Market size and forecast 2025-2030 ($ million)
Data Table on Colombia - Market size and forecast 2025-2030 ($ million)
Chart on Colombia - Year-over-year growth 2025-2030 (%)
Data Table on Colombia - Year-over-year growth 2025-2030 (%)

12.7 Middle East and Africa - Market size and forecast 2025-2030

Chart on Middle East and Africa - Market size and forecast 2025-2030 ($ million)
Data Table on Middle East and Africa - Market size and forecast 2025-2030 ($ million)
Chart on Middle East and Africa - Year-over-year growth 2025-2030 (%)
Data Table on Middle East and Africa - Year-over-year growth 2025-2030 (%)
Chart on Regional Comparison - Middle East and Africa
Data Table on Regional Comparison - Middle East and Africa

12.7.1 Saudi Arabia - Market size and forecast 2025-2030

Chart on Saudi Arabia - Market size and forecast 2025-2030 ($ million)
Data Table on Saudi Arabia - Market size and forecast 2025-2030 ($ million)
Chart on Saudi Arabia - Year-over-year growth 2025-2030 (%)
Data Table on Saudi Arabia - Year-over-year growth 2025-2030 (%)

12.7.2 UAE - Market size and forecast 2025-2030

Chart on UAE - Market size and forecast 2025-2030 ($ million)
Data Table on UAE - Market size and forecast 2025-2030 ($ million)
Chart on UAE - Year-over-year growth 2025-2030 (%)
Data Table on UAE - Year-over-year growth 2025-2030 (%)

12.7.3 South Africa - Market size and forecast 2025-2030

Chart on South Africa - Market size and forecast 2025-2030 ($ million)
Data Table on South Africa - Market size and forecast 2025-2030 ($ million)
Chart on South Africa - Year-over-year growth 2025-2030 (%)
Data Table on South Africa - Year-over-year growth 2025-2030 (%)

12.7.4 Israel - Market size and forecast 2025-2030

Chart on Israel - Market size and forecast 2025-2030 ($ million)
Data Table on Israel - Market size and forecast 2025-2030 ($ million)
Chart on Israel - Year-over-year growth 2025-2030 (%)
Data Table on Israel - Year-over-year growth 2025-2030 (%)

12.7.5 Turkey - Market size and forecast 2025-2030

Chart on Turkey - Market size and forecast 2025-2030 ($ million)
Data Table on Turkey - Market size and forecast 2025-2030 ($ million)
Chart on Turkey - Year-over-year growth 2025-2030 (%)
Data Table on Turkey - Year-over-year growth 2025-2030 (%)

12.8 Market opportunity by geography

Market opportunity by geography ($ million)
Data Tables on Market opportunity by geography ($ million)

13. Drivers, Challenges, and Opportunity

13.1 Market drivers

Increasing emphasis on industrial occupational safety and regulatory compliance
Integration of advanced communication and internet of things technologies in personal mobility
Rising demand for AR and real-time data visualization in professional defense and sports

13.2 Market challenges

High initial costs and maintenance expenses of integrated electronics
Technical constraints regarding battery life and weight management
Data privacy concerns and cybersecurity vulnerabilities in connected headgear

13.3 Impact of drivers and challenges

Impact of drivers and challenges in 2025 and 2030

13.4 Market opportunities

Integration of augmented reality and advanced heads-up displays
Enhanced connectivity via IoT and 5G Networks
Implementation of biometric monitoring and health diagnostics

14. Competitive Landscape

14.1 Overview

14.2

Overview on criticality of inputs and factors of differentiation

14.3 Landscape disruption

Overview on factors of disruption

14.4 Industry risks

Impact of key risks on business

15. Competitive Analysis

15.1 Companies profiled

Companies covered

15.2 Company ranking index

15.3 Market positioning of companies

Matrix on companies position and classification

15.4 Caberg SpA

Caberg SpA - Overview
Caberg SpA - Product / Service
Caberg SpA - Key offerings
SWOT

15.5 Crosshelmet

Crosshelmet - Overview
Crosshelmet - Product / Service
Crosshelmet - Key offerings
SWOT

15.6 Dainese Spa

Dainese Spa - Overview
Dainese Spa - Product / Service
Dainese Spa - Key offerings
SWOT

15.7 Forcite Helmet Systems Pty Ltd.

Forcite Helmet Systems Pty Ltd. - Overview
Forcite Helmet Systems Pty Ltd. - Product / Service
Forcite Helmet Systems Pty Ltd. - Key offerings
SWOT

15.8 HJC Helmets

HJC Helmets - Overview
HJC Helmets - Product / Service
HJC Helmets - Key offerings
SWOT

15.9 Kido Sports Co. Ltd.

Kido Sports Co. Ltd. - Overview
Kido Sports Co. Ltd. - Product / Service
Kido Sports Co. Ltd. - Key offerings
SWOT

15.10 LIVALL Tech Co. Ltd.

LIVALL Tech Co. Ltd. - Overview
LIVALL Tech Co. Ltd. - Product / Service
LIVALL Tech Co. Ltd. - Key offerings
SWOT

15.11 Nexxpro SA

Nexxpro SA - Overview
Nexxpro SA - Product / Service
Nexxpro SA - Key offerings
SWOT

15.12 Nolangroup SpA

Nolangroup SpA - Overview
Nolangroup SpA - Product / Service
Nolangroup SpA - Key offerings
SWOT

15.13 OGK Kabuto Co. Ltd.

OGK Kabuto Co. Ltd. - Overview
OGK Kabuto Co. Ltd. - Product / Service
OGK Kabuto Co. Ltd. - Key offerings
SWOT

15.14 Schuberth GmbH

Schuberth GmbH - Overview
Schuberth GmbH - Product / Service
Schuberth GmbH - Key offerings
SWOT

15.15 Sena Technologies Inc.

Sena Technologies Inc. - Overview
Sena Technologies Inc. - Product / Service
Sena Technologies Inc. - Key news
Sena Technologies Inc. - Key offerings
SWOT

15.16 Shoei Co. Ltd.

Shoei Co. Ltd. - Overview
Shoei Co. Ltd. - Product / Service
Shoei Co. Ltd. - Key offerings
SWOT

15.17 Studds Accessories Ltd.

Studds Accessories Ltd. - Overview
Studds Accessories Ltd. - Product / Service
Studds Accessories Ltd. - Key offerings
SWOT

15.18 SUOMY Motorsport Srl

SUOMY Motorsport Srl - Overview
SUOMY Motorsport Srl - Product / Service
SUOMY Motorsport Srl - Key offerings
SWOT

16. Appendix

16.1 Scope of the report

Market definition
Objectives
Notes and caveats

16.2 Inclusions and exclusions checklist

Inclusions checklist
Exclusions checklist

16.3 Currency conversion rates for US$

16.4 Research methodology

16.5 Data procurement

Information sources

16.6 Data validation

16.7 Validation techniques employed for market sizing

16.8 Data synthesis

16.9 360 degree market analysis

16.10 List of abbreviations

Research Methodology

Technavio presents a detailed picture of the market by way of study, synthesis, and summation of data from multiple sources. The analysts have presented the various facets of the market with a particular focus on identifying the key industry influencers. The data thus presented is comprehensive, reliable, and the result of extensive research, both primary and secondary.

INFORMATION SOURCES

Primary sources

  • Manufacturers and suppliers
  • Channel partners
  • Industry experts
  • Strategic decision makers

Secondary sources

  • Industry journals and periodicals
  • Government data
  • Financial reports of key industry players
  • Historical data
  • Press releases

DATA ANALYSIS

Data Synthesis

  • Collation of data
  • Estimation of key figures
  • Analysis of derived insights

Data Validation

  • Triangulation with data models
  • Reference against proprietary databases
  • Corroboration with industry experts

REPORT WRITING

Qualitative

  • Market drivers
  • Market challenges
  • Market trends
  • Five forces analysis

Quantitative

  • Market size and forecast
  • Market segmentation
  • Geographical insights
  • Competitive landscape

Interested in this report?

Get your sample now to see our research methodology and insights!

Download Now

Frequently Asked Questions

Smart Helmet market growth will increase by USD 1695.6 million during 2026-2030.

The Smart Helmet market is expected to grow at a CAGR of 18.4% during 2026-2030.

Smart Helmet market is segmented by Component (Communication, Camera, Navigation, Others) Type (Full face, Half face, Hard hat) Connectivity (Bluetooth, GPS, Wi-Fi, Cellular)

AIROH, ARAI Helmet Ltd., Caberg SpA, Crosshelmet, Dainese Spa, Forcite Helmet Systems Pty Ltd., HJC Helmets, Intelligent Cranium Helmets, Jarvish Inc., Kido Sports Co. Ltd., LIVALL Tech Co. Ltd., Nexxpro SA, Nolangroup SpA, OGK Kabuto Co. Ltd., Schuberth GmbH, Sena Technologies Inc., Shoei Co. Ltd., Studds Accessories Ltd., SUOMY Motorsport Srl are a few of the key vendors in the Smart Helmet market.

North America will register the highest growth rate of 46.4% among the other regions. Therefore, the Smart Helmet market in North America is expected to garner significant business opportunities for the vendors during the forecast period.

US, Canada, Mexico, Germany, UK, France, Italy, Spain, The Netherlands, China, India, Japan, South Korea, Australia, Indonesia, Brazil, Argentina, Colombia, Saudi Arabia, UAE, South Africa, Israel, Turkey

  • Increasing emphasis on industrial occupational safety and regulatory compliance is the driving factor this market.

The Smart Helmet market vendors should focus on grabbing business opportunities from the Component segment as it accounted for the largest market share in the base year.