Smart Livestock Market Size 2024-2028
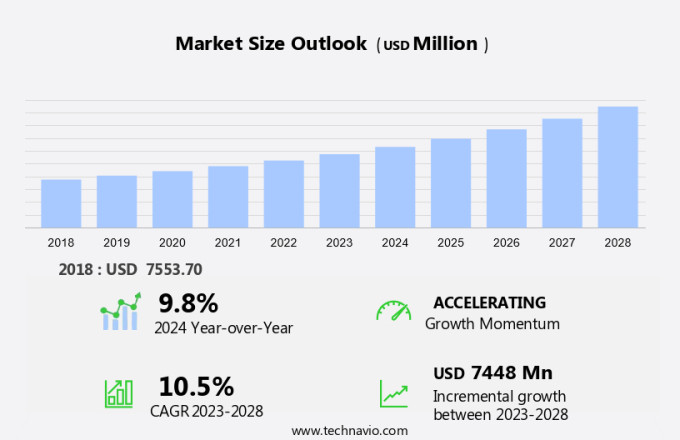
The smart livestock market size is forecast to increase by USD 7.45 billion, at a CAGR of 10.5% between 2023 and 2028.
- The market is experiencing significant growth, driven by the increasing prioritization of environmental sustainability in agriculture. Farmers are recognizing the benefits of implementing smart technologies to optimize livestock farming, reduce waste, and improve animal welfare. This trend is further fueled by the continuous launch of innovative new products, which offer advanced features such as real-time monitoring, automated feeding, and health tracking. However, the high initial investment required for implementing these technologies poses a challenge for smaller farms and livestock producers.
- This investment includes not only the cost of purchasing the hardware and software but also the ongoing maintenance and training needed to effectively utilize the technology. To capitalize on the market opportunities, companies should focus on offering flexible financing options, affordable pricing structures, and comprehensive support services. By addressing these challenges, they can help more farmers transition to smart livestock farming and expand their customer base.
What will be the Size of the Smart Livestock Market during the forecast period?
Explore in-depth regional segment analysis with market size data - historical 2018-2022 and forecasts 2024-2028 - in the full report.
Request Free Sample
The market continues to evolve, integrating advanced technologies to enhance livestock production and improve overall efficiency. Water conservation techniques, such as precision irrigation and sensor networks, are essential in managing resources while reducing environmental impact. Swine monitoring and poultry monitoring systems enable real-time animal health assessments, reducing production costs through disease prevention strategies and early detection. Veterinary telemedicine and animal identification systems facilitate remote consultations and precise record-keeping, ensuring certification programs and animal welfare standards are met. Livestock health records, farm management practices, and genomic selection are seamlessly integrated, allowing for predictive analytics and yield optimization strategies.
Precision livestock farming and animal behavior tracking enable farmers to monitor and adjust feeding systems, automate milking, and implement biosecurity measures. Precision breeding programs and feed efficiency analysis contribute to sustainable livestock production, while cloud-based data storage and data analytics platforms enable farmers to make informed decisions. Ruminant monitoring, livestock insurance, and machine learning models help manage greenhouse gas emissions and market price fluctuations. Automated feeding systems and remote monitoring systems ensure optimal animal health and welfare, while dairy farming optimization and livestock management software streamline operations. Biometric identification, artificial insemination, and wearable sensors contribute to precision breeding and disease prevention.
Industry standards and RFID tags ensure traceability and transparency, while precision irrigation and sensor networks reduce water usage and promote environmental impact reduction. In this ever-changing market, continuous innovation and adaptation are key to success. From veterinary care to farm management, the integration of technology is transforming the livestock industry, enabling more efficient, sustainable, and cost-effective production.
How is this Smart Livestock Industry segmented?
The smart livestock industry research report provides comprehensive data (region-wise segment analysis), with forecasts and estimates in "USD million" for the period 2024-2028, as well as historical data from 2018-2022 for the following segments.
- End-user
- Farmers and agricultural cooperatives
- Veterinary clinics
- Research institutes
- Product
- Hardware
- Software
- Services
- Geography
- North America
- US
- Europe
- France
- Germany
- Spain
- UK
- APAC
- Australia
- China
- India
- Japan
- South America
- Brazil
- Rest of World (ROW)
- North America
.
By End-user Insights
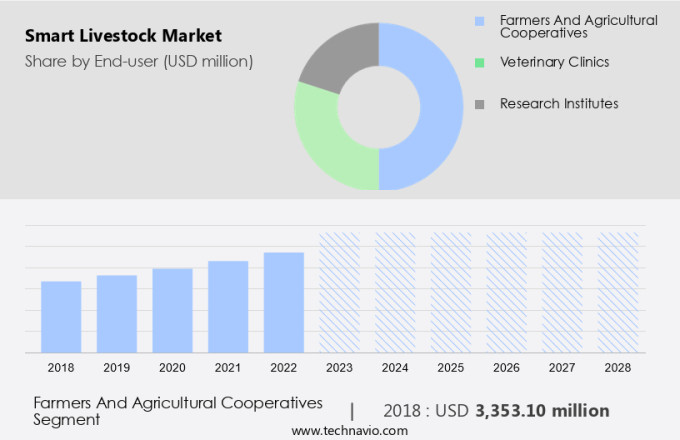
The farmers and agricultural cooperatives segment is estimated to witness significant growth during the forecast period.
In the dynamic market, farmers and agricultural cooperatives in the US are leading the charge towards more sustainable and efficient livestock production. Grasslands, which constitute the largest agricultural land use, are at the forefront of this movement, offering potential for carbon sequestration and agricultural advancements. Farmers are embracing climate-smart practices, such as planting native warm-season grasses, interseeding legumes, and utilizing biochar amendments to improve soil quality. Additionally, enhanced grazing management techniques, silvopasturing, and the establishment of perennial pollinator buffers contribute to sustainable practices. Precision livestock farming is another key trend, with farmers implementing animal identification systems, genomic selection, predictive analytics, and precision irrigation to optimize yields and reduce production costs.
Veterinary telemedicine, animal behavior tracking, and disease prevention strategies are essential components of this approach, ensuring animal health and welfare while minimizing the need for antibiotics and other interventions. Cloud-based data storage, machine learning models, and data analytics platforms enable farmers to monitor market price fluctuations, implement yield optimization strategies, and make data-driven decisions. Automated feeding systems, remote monitoring systems, and automated milking systems further enhance operational efficiency and reduce labor requirements. Government regulations and industry standards, including animal welfare standards and certification programs, are driving the adoption of biosecurity measures, early disease detection, and sustainable livestock production practices.
Environmental impact reduction, through the use of wearable sensors, ruminant monitoring, and livestock waste management systems, is also a critical concern for farmers and cooperatives. The integration of precision breeding programs, feed efficiency analysis, and artificial insemination into livestock management software is revolutionizing the industry, enabling farmers to optimize their operations and improve profitability. Overall, the market is characterized by a focus on innovation, sustainability, and operational efficiency.
The Farmers and agricultural cooperatives segment was valued at USD 3.35 billion in 2018 and showed a gradual increase during the forecast period.
Regional Analysis
North America is estimated to contribute 42% to the growth of the global market during the forecast period. Technavio's analysts have elaborately explained the regional trends and drivers that shape the market during the forecast period.
In North America, particularly in the US, the livestock sector is embracing smart technologies to enhance productivity and sustainability. This shift is driven by a long-standing focus on improving livestock management and a growing concern for climate change. The US government is spearheading this transformation through initiatives like the USDA's USD34 million Bangladesh Climate Smart Livestock project. This endeavor aims to boost livestock productivity, improve animal health, and decrease greenhouse gas emissions in Bangladesh. Simultaneously, it underscores the US commitment to promoting climate-smart practices in agriculture domestically and internationally. Smart livestock farming encompasses various technologies, including water conservation techniques, swine monitoring, precision livestock farming, animal behavior tracking, genomic selection, predictive analytics, and poultry monitoring.
These solutions contribute to economic viability assessment, livestock health records, certification programs, animal welfare standards, and government regulations. Moreover, data visualization tools, ruminant monitoring, livestock insurance, cloud-based data storage, machine learning models, market price fluctuations, and yield optimization strategies are essential components of this sector. Technologies like automated feeding systems, remote monitoring systems, precision irrigation, data analytics platforms, disease prevention strategies, livestock management software, artificial insemination, biometric identification, environmental impact reduction, sensor networks, dairy farming optimization, animal health monitoring, industry standards, RFID tags, precision breeding programs, feed efficiency analysis, wearable sensors, automated milking systems, biosecurity measures, early disease detection, and sustainable livestock production are increasingly being adopted.
These innovations not only optimize production costs but also improve animal welfare, reduce environmental impact, and ensure regulatory compliance. The integration of technologies like veterinary telemedicine, genomic selection, predictive analytics, and precision livestock farming enables farmers to make data-driven decisions, enhance herd health, and minimize production risks. Additionally, technologies like precision irrigation, data analytics platforms, and machine learning models contribute to resource conservation and operational efficiency. In conclusion, the market in North America is evolving rapidly, driven by a commitment to climate-smart practices, technological advancements, and a focus on sustainable livestock production. The US government's initiatives, combined with private sector investments, are fostering the adoption of these technologies and setting new industry standards.
Market Dynamics
Our researchers analyzed the data with 2023 as the base year, along with the key drivers, trends, and challenges. A holistic analysis of drivers will help companies refine their marketing strategies to gain a competitive advantage.
What are the key market drivers leading to the rise in the adoption of Smart Livestock Industry?
- Environmental sustainability serves as the primary motivator for market trends and consumer choices.
- The market is experiencing significant growth due to the increasing emphasis on environmental sustainability and the need to improve livestock production efficiency. As the demand for animal protein continues to rise, the livestock sector faces challenges related to land use, water scarcity, greenhouse gas (GHG) emissions, and biodiversity loss. To address these issues, there is a shift towards more sustainable practices that incorporate advanced technologies. Smart livestock management incorporates RFID tags, precision breeding programs, feed efficiency analysis, wearable sensors, automated milking systems, biosecurity measures, and early disease detection. These technologies help reduce emissions per unit of product, enhance carbon sequestration in agricultural landscapes, and improve overall productivity.
- For instance, the implementation of energy-efficient technologies and renewable energy solutions in livestock operations is gaining popularity, reducing reliance on fossil fuels and minimizing the carbon footprint of farming. Moreover, precision breeding programs and feed efficiency analysis help optimize livestock feed usage, reducing the amount of feed required per unit of product. Wearable sensors and automated milking systems improve animal health and welfare while reducing labor costs. Biosecurity measures and early disease detection help prevent the spread of diseases, reducing the need for antibiotics and improving animal health. Overall, these technologies contribute to more sustainable livestock production, addressing the critical challenges facing the industry while meeting the growing demand for animal protein.
What are the market trends shaping the Smart Livestock Industry?
- The market is witnessing an increasing number of new product launches, which represents a significant trend in the business world. It is essential for professionals to stay informed about these developments to maintain a competitive edge.
- The market is experiencing significant growth as companies adopt innovative technologies to optimize farm productivity and animal health. One recent development in this area is DeLaval's launch of DeLaval Plus, an AI-powered customer portal that analyzes herd data to provide farmers with valuable insights. This system includes a Disease Risk feature, which uses AI to predict and alert farmers about cows at risk of diseases such as mastitis and ketosis, enabling early intervention and potential loss reduction. This trend reflects the industry's increasing emphasis on precision farming and data-driven management tools.
- Other advanced technologies gaining traction in the market include water conservation techniques, swine monitoring, veterinary telemedicine, animal identification systems, genomic selection, predictive analytics, poultry monitoring, and farm management practices. These solutions contribute to the economic viability of livestock production by reducing costs, improving animal welfare, and enhancing overall efficiency.
What challenges does the Smart Livestock Industry face during its growth?
- A significant initial investment represents a major hurdle for the industry's growth trajectory.
- The market faces a significant challenge due to the substantial upfront investment needed to implement advanced farming technologies. The costs of adopting AI, precision agriculture, and sensor integration solutions can be substantial. Initial investments for AI infrastructure can range from USD 10,000 to over USD 100,000, depending on the technology's scale and complexity. Software development costs can range from USD 50,000 to USD 500,000, while AI-powered sensor and hardware integration could cost between USD 20,000 and USD 200,000. Certification programs, animal welfare standards, and government regulations are driving the demand for smart livestock farming. Cloud-based data storage, machine learning models, livestock insurance, and data visualization tools are essential components of these advanced farming solutions.
- They help in monitoring greenhouse gas emissions, optimizing yield, and managing ruminant health records. Market price fluctuations require farmers to employ optimization strategies, making these technologies increasingly valuable. The implementation of these technologies can lead to numerous benefits, including improved livestock health, enhanced animal welfare, and increased operational efficiency. Despite the high initial investment, the long-term benefits and potential cost savings make smart livestock farming a worthwhile investment for businesses and entrepreneurs.
Exclusive Customer Landscape
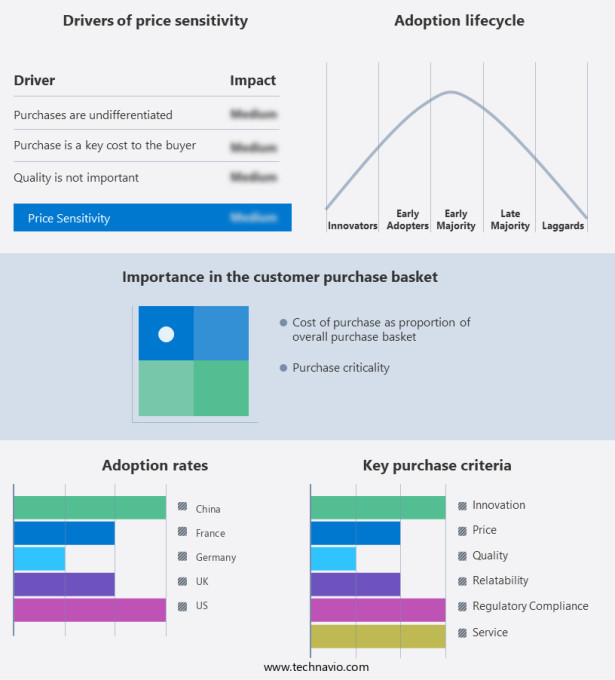
The smart livestock market forecasting report includes the adoption lifecycle of the market, covering from the innovator's stage to the laggard's stage. It focuses on adoption rates in different regions based on penetration. Furthermore, the smart livestock market report also includes key purchase criteria and drivers of price sensitivity to help companies evaluate and develop their market growth analysis strategies.
Customer Landscape
Key Companies & Market Insights
Companies are implementing various strategies, such as strategic alliances, smart livestock market forecast, partnerships, mergers and acquisitions, geographical expansion, and product/service launches, to enhance their presence in the industry.
Afimilk Ltd. - This company specializes in innovative livestock technologies, including AfiCollar and AfiFarm software.
The industry research and growth report includes detailed analyses of the competitive landscape of the market and information about key companies, including:
- Afimilk Ltd.
- AgriWebb group
- BovControl Inc.
- CattleEye Ltd.
- Connecterra B.V.
- DeLaval International AB
- Digi International Inc.
- FRS Herdwatch Ltd.
- GEA Group AG
- Halter
- HerdDogg Inc.
- Lely International NV
- Madison One Holdings LLC
- Merck and Co. Inc.
- Moocall
- Nedap NV
- Zinpro Corp.
- Zoetis Inc.
Qualitative and quantitative analysis of companies has been conducted to help clients understand the wider business environment as well as the strengths and weaknesses of key industry players. Data is qualitatively analyzed to categorize companies as pure play, category-focused, industry-focused, and diversified; it is quantitatively analyzed to categorize companies as dominant, leading, strong, tentative, and weak.
Recent Development and News in Smart Livestock Market
- In March 2024, Israeli tech company, Farmwise, unveiled its smart livestock monitoring system, integrating computer vision and machine learning to detect and diagnose health issues in cattle. This system, according to Farmwise's press release, can identify diseases up to three weeks earlier than traditional methods, reducing potential economic losses for farmers (Farmwise, 2024).
- In July 2024, Cargill, a leading global food company, announced a strategic partnership with Dutch technology firm, Hatsun Agro Product's InnovaGen, to develop and commercialize precision livestock farming solutions. The collaboration aims to improve farm productivity and animal welfare through advanced technologies, such as automated feeding systems and real-time health monitoring (Cargill, 2024).
- In November 2024, US-based tech firm, Lely, raised USD 150 million in a funding round to expand its smart farming solutions, including its robotic milking systems and automated feeding solutions for dairy farms. This investment, according to TechCrunch, will help Lely to strengthen its market position and accelerate its international growth (TechCrunch, 2024).
- In February 2025, the European Commission approved the Horizon Europe research and innovation program, which includes a focus on digital agriculture and precision livestock farming. This initiative, as stated in the European Commission's press release, will provide â¬9.2 billion for research and innovation in the agricultural sector, including the development and deployment of smart livestock solutions (European Commission, 2025).
Research Analyst Overview
- In the dynamic livestock market, various trends and technologies are shaping the industry's future. Animal welfare legislation is a significant factor, driving the adoption of precision breeding technologies to improve livestock health and wellbeing. Cybersecurity in agriculture is another critical concern, with the implementation of precision livestock education and reproductive management systems. Consumer demand trends favor food safety standards and traceability, leading to the integration of animal tracking systems and blockchain applications. Precision ventilation and automated water systems are essential for efficient barn management and heat stress mitigation. Livestock industry collaboration is crucial for implementing biosecurity protocols and climate change adaptation strategies.
- Agtech investment is surging, with the integration of agronomic data and weather forecasting tools to optimize farming infrastructure and livestock housing design. Gene editing and precision farming infrastructure are revolutionizing the sector, enabling sustainable food systems and reducing animal stress through advanced reproductive management and animal welfare audits. Smart contracts and livestock transportation systems are streamlining operations and ensuring transparency in the supply chain. Overall, the livestock market is adapting to the challenges of a changing world, with a focus on innovation, collaboration, and sustainability.
Dive into Technavio's robust research methodology, blending expert interviews, extensive data synthesis, and validated models for unparalleled Smart Livestock Market insights. See full methodology.
|
Market Scope |
|
|
Report Coverage |
Details |
|
Page number |
200 |
|
Base year |
2023 |
|
Historic period |
2018-2022 |
|
Forecast period |
2024-2028 |
|
Growth momentum & CAGR |
Accelerate at a CAGR of 10.5% |
|
Market growth 2024-2028 |
USD 7448 million |
|
Market structure |
Fragmented |
|
YoY growth 2023-2024(%) |
9.8 |
|
Key countries |
US, China, Germany, UK, France, Spain, Japan, Australia, India, and Brazil |
|
Competitive landscape |
Leading Companies, Market Positioning of Companies, Competitive Strategies, and Industry Risks |
What are the Key Data Covered in this Smart Livestock Market Research and Growth Report?
- CAGR of the Smart Livestock industry during the forecast period
- Detailed information on factors that will drive the growth and forecasting between 2024 and 2028
- Precise estimation of the size of the market and its contribution of the industry in focus to the parent market
- Accurate predictions about upcoming growth and trends and changes in consumer behaviour
- Growth of the market across North America, Europe, APAC, South America, and Middle East and Africa
- Thorough analysis of the market's competitive landscape and detailed information about companies
- Comprehensive analysis of factors that will challenge the smart livestock market growth of industry companies
We can help! Our analysts can customize this smart livestock market research report to meet your requirements.


