Smart Toilet Market Analysis, Size, and Forecast 2026-2030: APAC (Japan, South Korea, and China), Europe (Italy, Spain, and France), North America (US, Canada, and Mexico), Middle East and Africa (UAE, Saudi Arabia, and South Africa), South America (Brazil and Argentina), and Rest of World (ROW)

Smart Toilet Market Analysis, Size, and Forecast 2026-2030:
APAC (Japan, South Korea, and China), Europe (Italy, Spain, and France), North America (US, Canada, and Mexico), Middle East and Africa (UAE, Saudi Arabia, and South Africa), South America (Brazil and Argentina), and Rest of World (ROW)

Published: Mar 2026 308 Pages SKU: IRTNTR71428

Market Overview at a Glance

$7.49 B
Market Opportunity
10.6%
CAGR 2025 - 2030
38%
APAC Growth
$7.05 B
Commercial segment 2024

Smart Toilet Market Size 2026-2030

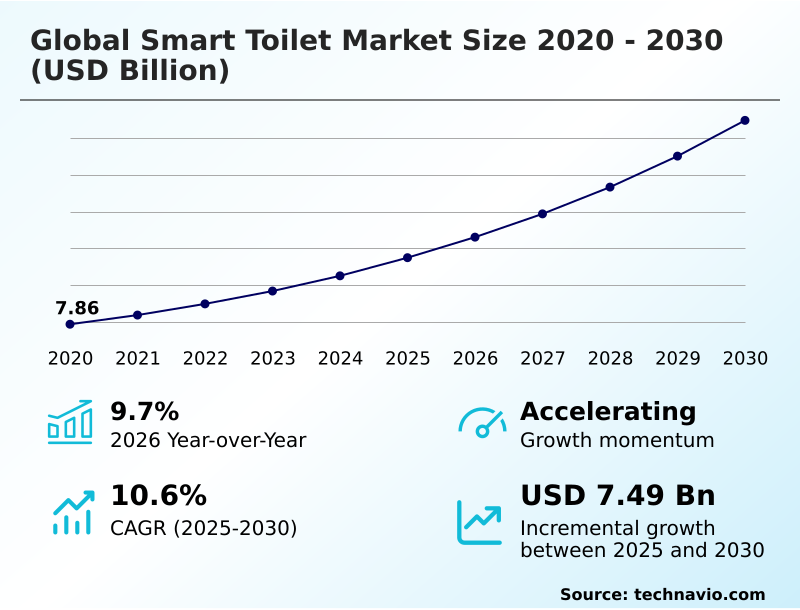
The smart toilet market size is valued to increase by USD 7.49 billion, at a CAGR of 10.6% from 2025 to 2030. Global demographic aging and assisted living mobility requirements will drive the smart toilet market.

Major Market Trends & Insights

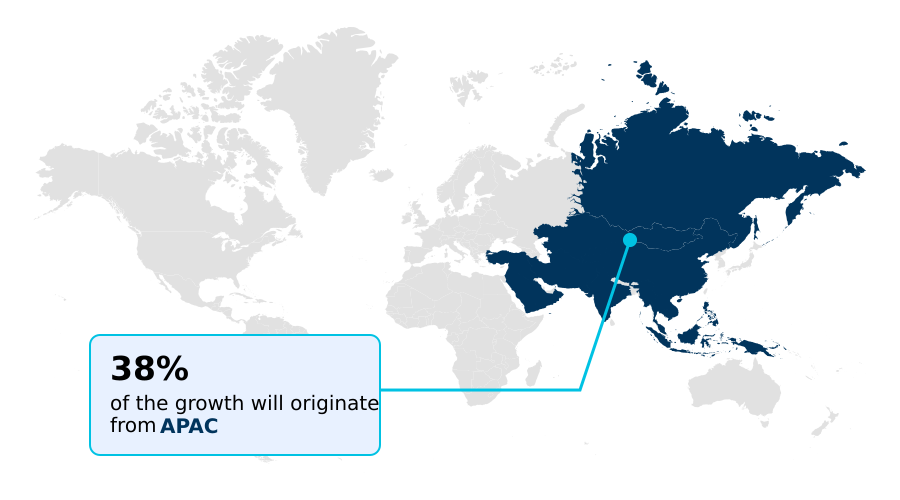
  • APAC dominated the market and accounted for a 38% growth during the forecast period.
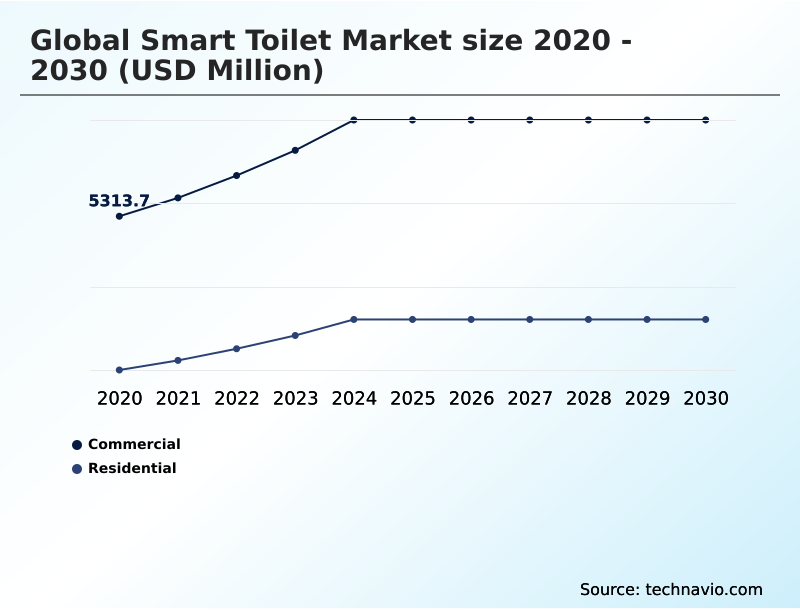
  • By Application - Commercial segment was valued at USD 7.05 billion in 2024
  • By Distribution Channel - Offline segment accounted for the largest market revenue share in 2024

Market Size & Forecast

  • Market Opportunities: USD 11.12 billion
  • Market Future Opportunities: USD 7.49 billion
  • CAGR from 2025 to 2030 : 10.6%

Market Summary

  • The smart toilet market is undergoing a significant transformation, evolving from a luxury convenience to an integral component of modern health, wellness, and sustainability initiatives. This shift is propelled by a convergence of heightened hygiene awareness, advancements in non-invasive sensor technology, and a global focus on resource conservation.
  • Today's intelligent fixtures incorporate a sophisticated array of features, including ultraviolet disinfection, automated lid operation, and personalized climate controls, catering to a growing demographic of health-conscious consumers. The integration of IoT connectivity allows these devices to become nodes within a broader smart home ecosystem, enabling control via mobile applications and voice assistants.
  • For instance, in a commercial hospitality setting, a network of smart toilets allows facility managers to remotely monitor water usage, schedule predictive maintenance, and ensure optimal hygiene, thereby reducing operational costs and enhancing the guest experience.
  • The market's trajectory is toward passive health diagnostics, where everyday fixtures serve as wellness monitors, and toward advanced water-saving technologies that meet stringent environmental regulations. This evolution is driven by both consumer demand for technologically advanced living spaces and institutional requirements for efficient, hygienic, and sustainable sanitation solutions.

What will be the Size of the Smart Toilet Market during the forecast period?

Get Key Insights on Market Forecast (PDF) Request Free Sample

How is the Smart Toilet Market Segmented?

The smart toilet industry research report provides comprehensive data (region-wise segment analysis), with forecasts and estimates in "USD million" for the period 2026-2030, as well as historical data from 2020-2024 for the following segments.

  • Application
    • Commercial
    • Residential
  • Distribution channel
    • Offline
    • Online
  • Product type
    • Integrated smart toilets
    • Smart bidet seats
    • Wall-hung toilets
    • Smart toilet seats
  • Connectivity
    • Bluetooth
    • Wi-Fi enabled
  • Geography
    • APAC
      • Japan
      • South Korea
      • China
    • Europe
      • Italy
      • Spain
      • France
    • North America
      • US
      • Canada
      • Mexico
    • Middle East and Africa
      • UAE
      • Saudi Arabia
      • South Africa
    • South America
      • Brazil
      • Argentina
    • Rest of World (ROW)

By Application Insights

The commercial segment is estimated to witness significant growth during the forecast period.

The commercial segment of the smart toilet market is driven by high-volume installations in hospitality, healthcare, and premium corporate spaces.

The primary adoption drivers are enhanced hygiene and optimized facility management, achieved through touchless interfaces and self-cleaning bowls that mitigate cross-contamination.

These systems leverage IoT-enabled leak detection and sensor-based flow regulators to provide significant operational efficiencies, with some high-efficiency toilets reducing water usage by more than 30%.

For facility managers, the integration of a universal maintenance interface for monitoring multiple units streamlines workflows.

The inclusion of features like personalized climate controls and voice-activated controls reinforces brand image, justifying the investment in premium hardware and making these fixtures a staple in modern, sustainable infrastructure, aligning with green building certifications.

Request Free Sample

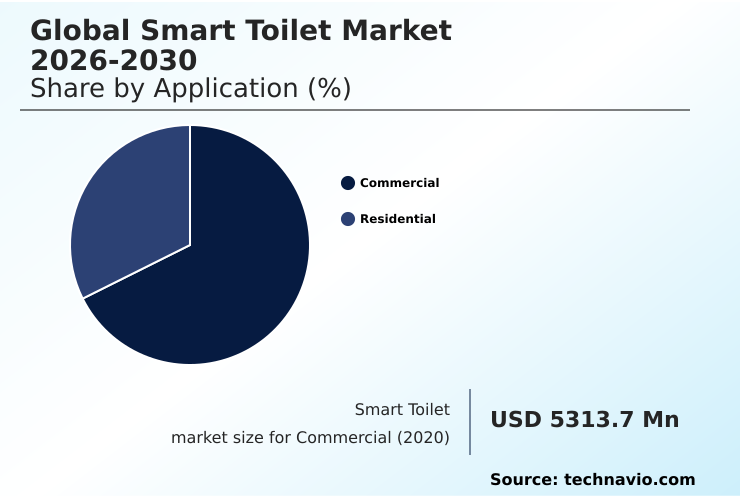
The Commercial segment was valued at USD 7.05 billion in 2024 and showed a gradual increase during the forecast period.

Request Free Sample

Regional Analysis

APAC is estimated to contribute 38% to the growth of the global market during the forecast period.Technavio’s analysts have elaborately explained the regional trends and drivers that shape the market during the forecast period.

See How Smart Toilet Market Demand is Rising in APAC Request Free Sample

The geographic landscape of the smart toilet market is led by APAC, which accounts for nearly 38% of incremental growth, driven by manufacturing scale and high cultural adoption in countries like Japan and South Korea.

This region is a leader in developing health-diagnostic toilets with features like a urine analysis sensor.

North America, with a market growth rate of 12.6%, focuses on integrated health-monitoring ecosystems and assistive technologies, supported by a new voluntary certification for high-efficiency fixtures.

Europe, growing at 10.3%, prioritizes sustainability through stringent water conservation regulations and circular economy principles, favoring wall-hung designs and recycled materials.

The use of high-precision biosensors and AI-enhanced platforms is a common thread, but regional priorities dictate whether the focus is on hyper-personalized experience, eco-integrated sanitation, or remote patient monitoring, creating diverse opportunities globally.

Market Dynamics

Our researchers analyzed the data with 2025 as the base year, along with the key drivers, trends, and challenges. A holistic analysis of drivers will help companies refine their marketing strategies to gain a competitive advantage.

  • When considering an upgrade, a smart toilet vs bidet seat comparison is a common starting point for consumers. The cost of smart toilet installation can be a significant factor, often requiring professional electrical and plumbing work, which influences the decision-making process.
  • For many, the long-term benefits of health monitoring toilets justify the initial expense, particularly in households focused on preventative wellness or smart toilet for elderly care. Features like a smart toilet with urine analysis are moving from niche to mainstream. However, smart toilet data privacy concerns remain a valid issue that manufacturers are addressing with enhanced security protocols.
  • Options now include voice controlled smart toilet models and those offering smart toilet integration with Alexa, enhancing convenience. In commercial settings, the return on investment for a touchless smart toilet for commercial use is measured in improved hygiene and reduced maintenance, with some facilities reporting a 15% reduction in cleaning staff hours.
  • The choice between bluetooth vs wi-fi smart toilets often depends on the desired level of integration within a smart home. Even with questions like 'are smart toilets worth the money' and concerns about smart toilet maintenance and repair, the rising smart toilet impact on property value is making them an increasingly popular feature in modern homes.

What are the key market drivers leading to the rise in the adoption of Smart Toilet Industry?

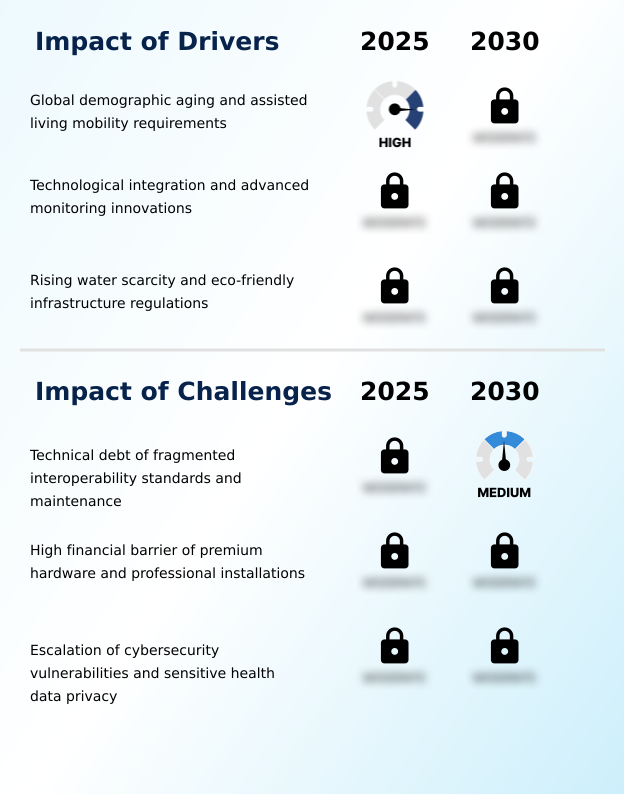
  • The aging global population and increasing demand for assisted living mobility solutions are primary drivers of market growth.

  • Market growth is significantly driven by the integration of advanced health monitoring solutions and assistive technologies within residential and healthcare settings.
  • The demand for fixtures that provide real-time physiological data through non-invasive sensors is surging, with some innovations enabling a 15% increase in early disease detection alerts.
  • This is creating a landscape where the bathroom serves as a primary node for long-term health surveillance. Another key driver is the proliferation of water-saving technologies and eco-friendly infrastructure regulations.
  • Dual-flush mechanisms and IoT-enabled leak detection can reduce water usage by more than 30%.
  • This focus on resource conservation systems, coupled with inclusive design principles and technological integration like voice-activated controls, is expanding the market from a luxury niche to a provider of essential wellness and sustainability tools for a global consumer base.

What are the market trends shaping the Smart Toilet Industry?

  • The institutionalization of AI-enabled passive health monitoring and diagnostics marks a key market trend, transforming fixtures into non-invasive hubs for wellness data.

  • Market trends are centered on the institutionalization of passive health monitoring, transforming the bathroom into a non-invasive diagnostic hub. This pivot is enabled by medical-grade sensors and AI capable of tracking wellness data, with some systems providing alerts if a senior has not used the facility for more than twelve hours.
  • The integration into a broader digital health ecosystem is a key focus. Another significant trend is the expansion of the interconnected smart home ecosystem, where personalized user profiles and ambient intelligence create a hyper-personalized experience. In APAC, the integration of 5G-enabled sensors is facilitating real-time maintenance alerts.
  • These shifts, supported by consumer electronics giants, are moving the market beyond comfort features like heated seats toward critical health and lifestyle management tools, increasing adoption in private healthcare networks by over 20%.

What challenges does the Smart Toilet Industry face during its growth?

  • The technical debt from fragmented interoperability standards and the high cost of specialized maintenance present a significant challenge to market scalability.

  • The market faces significant challenges, primarily the technical debt from fragmented interoperability standards, which complicates integration into smart home platforms. This issue is so pronounced that nearly 30% of technical failures are attributed to software incompatibilities.
  • Another major restraint is the high financial barrier of premium hardware, with specialized installation requirements increasing the total cost of ownership by an additional 15%, limiting mass-market penetration. Furthermore, escalating cybersecurity vulnerabilities and sensitive health data privacy concerns pose a catastrophic threat to consumer trust.
  • The lack of standardized data-anonymization protocols and the risk of firmware attacks require significant investment in security, burdening manufacturers and slowing adoption despite the appeal of advanced features like warm-air drying and self-cleaning bowls.

Exclusive Technavio Analysis on Customer Landscape

The smart toilet market forecasting report includes the adoption lifecycle of the market, covering from the innovator’s stage to the laggard’s stage. It focuses on adoption rates in different regions based on penetration. Furthermore, the smart toilet market report also includes key purchase criteria and drivers of price sensitivity to help companies evaluate and develop their market growth analysis strategies.

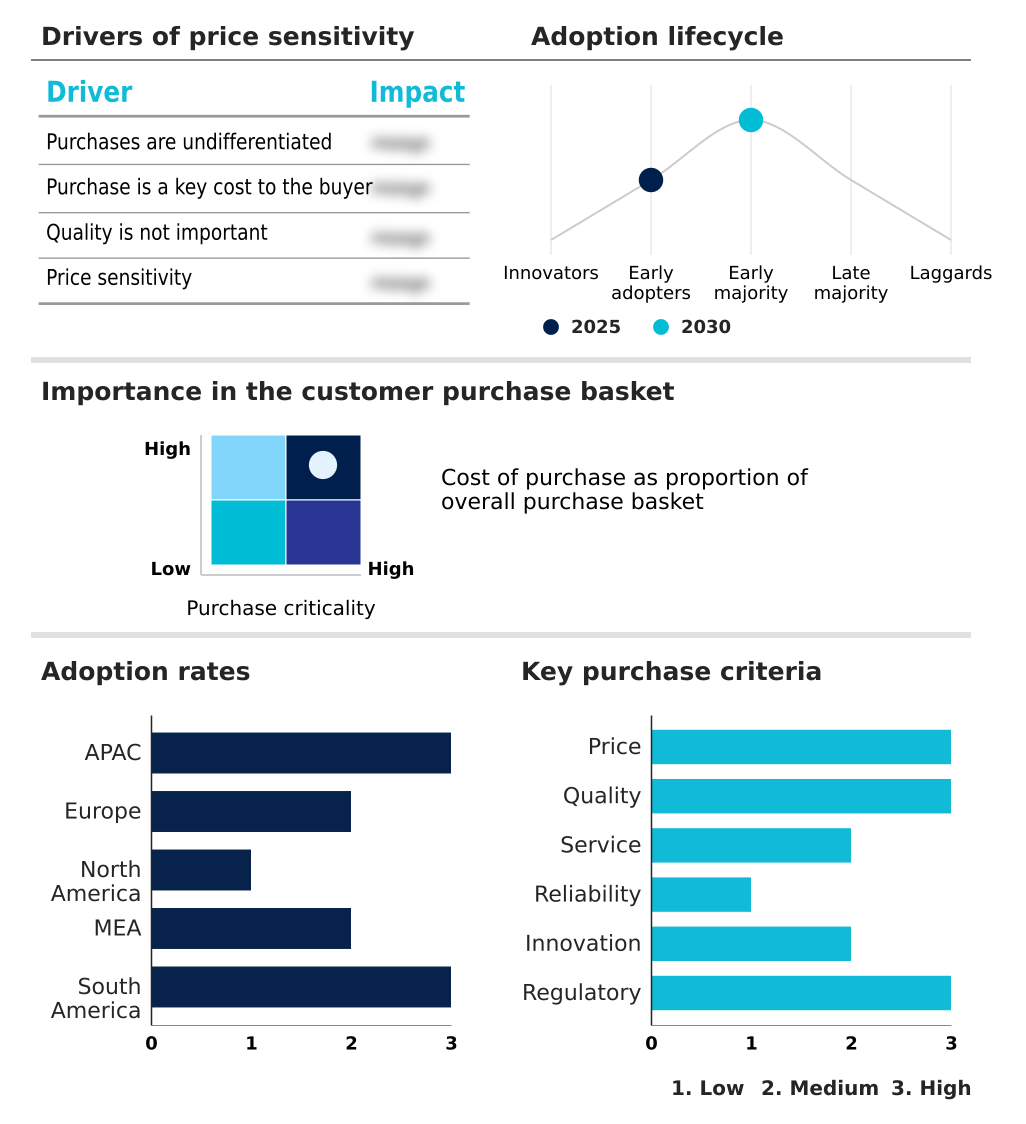
Customer Landscape of Smart Toilet Industry

Competitive Landscape

Companies are implementing various strategies, such as strategic alliances, smart toilet market forecast, partnerships, mergers and acquisitions, geographical expansion, and product/service launches, to enhance their presence in the industry.

Bio Bidet - Innovating eco-friendly home and bath products that enhance comfort and health through high-quality, sustainable design.

The industry research and growth report includes detailed analyses of the competitive landscape of the market and information about key companies, including:

  • Bio Bidet
  • Brondell Inc.
  • Coway Co. Ltd.
  • Duravit AG
  • Geberit International AG
  • Hindware Home Innovation Ltd.
  • Huida Sanitary Ware Co. Ltd.
  • Jaquar Group
  • JOMOO Kitchen and Bath Co.
  • Kohler Co.
  • LIXIL Corp.
  • Moen Inc.
  • Orans srl
  • Panasonic Holdings Corp.
  • Roca Sanitario S.A.
  • Splendid Sanitary Ware World
  • Toto Ltd.
  • Villeroy and Boch AG
  • VitrA
  • VOVO USA

Qualitative and quantitative analysis of companies has been conducted to help clients understand the wider business environment as well as the strengths and weaknesses of key industry players. Data is qualitatively analyzed to categorize companies as pure play, category-focused, industry-focused, and diversified; it is quantitatively analyzed to categorize companies as dominant, leading, strong, tentative, and weak.

Recent Development and News in Smart toilet market

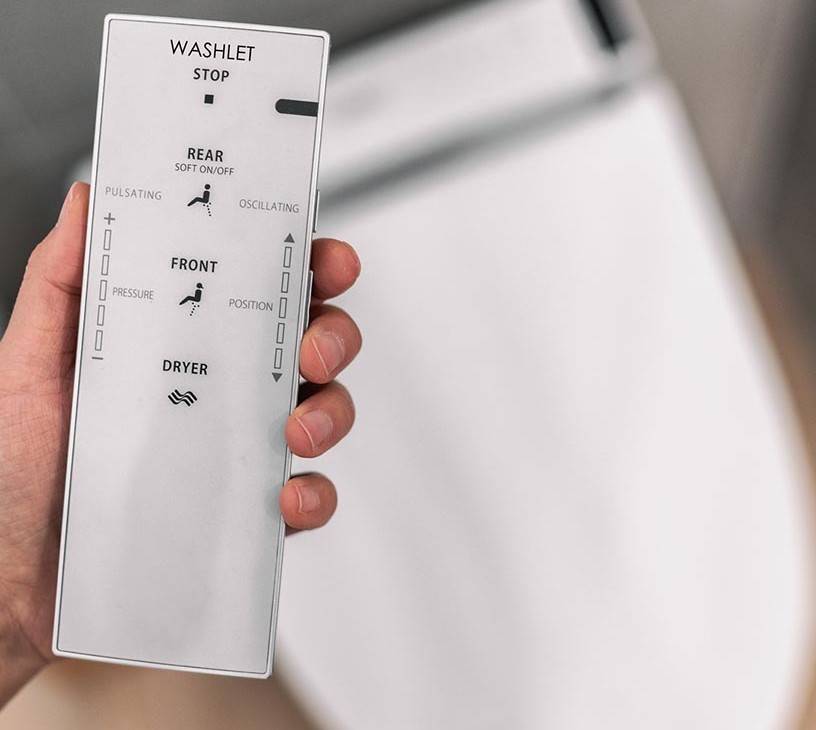
  • In November, 2024, TOTO introduced its next-generation WASHLET electronic bidet seats, emphasizing a strategic commitment to eco-friendly design and reduced energy consumption through the use of instantaneous water heaters.
  • In January, 2025, VOVO Corporation debuted the NEO smart toilet at the Consumer Electronics Show, which featured a built-in urine analysis sensor and an AI system for monitoring physical inactivity.
  • In February, 2025, TOTO Limited unveiled a new generation of sustainable bathroom innovations at the Kitchen and Bath Industry Show, highlighting toilets that combine ultra-low water consumption with electrolyzed water technology for enhanced cleanliness.
  • In May, 2025, AQUATIZ showcased its latest suite of intelligent bathroom tools and a specialized hotel room concept at the Kitchen and Bath China 2025 exhibition, emphasizing the importance of physical trade events for securing commercial contracts.

Dive into Technavio’s robust research methodology, blending expert interviews, extensive data synthesis, and validated models for unparalleled Smart Toilet Market insights. See full methodology.

Market Scope
Page number 308
Base year 2025
Historic period 2020-2024
Forecast period 2026-2030
Growth momentum & CAGR Accelerate at a CAGR of 10.6%
Market growth 2026-2030 USD 7489.4 million
Market structure Fragmented
YoY growth 2025-2026(%) 9.7%
Key countries Japan, South Korea, China, India, Australia, Indonesia, Italy, Spain, France, Germany, UK, The Netherlands, US, Canada, Mexico, UAE, Saudi Arabia, South Africa, Egypt, Qatar, Brazil, Argentina and Chile
Competitive landscape Leading Companies, Market Positioning of Companies, Competitive Strategies, and Industry Risks

Request Free Sample

Research Analyst Overview

  • The smart toilet market's evolution reflects a definitive shift from luxury amenities to essential wellness and sustainability tools. This transition is underpinned by the integration of medical-grade sensors and high-precision biosensors, enabling functions like passive health monitoring and real-time diagnostics through a urine analysis sensor.
  • A core boardroom-level decision for manufacturers is prioritizing investment between developing these advanced health monitoring platforms and refining water-saving technologies, such as dual-flush mechanisms, to meet increasingly strict environmental regulations. Many advanced models already achieve a 30% reduction in water consumption.
  • The sector's momentum is sustained by the demand for assistive technologies and inclusive design principles to support aging populations, incorporating features like fall-detection sensors and automatic lid operation. As ceramic sanitaryware becomes more intelligent with connectivity modules and motion sensors, the focus remains on delivering a seamless user experience through personalized climate controls and touchless interfaces.
  • The challenge lies in creating devices that are both technologically sophisticated with features like ultraviolet disinfection and accessible to a broader consumer base.

What are the Key Data Covered in this Smart Toilet Market Research and Growth Report?

  • What is the expected growth of the Smart Toilet Market between 2026 and 2030?

    • USD 7.49 billion, at a CAGR of 10.6%

  • What segmentation does the market report cover?

    • The report is segmented by Application (Commercial, and Residential), Distribution Channel (Offline, and Online), Product Type (Integrated smart toilets, Smart bidet seats, Wall-hung toilets, and Smart toilet seats), Connectivity (Bluetooth, and Wi-Fi enabled) and Geography (APAC, Europe, North America, Middle East and Africa, South America)

  • Which regions are analyzed in the report?

    • APAC, Europe, North America, Middle East and Africa and South America

  • What are the key growth drivers and market challenges?

    • Global demographic aging and assisted living mobility requirements, Technical debt of fragmented interoperability standards and maintenance

  • Who are the major players in the Smart Toilet Market?

    • Bio Bidet, Brondell Inc., Coway Co. Ltd., Duravit AG, Geberit International AG, Hindware Home Innovation Ltd., Huida Sanitary Ware Co. Ltd., Jaquar Group, JOMOO Kitchen and Bath Co., Kohler Co., LIXIL Corp., Moen Inc., Orans srl, Panasonic Holdings Corp., Roca Sanitario S.A., Splendid Sanitary Ware World, Toto Ltd., Villeroy and Boch AG, VitrA and VOVO USA

Market Research Insights

  • The smart toilet market is shaped by a confluence of technological innovation and practical consumer demands. Key drivers include the push for aging-in-place technologies and advanced health monitoring, which are transitioning these fixtures into components of the digital health ecosystem.
  • However, the market faces significant challenges, including fragmented interoperability standards, where nearly 30% of technical failures are attributed to software incompatibilities. The high cost of premium hardware and professional installations also remains a barrier. Concurrently, a major trend is the development of eco-integrated sanitation systems designed to align with green building certifications.
  • These systems can reduce water usage by over 30% compared to traditional models, addressing global water scarcity concerns. This dynamic creates a competitive landscape where vendors must balance advanced features with cost, usability, and sustainability to achieve broader market penetration.

We can help! Our analysts can customize this smart toilet market research report to meet your requirements.

Get in touch

1. Executive Summary

1.1 Market overview

Executive Summary - Chart on Market Overview
Executive Summary - Data Table on Market Overview
Executive Summary - Chart on Global Market Characteristics
Executive Summary - Chart on Market by Geography
Executive Summary - Chart on Market Segmentation by Application
Executive Summary - Chart on Market Segmentation by Distribution Channel
Executive Summary - Chart on Market Segmentation by Product Type
Executive Summary - Chart on Market Segmentation by Connectivity
Executive Summary - Chart on Incremental Growth
Executive Summary - Data Table on Incremental Growth
Executive Summary - Chart on Company Market Positioning

2. Technavio Analysis

2.1 Analysis of price sensitivity, lifecycle, customer purchase basket, adoption rates, and purchase criteria

2.2 Criticality of inputs and Factors of differentiation

Chart on Overview on criticality of inputs and factors of differentiation

2.3 Factors of disruption

Chart on Overview on factors of disruption

2.4 Impact of drivers and challenges

Chart on Impact of drivers and challenges in 2025 and 2030

3. Market Landscape

3.1 Market ecosystem

Chart on Parent Market
Data Table on - Parent Market

3.2 Market characteristics

Chart on Market characteristics analysis

3.3 Value chain analysis

Chart on Value chain analysis

4. Market Sizing

4.1 Market definition

Data Table on Offerings of companies included in the market definition

4.2 Market segment analysis

Market segments

4.3 Market size 2025

4.4 Market outlook: Forecast for 2025-2030

Chart on Global - Market size and forecast 2025-2030 ($ million)
Data Table on Global - Market size and forecast 2025-2030 ($ million)
Chart on Global Market: Year-over-year growth 2025-2030 (%)
Data Table on Global Market: Year-over-year growth 2025-2030 (%)

5. Historic Market Size

5.1 Global Smart Toilet Market 2020 - 2024

Historic Market Size - Data Table on Global Smart Toilet Market 2020 - 2024 ($ million)

5.2 Application segment analysis 2020 - 2024

Historic Market Size - Application Segment 2020 - 2024 ($ million)

5.3 Distribution Channel segment analysis 2020 - 2024

Historic Market Size - Distribution Channel Segment 2020 - 2024 ($ million)

5.4 Product Type segment analysis 2020 - 2024

Historic Market Size - Product Type Segment 2020 - 2024 ($ million)

5.5 Connectivity segment analysis 2020 - 2024

Historic Market Size - Connectivity Segment 2020 - 2024 ($ million)

5.6 Geography segment analysis 2020 - 2024

Historic Market Size - Geography Segment 2020 - 2024 ($ million)

5.7 Country segment analysis 2020 - 2024

Historic Market Size - Country Segment 2020 - 2024 ($ million)

6. Qualitative Analysis

6.1 Impact of AI in global smart toilet market

6.2 Impact of geopolitical conflict for global smart toilet market

7. Five Forces Analysis

7.1 Five forces summary

Five forces analysis - Comparison between 2025 and 2030

7.2 Bargaining power of buyers

Bargaining power of buyers - Impact of key factors 2025 and 2030

7.3 Bargaining power of suppliers

Bargaining power of suppliers - Impact of key factors in 2025 and 2030

7.4 Threat of new entrants

Threat of new entrants - Impact of key factors in 2025 and 2030

7.5 Threat of substitutes

Threat of substitutes - Impact of key factors in 2025 and 2030

7.6 Threat of rivalry

Threat of rivalry - Impact of key factors in 2025 and 2030

7.7 Market condition

Chart on Market condition - Five forces 2025 and 2030

8. Market Segmentation by Application

8.1 Market segments

Chart on Application - Market share 2025-2030 (%)
Data Table on Application - Market share 2025-2030 (%)

8.2 Comparison by Application

Chart on Comparison by Application
Data Table on Comparison by Application

8.3 Commercial - Market size and forecast 2025-2030

Chart on Commercial - Market size and forecast 2025-2030 ($ million)
Data Table on Commercial - Market size and forecast 2025-2030 ($ million)
Chart on Commercial - Year-over-year growth 2025-2030 (%)
Data Table on Commercial - Year-over-year growth 2025-2030 (%)

8.4 Residential - Market size and forecast 2025-2030

Chart on Residential - Market size and forecast 2025-2030 ($ million)
Data Table on Residential - Market size and forecast 2025-2030 ($ million)
Chart on Residential - Year-over-year growth 2025-2030 (%)
Data Table on Residential - Year-over-year growth 2025-2030 (%)

8.5 Market opportunity by Application

Market opportunity by Application ($ million)
Data Table on Market opportunity by Application ($ million)

9. Market Segmentation by Distribution Channel

9.1 Market segments

Chart on Distribution Channel - Market share 2025-2030 (%)
Data Table on Distribution Channel - Market share 2025-2030 (%)

9.2 Comparison by Distribution Channel

Chart on Comparison by Distribution Channel
Data Table on Comparison by Distribution Channel

9.3 Offline - Market size and forecast 2025-2030

Chart on Offline - Market size and forecast 2025-2030 ($ million)
Data Table on Offline - Market size and forecast 2025-2030 ($ million)
Chart on Offline - Year-over-year growth 2025-2030 (%)
Data Table on Offline - Year-over-year growth 2025-2030 (%)

9.4 Online - Market size and forecast 2025-2030

Chart on Online - Market size and forecast 2025-2030 ($ million)
Data Table on Online - Market size and forecast 2025-2030 ($ million)
Chart on Online - Year-over-year growth 2025-2030 (%)
Data Table on Online - Year-over-year growth 2025-2030 (%)

9.5 Market opportunity by Distribution Channel

Market opportunity by Distribution Channel ($ million)
Data Table on Market opportunity by Distribution Channel ($ million)

10. Market Segmentation by Product Type

10.1 Market segments

Chart on Product Type - Market share 2025-2030 (%)
Data Table on Product Type - Market share 2025-2030 (%)

10.2 Comparison by Product Type

Chart on Comparison by Product Type
Data Table on Comparison by Product Type

10.3 Integrated smart toilets - Market size and forecast 2025-2030

Chart on Integrated smart toilets - Market size and forecast 2025-2030 ($ million)
Data Table on Integrated smart toilets - Market size and forecast 2025-2030 ($ million)
Chart on Integrated smart toilets - Year-over-year growth 2025-2030 (%)
Data Table on Integrated smart toilets - Year-over-year growth 2025-2030 (%)

10.4 Smart bidet seats - Market size and forecast 2025-2030

Chart on Smart bidet seats - Market size and forecast 2025-2030 ($ million)
Data Table on Smart bidet seats - Market size and forecast 2025-2030 ($ million)
Chart on Smart bidet seats - Year-over-year growth 2025-2030 (%)
Data Table on Smart bidet seats - Year-over-year growth 2025-2030 (%)

10.5 Wall-hung toilets - Market size and forecast 2025-2030

Chart on Wall-hung toilets - Market size and forecast 2025-2030 ($ million)
Data Table on Wall-hung toilets - Market size and forecast 2025-2030 ($ million)
Chart on Wall-hung toilets - Year-over-year growth 2025-2030 (%)
Data Table on Wall-hung toilets - Year-over-year growth 2025-2030 (%)

10.6 Smart toilet seats - Market size and forecast 2025-2030

Chart on Smart toilet seats - Market size and forecast 2025-2030 ($ million)
Data Table on Smart toilet seats - Market size and forecast 2025-2030 ($ million)
Chart on Smart toilet seats - Year-over-year growth 2025-2030 (%)
Data Table on Smart toilet seats - Year-over-year growth 2025-2030 (%)

10.7 Market opportunity by Product Type

Market opportunity by Product Type ($ million)
Data Table on Market opportunity by Product Type ($ million)

11. Market Segmentation by Connectivity

11.1 Market segments

Chart on Connectivity - Market share 2025-2030 (%)
Data Table on Connectivity - Market share 2025-2030 (%)

11.2 Comparison by Connectivity

Chart on Comparison by Connectivity
Data Table on Comparison by Connectivity

11.3 Bluetooth - Market size and forecast 2025-2030

Chart on Bluetooth - Market size and forecast 2025-2030 ($ million)
Data Table on Bluetooth - Market size and forecast 2025-2030 ($ million)
Chart on Bluetooth - Year-over-year growth 2025-2030 (%)
Data Table on Bluetooth - Year-over-year growth 2025-2030 (%)

11.4 Wi-Fi enabled - Market size and forecast 2025-2030

Chart on Wi-Fi enabled - Market size and forecast 2025-2030 ($ million)
Data Table on Wi-Fi enabled - Market size and forecast 2025-2030 ($ million)
Chart on Wi-Fi enabled - Year-over-year growth 2025-2030 (%)
Data Table on Wi-Fi enabled - Year-over-year growth 2025-2030 (%)

11.5 Market opportunity by Connectivity

Market opportunity by Connectivity ($ million)
Data Table on Market opportunity by Connectivity ($ million)

12. Customer Landscape

12.1 Customer landscape overview

Analysis of price sensitivity, lifecycle, customer purchase basket, adoption rates, and purchase criteria

13. Geographic Landscape

13.1 Geographic segmentation

Chart on Market share by geography 2025-2030 (%)
Data Table on Market share by geography 2025-2030 (%)

13.2 Geographic comparison

Chart on Geographic comparison
Data Table on Geographic comparison

13.3 APAC - Market size and forecast 2025-2030

Chart on APAC - Market size and forecast 2025-2030 ($ million)
Data Table on APAC - Market size and forecast 2025-2030 ($ million)
Chart on APAC - Year-over-year growth 2025-2030 (%)
Data Table on APAC - Year-over-year growth 2025-2030 (%)
Chart on Regional Comparison - APAC
Data Table on Regional Comparison - APAC

13.3.1 Japan - Market size and forecast 2025-2030

Chart on Japan - Market size and forecast 2025-2030 ($ million)
Data Table on Japan - Market size and forecast 2025-2030 ($ million)
Chart on Japan - Year-over-year growth 2025-2030 (%)
Data Table on Japan - Year-over-year growth 2025-2030 (%)

13.3.2 South Korea - Market size and forecast 2025-2030

Chart on South Korea - Market size and forecast 2025-2030 ($ million)
Data Table on South Korea - Market size and forecast 2025-2030 ($ million)
Chart on South Korea - Year-over-year growth 2025-2030 (%)
Data Table on South Korea - Year-over-year growth 2025-2030 (%)

13.3.3 China - Market size and forecast 2025-2030

Chart on China - Market size and forecast 2025-2030 ($ million)
Data Table on China - Market size and forecast 2025-2030 ($ million)
Chart on China - Year-over-year growth 2025-2030 (%)
Data Table on China - Year-over-year growth 2025-2030 (%)

13.3.4 India - Market size and forecast 2025-2030

Chart on India - Market size and forecast 2025-2030 ($ million)
Data Table on India - Market size and forecast 2025-2030 ($ million)
Chart on India - Year-over-year growth 2025-2030 (%)
Data Table on India - Year-over-year growth 2025-2030 (%)

13.3.5 Australia - Market size and forecast 2025-2030

Chart on Australia - Market size and forecast 2025-2030 ($ million)
Data Table on Australia - Market size and forecast 2025-2030 ($ million)
Chart on Australia - Year-over-year growth 2025-2030 (%)
Data Table on Australia - Year-over-year growth 2025-2030 (%)

13.3.6 Indonesia - Market size and forecast 2025-2030

Chart on Indonesia - Market size and forecast 2025-2030 ($ million)
Data Table on Indonesia - Market size and forecast 2025-2030 ($ million)
Chart on Indonesia - Year-over-year growth 2025-2030 (%)
Data Table on Indonesia - Year-over-year growth 2025-2030 (%)

13.4 Europe - Market size and forecast 2025-2030

Chart on Europe - Market size and forecast 2025-2030 ($ million)
Data Table on Europe - Market size and forecast 2025-2030 ($ million)
Chart on Europe - Year-over-year growth 2025-2030 (%)
Data Table on Europe - Year-over-year growth 2025-2030 (%)
Chart on Regional Comparison - Europe
Data Table on Regional Comparison - Europe

13.4.1 Italy - Market size and forecast 2025-2030

Chart on Italy - Market size and forecast 2025-2030 ($ million)
Data Table on Italy - Market size and forecast 2025-2030 ($ million)
Chart on Italy - Year-over-year growth 2025-2030 (%)
Data Table on Italy - Year-over-year growth 2025-2030 (%)

13.4.2 Spain - Market size and forecast 2025-2030

Chart on Spain - Market size and forecast 2025-2030 ($ million)
Data Table on Spain - Market size and forecast 2025-2030 ($ million)
Chart on Spain - Year-over-year growth 2025-2030 (%)
Data Table on Spain - Year-over-year growth 2025-2030 (%)

13.4.3 France - Market size and forecast 2025-2030

Chart on France - Market size and forecast 2025-2030 ($ million)
Data Table on France - Market size and forecast 2025-2030 ($ million)
Chart on France - Year-over-year growth 2025-2030 (%)
Data Table on France - Year-over-year growth 2025-2030 (%)

13.4.4 Germany - Market size and forecast 2025-2030

Chart on Germany - Market size and forecast 2025-2030 ($ million)
Data Table on Germany - Market size and forecast 2025-2030 ($ million)
Chart on Germany - Year-over-year growth 2025-2030 (%)
Data Table on Germany - Year-over-year growth 2025-2030 (%)

13.4.5 UK - Market size and forecast 2025-2030

Chart on UK - Market size and forecast 2025-2030 ($ million)
Data Table on UK - Market size and forecast 2025-2030 ($ million)
Chart on UK - Year-over-year growth 2025-2030 (%)
Data Table on UK - Year-over-year growth 2025-2030 (%)

13.4.6 The Netherlands - Market size and forecast 2025-2030

Chart on The Netherlands - Market size and forecast 2025-2030 ($ million)
Data Table on The Netherlands - Market size and forecast 2025-2030 ($ million)
Chart on The Netherlands - Year-over-year growth 2025-2030 (%)
Data Table on The Netherlands - Year-over-year growth 2025-2030 (%)

13.5 North America - Market size and forecast 2025-2030

Chart on North America - Market size and forecast 2025-2030 ($ million)
Data Table on North America - Market size and forecast 2025-2030 ($ million)
Chart on North America - Year-over-year growth 2025-2030 (%)
Data Table on North America - Year-over-year growth 2025-2030 (%)
Chart on Regional Comparison - North America
Data Table on Regional Comparison - North America

13.5.1 US - Market size and forecast 2025-2030

Chart on US - Market size and forecast 2025-2030 ($ million)
Data Table on US - Market size and forecast 2025-2030 ($ million)
Chart on US - Year-over-year growth 2025-2030 (%)
Data Table on US - Year-over-year growth 2025-2030 (%)

13.5.2 Canada - Market size and forecast 2025-2030

Chart on Canada - Market size and forecast 2025-2030 ($ million)
Data Table on Canada - Market size and forecast 2025-2030 ($ million)
Chart on Canada - Year-over-year growth 2025-2030 (%)
Data Table on Canada - Year-over-year growth 2025-2030 (%)

13.5.3 Mexico - Market size and forecast 2025-2030

Chart on Mexico - Market size and forecast 2025-2030 ($ million)
Data Table on Mexico - Market size and forecast 2025-2030 ($ million)
Chart on Mexico - Year-over-year growth 2025-2030 (%)
Data Table on Mexico - Year-over-year growth 2025-2030 (%)

13.6 Middle East and Africa - Market size and forecast 2025-2030

Chart on Middle East and Africa - Market size and forecast 2025-2030 ($ million)
Data Table on Middle East and Africa - Market size and forecast 2025-2030 ($ million)
Chart on Middle East and Africa - Year-over-year growth 2025-2030 (%)
Data Table on Middle East and Africa - Year-over-year growth 2025-2030 (%)
Chart on Regional Comparison - Middle East and Africa
Data Table on Regional Comparison - Middle East and Africa

13.6.1 UAE - Market size and forecast 2025-2030

Chart on UAE - Market size and forecast 2025-2030 ($ million)
Data Table on UAE - Market size and forecast 2025-2030 ($ million)
Chart on UAE - Year-over-year growth 2025-2030 (%)
Data Table on UAE - Year-over-year growth 2025-2030 (%)

13.6.2 Saudi Arabia - Market size and forecast 2025-2030

Chart on Saudi Arabia - Market size and forecast 2025-2030 ($ million)
Data Table on Saudi Arabia - Market size and forecast 2025-2030 ($ million)
Chart on Saudi Arabia - Year-over-year growth 2025-2030 (%)
Data Table on Saudi Arabia - Year-over-year growth 2025-2030 (%)

13.6.3 South Africa - Market size and forecast 2025-2030

Chart on South Africa - Market size and forecast 2025-2030 ($ million)
Data Table on South Africa - Market size and forecast 2025-2030 ($ million)
Chart on South Africa - Year-over-year growth 2025-2030 (%)
Data Table on South Africa - Year-over-year growth 2025-2030 (%)

13.6.4 Egypt - Market size and forecast 2025-2030

Chart on Egypt - Market size and forecast 2025-2030 ($ million)
Data Table on Egypt - Market size and forecast 2025-2030 ($ million)
Chart on Egypt - Year-over-year growth 2025-2030 (%)
Data Table on Egypt - Year-over-year growth 2025-2030 (%)

13.6.5 Qatar - Market size and forecast 2025-2030

Chart on Qatar - Market size and forecast 2025-2030 ($ million)
Data Table on Qatar - Market size and forecast 2025-2030 ($ million)
Chart on Qatar - Year-over-year growth 2025-2030 (%)
Data Table on Qatar - Year-over-year growth 2025-2030 (%)

13.7 South America - Market size and forecast 2025-2030

Chart on South America - Market size and forecast 2025-2030 ($ million)
Data Table on South America - Market size and forecast 2025-2030 ($ million)
Chart on South America - Year-over-year growth 2025-2030 (%)
Data Table on South America - Year-over-year growth 2025-2030 (%)
Chart on Regional Comparison - South America
Data Table on Regional Comparison - South America

13.7.1 Brazil - Market size and forecast 2025-2030

Chart on Brazil - Market size and forecast 2025-2030 ($ million)
Data Table on Brazil - Market size and forecast 2025-2030 ($ million)
Chart on Brazil - Year-over-year growth 2025-2030 (%)
Data Table on Brazil - Year-over-year growth 2025-2030 (%)

13.7.2 Argentina - Market size and forecast 2025-2030

Chart on Argentina - Market size and forecast 2025-2030 ($ million)
Data Table on Argentina - Market size and forecast 2025-2030 ($ million)
Chart on Argentina - Year-over-year growth 2025-2030 (%)
Data Table on Argentina - Year-over-year growth 2025-2030 (%)

13.7.3 Chile - Market size and forecast 2025-2030

Chart on Chile - Market size and forecast 2025-2030 ($ million)
Data Table on Chile - Market size and forecast 2025-2030 ($ million)
Chart on Chile - Year-over-year growth 2025-2030 (%)
Data Table on Chile - Year-over-year growth 2025-2030 (%)

13.8 Market opportunity by geography

Market opportunity by geography ($ million)
Data Tables on Market opportunity by geography ($ million)

14. Drivers, Challenges, and Opportunity

14.1 Market drivers

Global demographic aging and assisted living mobility requirements
Technological integration and advanced monitoring innovations
Rising water scarcity and eco-friendly infrastructure regulations

14.2 Market challenges

Technical debt of fragmented interoperability standards and maintenance
High financial barrier of premium hardware and professional installations
Escalation of cybersecurity vulnerabilities and sensitive health data privacy

14.3 Impact of drivers and challenges

Impact of drivers and challenges in 2025 and 2030

14.4 Market opportunities

Institutionalization of AI-enabled passive health monitoring and diagnostics
Growth of sustainable water recycling and resource conservation systems
Expansion of interconnected smart home ecosystem integration

15. Competitive Landscape

15.1 Overview

15.2

Overview on criticality of inputs and factors of differentiation

15.3 Landscape disruption

Overview on factors of disruption

15.4 Industry risks

Impact of key risks on business

16. Competitive Analysis

16.1 Companies profiled

Companies covered

16.2 Company ranking index

16.3 Market positioning of companies

Matrix on companies position and classification

16.4 Brondell Inc.

Brondell Inc. - Overview
Brondell Inc. - Product / Service
Brondell Inc. - Key offerings
SWOT

16.5 Coway Co. Ltd.

Coway Co. Ltd. - Overview
Coway Co. Ltd. - Product / Service
Coway Co. Ltd. - Key offerings
SWOT

16.6 Duravit AG

Duravit AG - Overview
Duravit AG - Product / Service
Duravit AG - Key offerings
SWOT

16.7 Geberit International AG

Geberit International AG - Overview
Geberit International AG - Business segments
Geberit International AG - Key offerings
Geberit International AG - Segment focus
SWOT

16.8 Hindware Home Innovation Ltd.

Hindware Home Innovation Ltd. - Overview
Hindware Home Innovation Ltd. - Business segments
Hindware Home Innovation Ltd. - Key offerings
Hindware Home Innovation Ltd. - Segment focus
SWOT

16.9 Jaquar Group

Jaquar Group - Overview
Jaquar Group - Product / Service
Jaquar Group - Key offerings
SWOT

16.10 Kohler Co.

Kohler Co. - Overview
Kohler Co. - Product / Service
Kohler Co. - Key offerings
SWOT

16.11 LIXIL Corp.

LIXIL Corp. - Overview
LIXIL Corp. - Business segments
LIXIL Corp. - Key offerings
LIXIL Corp. - Segment focus
SWOT

16.12 Moen Inc.

Moen Inc. - Overview
Moen Inc. - Product / Service
Moen Inc. - Key offerings
SWOT

16.13 Orans srl

Orans srl - Overview
Orans srl - Product / Service
Orans srl - Key offerings
SWOT

16.14 Panasonic Holdings Corp.

Panasonic Holdings Corp. - Overview
Panasonic Holdings Corp. - Business segments
Panasonic Holdings Corp. - Key news
Panasonic Holdings Corp. - Key offerings
Panasonic Holdings Corp. - Segment focus
SWOT

16.15 Roca Sanitario S.A.

Roca Sanitario S.A. - Overview
Roca Sanitario S.A. - Product / Service
Roca Sanitario S.A. - Key offerings
SWOT

16.16 Toto Ltd.

Toto Ltd. - Overview
Toto Ltd. - Business segments
Toto Ltd. - Key offerings
Toto Ltd. - Segment focus
SWOT

16.17 Villeroy and Boch AG

Villeroy and Boch AG - Overview
Villeroy and Boch AG - Business segments
Villeroy and Boch AG - Key news
Villeroy and Boch AG - Key offerings
Villeroy and Boch AG - Segment focus
SWOT

16.18 VitrA

VitrA - Overview
VitrA - Product / Service
VitrA - Key offerings
SWOT

17. Appendix

17.1 Scope of the report

Market definition
Objectives
Notes and caveats

17.2 Inclusions and exclusions checklist

Inclusions checklist
Exclusions checklist

17.3 Currency conversion rates for US$

17.4 Research methodology

17.5 Data procurement

Information sources

17.6 Data validation

17.7 Validation techniques employed for market sizing

17.8 Data synthesis

17.9 360 degree market analysis

17.10 List of abbreviations

Research Methodology

Technavio presents a detailed picture of the market by way of study, synthesis, and summation of data from multiple sources. The analysts have presented the various facets of the market with a particular focus on identifying the key industry influencers. The data thus presented is comprehensive, reliable, and the result of extensive research, both primary and secondary.

INFORMATION SOURCES

Primary sources

  • Manufacturers and suppliers
  • Channel partners
  • Industry experts
  • Strategic decision makers

Secondary sources

  • Industry journals and periodicals
  • Government data
  • Financial reports of key industry players
  • Historical data
  • Press releases

DATA ANALYSIS

Data Synthesis

  • Collation of data
  • Estimation of key figures
  • Analysis of derived insights

Data Validation

  • Triangulation with data models
  • Reference against proprietary databases
  • Corroboration with industry experts

REPORT WRITING

Qualitative

  • Market drivers
  • Market challenges
  • Market trends
  • Five forces analysis

Quantitative

  • Market size and forecast
  • Market segmentation
  • Geographical insights
  • Competitive landscape

Interested in this report?

Get your sample now to see our research methodology and insights!

Download Now

Frequently Asked Questions

Smart Toilet market growth will increase by USD 7489.4 million during 2026-2030.

The Smart Toilet market is expected to grow at a CAGR of 10.6% during 2026-2030.

Smart Toilet market is segmented by Application (Commercial, Residential) Distribution channel (Offline, Online) Product type (Integrated smart toilets, Smart bidet seats, Wall-hung toilets, Smart toilet seats) Connectivity (Bluetooth, Wi-Fi enabled)

Bio Bidet, Brondell Inc., Coway Co. Ltd., Duravit AG, Geberit International AG, Hindware Home Innovation Ltd., Huida Sanitary Ware Co. Ltd., Jaquar Group, JOMOO Kitchen and Bath Co., Kohler Co., LIXIL Corp., Moen Inc., Orans srl, Panasonic Holdings Corp., Roca Sanitario S.A., Splendid Sanitary Ware World, Toto Ltd., Villeroy and Boch AG, VitrA, VOVO USA are a few of the key vendors in the Smart Toilet market.

APAC will register the highest growth rate of 38% among the other regions. Therefore, the Smart Toilet market in APAC is expected to garner significant business opportunities for the vendors during the forecast period.

Japan, South Korea, China, India, Australia, Indonesia, Italy, Spain, France, Germany, UK, The Netherlands, US, Canada, Mexico, UAE, Saudi Arabia, South Africa, Egypt, Qatar, Brazil, Argentina, Chile

  • Global demographic aging and assisted living mobility requirements is the driving factor this market.

The Smart Toilet market vendors should focus on grabbing business opportunities from the Application segment as it accounted for the largest market share in the base year.
RIA - Research AI Assistant
Ask RIA