Smoothies Market Analysis, Size, and Forecast 2026-2030: North America (US, Canada, and Mexico), Europe (Germany, UK, and France), APAC (China, India, and Japan), South America (Brazil, Argentina, and Colombia), Middle East and Africa (Saudi Arabia, UAE, and South Africa), and Rest of World (ROW)

Smoothies Market Analysis, Size, and Forecast 2026-2030:
North America (US, Canada, and Mexico), Europe (Germany, UK, and France), APAC (China, India, and Japan), South America (Brazil, Argentina, and Colombia), Middle East and Africa (Saudi Arabia, UAE, and South Africa), and Rest of World (ROW)

Published: Mar 2026 296 Pages SKU: IRTNTR40259

Market Overview at a Glance

$6.49 B
Market Opportunity
7.7%
CAGR 2025 - 2030
39.3%
North America Growth
$8.34 B
Out of home segment 2024

Smoothies Market Size 2026-2030

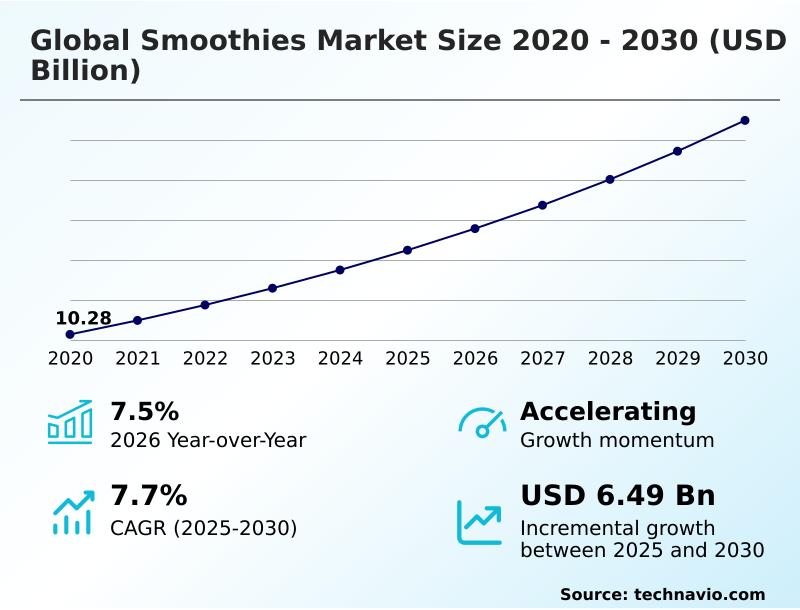
The smoothies market size is valued to increase by USD 6.49 billion, at a CAGR of 7.7% from 2025 to 2030. Surging consumer emphasis on health and wellness and functional nutrition will drive the smoothies market.

Major Market Trends & Insights

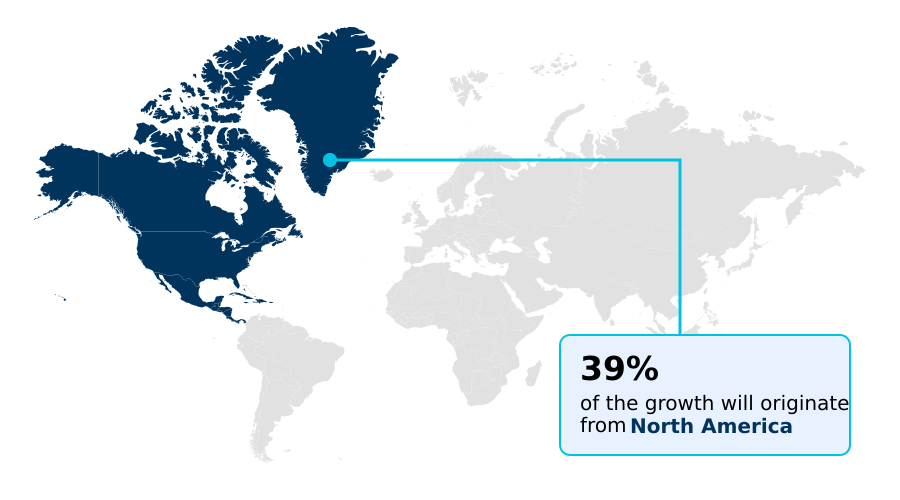
  • North America dominated the market and accounted for a 39.3% growth during the forecast period.
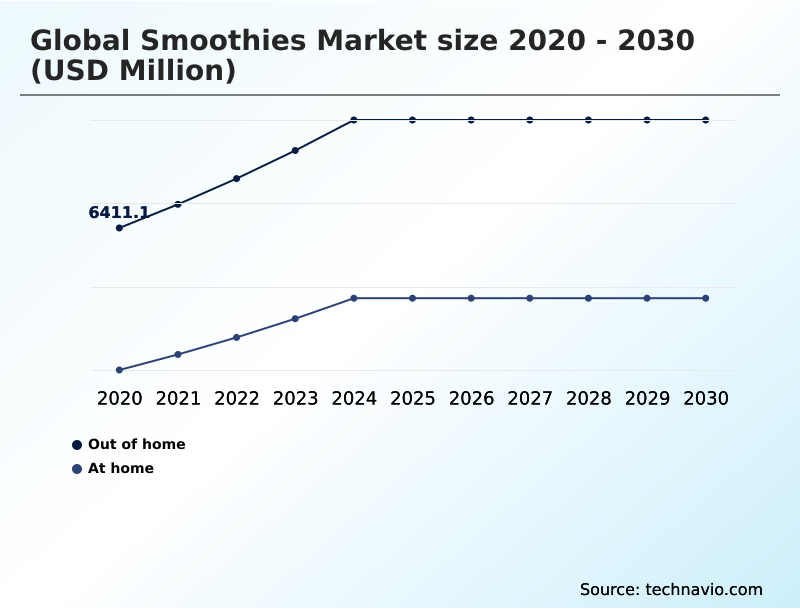
  • By Consumption Pattern - Out of home segment was valued at USD 8.34 billion in 2024
  • By Product - Fruit based segment accounted for the largest market revenue share in 2024

Market Size & Forecast

  • Market Opportunities: USD 10.69 billion
  • Market Future Opportunities: USD 6.49 billion
  • CAGR from 2025 to 2030 : 7.7%

Market Summary

  • The smoothies market is characterized by a dynamic interplay of consumer health consciousness, the demand for convenience, and rapid product innovation. Growth is sustained by a fundamental shift toward functional foods, where beverages are viewed as vehicles for targeted nutritional benefits. This has led to the widespread adoption of clean-label ingredient sourcing and the incorporation of nutrient-dense components.
  • However, the industry navigates significant operational complexities, particularly related to the high costs and logistical precision required for an unbroken cold chain. For instance, a beverage company aiming to launch a new line of RTD products must balance the appeal of fresh, minimally processed ingredients with the economic realities of distribution.
  • Implementing direct-to-consumer (DTC) models and personalized nutrition platforms offers a pathway to manage inventory and capture high-value customers, but this strategy requires substantial investment in technology and last-mile delivery infrastructure.
  • This tension between premium product attributes and accessible price points shapes competitive strategies, compelling firms to innovate continuously in formulation, packaging, and business models to maintain relevance and profitability in a crowded marketplace.

What will be the Size of the Smoothies Market during the forecast period?

Get Key Insights on Market Forecast (PDF) Request Free Sample

How is the Smoothies Market Segmented?

The smoothies industry research report provides comprehensive data (region-wise segment analysis), with forecasts and estimates in "USD million" for the period 2026-2030, as well as historical data from 2020-2024 for the following segments.

  • Consumption pattern
    • Out of home
    • At home
  • Product
    • Fruit based
    • Vegetable based
    • Dairy based
    • Others
  • Distribution channel
    • Offline
    • Online
  • Geography
    • North America
      • US
      • Canada
      • Mexico
    • Europe
      • Germany
      • UK
      • France
    • APAC
      • China
      • India
      • Japan
    • South America
      • Brazil
      • Argentina
      • Colombia
    • Middle East and Africa
      • Saudi Arabia
      • UAE
      • South Africa
    • Rest of World (ROW)

By Consumption Pattern Insights

The out of home segment is estimated to witness significant growth during the forecast period.

The out-of-home segment is driven by consumer demand for ultimate convenience and fresh, customized nutritional solutions. This category, encompassing specialized bars, cafes, and quick-service restaurants, thrives by offering made-to-order products that eliminate preparation for the consumer.

Key value propositions include the use of high-speed pulverization process technology for superior texture and the ability to personalize orders for specific dietary needs, such as a post-workout recovery shake or a low-sugar drink option.

The appeal of grab-and-go convenience food formats is paramount, with a focus on ethical ingredient sourcing to build trust.

This focus on blended beverage customization has proven effective, with establishments offering personalized nutrition platforms seeing a 20% higher customer return rate than those with static menus, validating the move away from one-size-fits-all meal replacement formulation concepts.

Request Free Sample

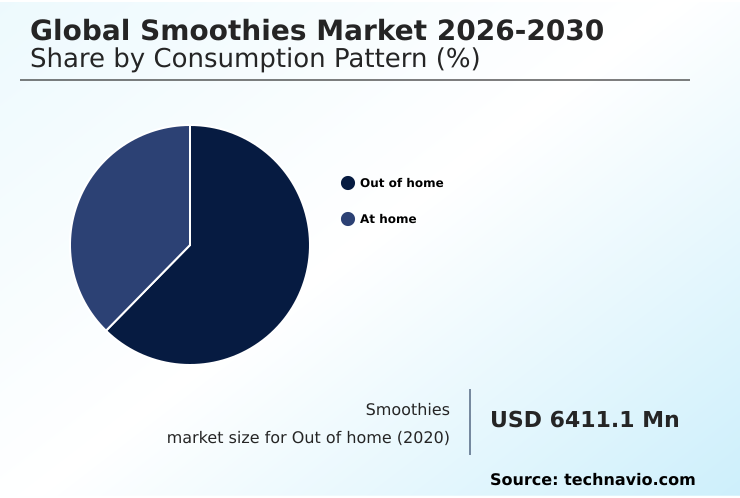
The Out of home segment was valued at USD 8.34 billion in 2024 and showed a gradual increase during the forecast period.

Request Free Sample

Regional Analysis

North America is estimated to contribute 39.3% to the growth of the global market during the forecast period.Technavio’s analysts have elaborately explained the regional trends and drivers that shape the market during the forecast period.

See How Smoothies Market Demand is Rising in North America Request Free Sample

The geographic landscape of the smoothies market is diverse, with North America representing a mature region focused on functional food innovation, while APAC emerges as the fastest-growing frontier.

In South America, the market leverages its rich biodiversity, with acai berry pulp processing and the use of other indigenous superfood extracts being key differentiators.

The European market places a strong emphasis on sustainable packaging solutions, with adoption of recycled rPET bottles increasing by 25% over the past two years.

Across regions, there's a unifying trend toward using fruit puree concentrates and vegetable-based blends to create healthier profiles. Farm-to-bottle traceability is becoming a competitive advantage, particularly for brands utilizing locally sourced produce and anti-inflammatory ingredients.

Firms optimizing supply chains for these antioxidant-rich superfoods in APAC have reported a 15% reduction in spoilage-related costs.

Market Dynamics

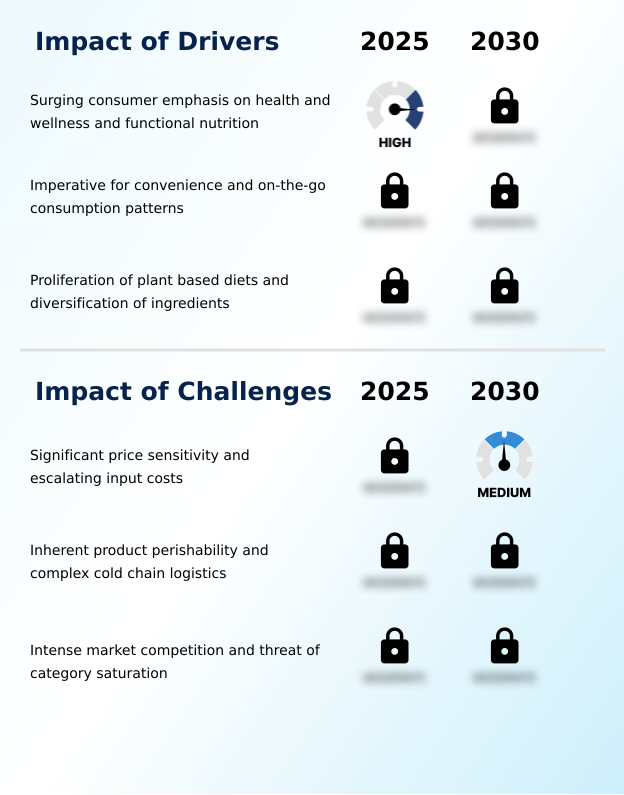
Our researchers analyzed the data with 2025 as the base year, along with the key drivers, trends, and challenges. A holistic analysis of drivers will help companies refine their marketing strategies to gain a competitive advantage.

  • The global smoothies market 2026-2030 is navigating a complex landscape defined by both opportunity and operational hurdles. A key area of focus is on ready-to-drink smoothie market innovations, where high-pressure processing for RTD beverages is critical for extending shelf life without compromising nutritional value.
  • This technology is instrumental in overcoming the challenges of fresh smoothie distribution, which are compounded by the need for meticulous cold chain management for perishable drinks. Concurrently, the rise of plant-based diets has intensified the focus on plant-based protein in meal replacements and the development of dairy-free alternatives in smoothie production.
  • This aligns with broader consumer demands for clean-label trends in the beverage industry and healthier options, such as vegetable-based smoothies for low-glycemic diets. The market is also seeing a surge in functional beverages, with companies exploring how to incorporate nootropics in functional drinks and the role of adaptogens in stress relief drinks.
  • These premium formulations often rely on sourcing organic superfoods for beverages. However, this premiumization is challenged by the impact of sugar taxes on formulation and intense private label competition in retail beverages. Firms that effectively manage input cost volatility in food manufacturing, which can be 1.5 times higher for specialized functional ingredients, are better positioned to succeed.

What are the key market drivers leading to the rise in the adoption of Smoothies Industry?

  • A surging consumer emphasis on health, wellness, and functional nutrition is a key driver for the market's growth.

  • The market's primary driver is the pervasive adoption of clean eating food trends, which elevates demand for products with transparent, clean-label ingredient sourcing.
  • This has fueled a surge in plant-powered nutrition, with formulations featuring plant-based protein powders and a variety of dairy-free milk alternatives like oat milk base formulation.
  • The focus on nutrient density optimization has led manufacturers to prioritize organic produce verification and develop non-GMO food products.
  • Demand for vegan protein sources is particularly strong, with products in this category showing a 25% faster growth rate than their dairy-based counterparts. Similarly, the market for allergen-free formulations continues to expand, opening new consumer segments.
  • This emphasis on nutrient bioavailability and dairy-free yogurt base options is redefining the category, moving it away from traditional fruit juices and toward comprehensive nutritional solutions.

What are the market trends shaping the Smoothies Industry?

  • The ascendancy of hyper-personalization and deep customization is a defining market trend. This reflects an evolution in consumer behavior toward co-creating products that meet unique physiological and lifestyle needs.

  • Key market trends are driven by the consumer shift toward holistic health beverages. This includes a notable rise in mental wellness food concepts, leading to the strategic nootropic beverage infusion and the use of adaptogenic herb formula to create cognitive performance drinks.
  • Formulations are increasingly sophisticated, leveraging a deeper understanding of gut-brain axis modulation through the incorporation of specific probiotic smoothie strains and prebiotic fiber enrichment for digestive health drinks. Innovations in sustainability are also prominent, with upcycled food byproducts being used to address food waste reduction, a move that resonates with environmentally conscious consumers.
  • Brands that successfully integrate these advanced functional ingredients are achieving up to a 10% price premium over conventional offerings. Furthermore, products marketed for specific outcomes like immune support beverages are capturing a greater share of household wellness budgets, outperforming generic health drinks by a factor of two to one in recent consumer surveys.

What challenges does the Smoothies Industry face during its growth?

  • Significant price sensitivity among consumers, coupled with escalating input costs for manufacturers, presents a key challenge affecting industry growth.

  • Significant operational and market-based challenges constrain growth, primarily related to the complexities of cold chain logistics for perishable goods. The high cost of implementing high-pressure processing (HPP) and other shelf life extension technology to create stable ready-to-drink (RTD) formulation products adds considerable financial pressure.
  • Firms utilizing direct-to-consumer (DTC) models face last-mile delivery hurdles that can erode margins by up to 12% if not optimized. On the consumer side, maintaining premium beverage positioning is difficult in a market with intense price competition, especially for wellness lifestyle products. The push for sustainable, circular economy packaging and compostable beverage cups adds another layer of cost.
  • Balancing these expenses while ensuring precise macronutrient ratio balancing and glycemic index control in formulations remains a critical challenge for all industry players, impacting profitability and scalability.

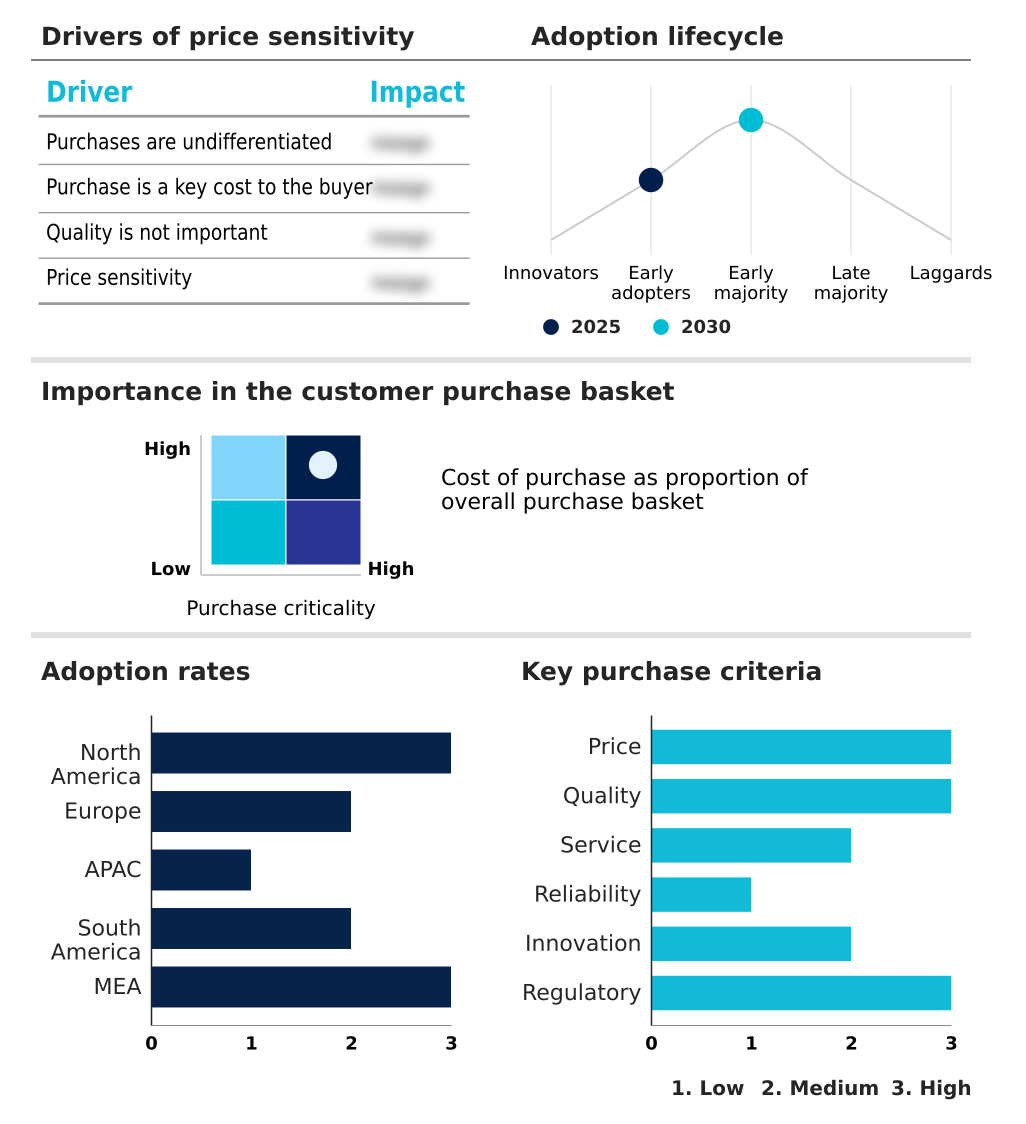
Exclusive Technavio Analysis on Customer Landscape

The smoothies market forecasting report includes the adoption lifecycle of the market, covering from the innovator’s stage to the laggard’s stage. It focuses on adoption rates in different regions based on penetration. Furthermore, the smoothies market report also includes key purchase criteria and drivers of price sensitivity to help companies evaluate and develop their market growth analysis strategies.

Customer Landscape of Smoothies Industry

Competitive Landscape

Companies are implementing various strategies, such as strategic alliances, smoothies market forecast, partnerships, mergers and acquisitions, geographical expansion, and product/service launches, to enhance their presence in the industry.

Bolthouse Farms Inc. - Key offerings center on dairy-based blended fruit beverages, leveraging traditional flavor profiles to capture a broad consumer segment seeking convenient, nutrient-fortified options.

The industry research and growth report includes detailed analyses of the competitive landscape of the market and information about key companies, including:

  • Bolthouse Farms Inc.
  • Campbell Soup Co.
  • Daily Harvest Inc.
  • Danone S.A.
  • Evolution Fresh LLC.
  • GOTO Foods
  • Happy Planet Foods Inc.
  • Kahala Franchising LLC
  • KOIA
  • Maui Wowi
  • Nestle SA
  • PepsiCo Inc.
  • Pressed Juicery Inc.
  • Sambazon Inc.
  • Smoothie King Franchises Inc.
  • Suja Life LLC
  • Sunny Sky Products
  • The Coca-Cola Co.
  • The Hain Celestial Group
  • Tropical Smoothie Cafe LLC

Qualitative and quantitative analysis of companies has been conducted to help clients understand the wider business environment as well as the strengths and weaknesses of key industry players. Data is qualitatively analyzed to categorize companies as pure play, category-focused, industry-focused, and diversified; it is quantitatively analyzed to categorize companies as dominant, leading, strong, tentative, and weak.

Recent Development and News in Smoothies market

  • In August, 2024, Sambazon Inc. acquired the frozen acai and smoothie bowl business from a key ingredients supplier to expand its United States manufacturing capabilities, thereby securing its supply chain to meet growing consumer demand.
  • In January, 2025, Daily Harvest Inc. introduced a new line of high-protein, plant-based smoothies containing 20 grams of organic pea protein, launched through its online DTC channel and in select Kroger locations.
  • In January, 2025, Smoothie Bar Infusions initiated a campaign deploying digital smoothie kiosks across California, allowing for an enhanced degree of consumer customization and aligning with demand for technologically advanced, eco-friendly food solutions.
  • In April, 2025, Jamba announced a significant master franchise agreement to expand its presence into the Philippines, marking a strategic re-entry and growth focus in the key Southeast Asian market.

Dive into Technavio’s robust research methodology, blending expert interviews, extensive data synthesis, and validated models for unparalleled Smoothies Market insights. See full methodology.

Market Scope
Page number 296
Base year 2025
Historic period 2020-2024
Forecast period 2026-2030
Growth momentum & CAGR Accelerate at a CAGR of 7.7%
Market growth 2026-2030 USD 6487.5 million
Market structure Fragmented
YoY growth 2025-2026(%) 7.5%
Key countries US, Canada, Mexico, Germany, UK, France, Italy, The Netherlands, Spain, China, India, Japan, Australia, South Korea, Indonesia, Brazil, Argentina, Colombia, Saudi Arabia, UAE, South Africa, Israel and Turkey
Competitive landscape Leading Companies, Market Positioning of Companies, Competitive Strategies, and Industry Risks

Request Free Sample

Research Analyst Overview

  • The smoothies market reflects a significant shift towards personalized, functional nutrition, moving beyond simple refreshment to become a tool for proactive health management. Boardroom-level decisions are increasingly centered on investment in sustainable packaging solutions to align with both regulatory pressures and consumer-driven ethicalism.
  • The integration of direct-to-consumer (DTC) models and subscription-based delivery is reshaping distribution, creating new revenue streams while intensifying logistical demands. The use of high-speed pulverization process technology ensures a premium sensory experience, which is critical for justifying higher price points. A central challenge remains the management of a complex and costly cold chain, where any failure can jeopardize product integrity.
  • The implementation of advanced shelf life extension technology has become a key competitive differentiator, with some methods proven to reduce spoilage by over 30% compared to traditional preservation techniques. This focus on technological and ethical advancements is essential for navigating a market defined by high consumer expectations and intense competition from a variety of wellness-oriented products.

What are the Key Data Covered in this Smoothies Market Research and Growth Report?

  • What is the expected growth of the Smoothies Market between 2026 and 2030?

    • USD 6.49 billion, at a CAGR of 7.7%

  • What segmentation does the market report cover?

    • The report is segmented by Consumption Pattern (Out of home, and At home), Product (Fruit based, Vegetable based, Dairy based, and Others), Distribution Channel (Offline, and Online) and Geography (North America, Europe, APAC, South America, Middle East and Africa)

  • Which regions are analyzed in the report?

    • North America, Europe, APAC, South America and Middle East and Africa

  • What are the key growth drivers and market challenges?

    • Surging consumer emphasis on health and wellness and functional nutrition, Significant price sensitivity and escalating input costs

  • Who are the major players in the Smoothies Market?

    • Bolthouse Farms Inc., Campbell Soup Co., Daily Harvest Inc., Danone S.A., Evolution Fresh LLC., GOTO Foods, Happy Planet Foods Inc., Kahala Franchising LLC, KOIA, Maui Wowi, Nestle SA, PepsiCo Inc., Pressed Juicery Inc., Sambazon Inc., Smoothie King Franchises Inc., Suja Life LLC, Sunny Sky Products, The Coca-Cola Co., The Hain Celestial Group and Tropical Smoothie Cafe LLC

Market Research Insights

  • Market dynamics are shaped by an intense focus on consumer wellness, with firms that provide transparent supply chains seeing customer loyalty rates improve by up to 15%. The demand for grab-and-go convenience food has spurred growth in single-serving packaging, though this is tempered by a push for circular economy packaging.
  • The adoption of advanced allergen-free formulations has expanded addressable consumer segments by over 5% in mature markets. Brands are increasingly leveraging low-sugar drink options and fortified beverage products to differentiate. Meanwhile, the operational necessity of premium beverage positioning is challenged by price sensitivity, forcing innovation in areas like ready-to-blend ingredients to offer value.
  • This competitive pressure ensures a constant evolution in product offerings, from frozen smoothie kits to sophisticated wellness lifestyle products.

We can help! Our analysts can customize this smoothies market research report to meet your requirements.

Get in touch

1. Executive Summary

1.1 Market overview

Executive Summary - Chart on Market Overview
Executive Summary - Data Table on Market Overview
Executive Summary - Chart on Global Market Characteristics
Executive Summary - Chart on Market by Geography
Executive Summary - Chart on Market Segmentation by Consumption Pattern
Executive Summary - Chart on Market Segmentation by Product
Executive Summary - Chart on Market Segmentation by Distribution Channel
Executive Summary - Chart on Incremental Growth
Executive Summary - Data Table on Incremental Growth
Executive Summary - Chart on Company Market Positioning

2. Technavio Analysis

2.1 Analysis of price sensitivity, lifecycle, customer purchase basket, adoption rates, and purchase criteria

2.2 Criticality of inputs and Factors of differentiation

Chart on Overview on criticality of inputs and factors of differentiation

2.3 Factors of disruption

Chart on Overview on factors of disruption

2.4 Impact of drivers and challenges

Chart on Impact of drivers and challenges in 2025 and 2030

3. Market Landscape

3.1 Market ecosystem

Chart on Parent Market
Data Table on - Parent Market

3.2 Market characteristics

Chart on Market characteristics analysis

3.3 Value chain analysis

Chart on Value chain analysis

4. Market Sizing

4.1 Market definition

Data Table on Offerings of companies included in the market definition

4.2 Market segment analysis

Market segments

4.3 Market size 2025

4.4 Market outlook: Forecast for 2025-2030

Chart on Global - Market size and forecast 2025-2030 ($ million)
Data Table on Global - Market size and forecast 2025-2030 ($ million)
Chart on Global Market: Year-over-year growth 2025-2030 (%)
Data Table on Global Market: Year-over-year growth 2025-2030 (%)

5. Historic Market Size

5.1 Global Smoothies Market 2020 - 2024

Historic Market Size - Data Table on Global Smoothies Market 2020 - 2024 ($ million)

5.2 Consumption Pattern segment analysis 2020 - 2024

Historic Market Size - Consumption Pattern Segment 2020 - 2024 ($ million)

5.3 Product segment analysis 2020 - 2024

Historic Market Size - Product Segment 2020 - 2024 ($ million)

5.4 Distribution Channel segment analysis 2020 - 2024

Historic Market Size - Distribution Channel Segment 2020 - 2024 ($ million)

5.5 Geography segment analysis 2020 - 2024

Historic Market Size - Geography Segment 2020 - 2024 ($ million)

5.6 Country segment analysis 2020 - 2024

Historic Market Size - Country Segment 2020 - 2024 ($ million)

6. Qualitative Analysis

6.1 The AI impact on Global Smoothies Market

7. Five Forces Analysis

7.1 Five forces summary

Five forces analysis - Comparison between 2025 and 2030

7.2 Bargaining power of buyers

Bargaining power of buyers - Impact of key factors 2025 and 2030

7.3 Bargaining power of suppliers

Bargaining power of suppliers - Impact of key factors in 2025 and 2030

7.4 Threat of new entrants

Threat of new entrants - Impact of key factors in 2025 and 2030

7.5 Threat of substitutes

Threat of substitutes - Impact of key factors in 2025 and 2030

7.6 Threat of rivalry

Threat of rivalry - Impact of key factors in 2025 and 2030

7.7 Market condition

Chart on Market condition - Five forces 2025 and 2030

8. Market Segmentation by Consumption Pattern

8.1 Market segments

Chart on Consumption Pattern - Market share 2025-2030 (%)
Data Table on Consumption Pattern - Market share 2025-2030 (%)

8.2 Comparison by Consumption Pattern

Chart on Comparison by Consumption Pattern
Data Table on Comparison by Consumption Pattern

8.3 Out of home - Market size and forecast 2025-2030

Chart on Out of home - Market size and forecast 2025-2030 ($ million)
Data Table on Out of home - Market size and forecast 2025-2030 ($ million)
Chart on Out of home - Year-over-year growth 2025-2030 (%)
Data Table on Out of home - Year-over-year growth 2025-2030 (%)

8.4 At home - Market size and forecast 2025-2030

Chart on At home - Market size and forecast 2025-2030 ($ million)
Data Table on At home - Market size and forecast 2025-2030 ($ million)
Chart on At home - Year-over-year growth 2025-2030 (%)
Data Table on At home - Year-over-year growth 2025-2030 (%)

8.5 Market opportunity by Consumption Pattern

Market opportunity by Consumption Pattern ($ million)
Data Table on Market opportunity by Consumption Pattern ($ million)

9. Market Segmentation by Product

9.1 Market segments

Chart on Product - Market share 2025-2030 (%)
Data Table on Product - Market share 2025-2030 (%)

9.2 Comparison by Product

Chart on Comparison by Product
Data Table on Comparison by Product

9.3 Fruit based - Market size and forecast 2025-2030

Chart on Fruit based - Market size and forecast 2025-2030 ($ million)
Data Table on Fruit based - Market size and forecast 2025-2030 ($ million)
Chart on Fruit based - Year-over-year growth 2025-2030 (%)
Data Table on Fruit based - Year-over-year growth 2025-2030 (%)

9.4 Vegetable based - Market size and forecast 2025-2030

Chart on Vegetable based - Market size and forecast 2025-2030 ($ million)
Data Table on Vegetable based - Market size and forecast 2025-2030 ($ million)
Chart on Vegetable based - Year-over-year growth 2025-2030 (%)
Data Table on Vegetable based - Year-over-year growth 2025-2030 (%)

9.5 Dairy based - Market size and forecast 2025-2030

Chart on Dairy based - Market size and forecast 2025-2030 ($ million)
Data Table on Dairy based - Market size and forecast 2025-2030 ($ million)
Chart on Dairy based - Year-over-year growth 2025-2030 (%)
Data Table on Dairy based - Year-over-year growth 2025-2030 (%)

9.6 Others - Market size and forecast 2025-2030

Chart on Others - Market size and forecast 2025-2030 ($ million)
Data Table on Others - Market size and forecast 2025-2030 ($ million)
Chart on Others - Year-over-year growth 2025-2030 (%)
Data Table on Others - Year-over-year growth 2025-2030 (%)

9.7 Market opportunity by Product

Market opportunity by Product ($ million)
Data Table on Market opportunity by Product ($ million)

10. Market Segmentation by Distribution Channel

10.1 Market segments

Chart on Distribution Channel - Market share 2025-2030 (%)
Data Table on Distribution Channel - Market share 2025-2030 (%)

10.2 Comparison by Distribution Channel

Chart on Comparison by Distribution Channel
Data Table on Comparison by Distribution Channel

10.3 Offline - Market size and forecast 2025-2030

Chart on Offline - Market size and forecast 2025-2030 ($ million)
Data Table on Offline - Market size and forecast 2025-2030 ($ million)
Chart on Offline - Year-over-year growth 2025-2030 (%)
Data Table on Offline - Year-over-year growth 2025-2030 (%)

10.4 Online - Market size and forecast 2025-2030

Chart on Online - Market size and forecast 2025-2030 ($ million)
Data Table on Online - Market size and forecast 2025-2030 ($ million)
Chart on Online - Year-over-year growth 2025-2030 (%)
Data Table on Online - Year-over-year growth 2025-2030 (%)

10.5 Market opportunity by Distribution Channel

Market opportunity by Distribution Channel ($ million)
Data Table on Market opportunity by Distribution Channel ($ million)

11. Customer Landscape

11.1 Customer landscape overview

Analysis of price sensitivity, lifecycle, customer purchase basket, adoption rates, and purchase criteria

12. Geographic Landscape

12.1 Geographic segmentation

Chart on Market share by geography 2025-2030 (%)
Data Table on Market share by geography 2025-2030 (%)

12.2 Geographic comparison

Chart on Geographic comparison
Data Table on Geographic comparison

12.3 North America - Market size and forecast 2025-2030

Chart on North America - Market size and forecast 2025-2030 ($ million)
Data Table on North America - Market size and forecast 2025-2030 ($ million)
Chart on North America - Year-over-year growth 2025-2030 (%)
Data Table on North America - Year-over-year growth 2025-2030 (%)
Chart on Regional Comparison - North America
Data Table on Regional Comparison - North America

12.3.1 US - Market size and forecast 2025-2030

Chart on US - Market size and forecast 2025-2030 ($ million)
Data Table on US - Market size and forecast 2025-2030 ($ million)
Chart on US - Year-over-year growth 2025-2030 (%)
Data Table on US - Year-over-year growth 2025-2030 (%)

12.3.2 Canada - Market size and forecast 2025-2030

Chart on Canada - Market size and forecast 2025-2030 ($ million)
Data Table on Canada - Market size and forecast 2025-2030 ($ million)
Chart on Canada - Year-over-year growth 2025-2030 (%)
Data Table on Canada - Year-over-year growth 2025-2030 (%)

12.3.3 Mexico - Market size and forecast 2025-2030

Chart on Mexico - Market size and forecast 2025-2030 ($ million)
Data Table on Mexico - Market size and forecast 2025-2030 ($ million)
Chart on Mexico - Year-over-year growth 2025-2030 (%)
Data Table on Mexico - Year-over-year growth 2025-2030 (%)

12.4 Europe - Market size and forecast 2025-2030

Chart on Europe - Market size and forecast 2025-2030 ($ million)
Data Table on Europe - Market size and forecast 2025-2030 ($ million)
Chart on Europe - Year-over-year growth 2025-2030 (%)
Data Table on Europe - Year-over-year growth 2025-2030 (%)
Chart on Regional Comparison - Europe
Data Table on Regional Comparison - Europe

12.4.1 Germany - Market size and forecast 2025-2030

Chart on Germany - Market size and forecast 2025-2030 ($ million)
Data Table on Germany - Market size and forecast 2025-2030 ($ million)
Chart on Germany - Year-over-year growth 2025-2030 (%)
Data Table on Germany - Year-over-year growth 2025-2030 (%)

12.4.2 UK - Market size and forecast 2025-2030

Chart on UK - Market size and forecast 2025-2030 ($ million)
Data Table on UK - Market size and forecast 2025-2030 ($ million)
Chart on UK - Year-over-year growth 2025-2030 (%)
Data Table on UK - Year-over-year growth 2025-2030 (%)

12.4.3 France - Market size and forecast 2025-2030

Chart on France - Market size and forecast 2025-2030 ($ million)
Data Table on France - Market size and forecast 2025-2030 ($ million)
Chart on France - Year-over-year growth 2025-2030 (%)
Data Table on France - Year-over-year growth 2025-2030 (%)

12.4.4 Italy - Market size and forecast 2025-2030

Chart on Italy - Market size and forecast 2025-2030 ($ million)
Data Table on Italy - Market size and forecast 2025-2030 ($ million)
Chart on Italy - Year-over-year growth 2025-2030 (%)
Data Table on Italy - Year-over-year growth 2025-2030 (%)

12.4.5 The Netherlands - Market size and forecast 2025-2030

Chart on The Netherlands - Market size and forecast 2025-2030 ($ million)
Data Table on The Netherlands - Market size and forecast 2025-2030 ($ million)
Chart on The Netherlands - Year-over-year growth 2025-2030 (%)
Data Table on The Netherlands - Year-over-year growth 2025-2030 (%)

12.4.6 Spain - Market size and forecast 2025-2030

Chart on Spain - Market size and forecast 2025-2030 ($ million)
Data Table on Spain - Market size and forecast 2025-2030 ($ million)
Chart on Spain - Year-over-year growth 2025-2030 (%)
Data Table on Spain - Year-over-year growth 2025-2030 (%)

12.5 APAC - Market size and forecast 2025-2030

Chart on APAC - Market size and forecast 2025-2030 ($ million)
Data Table on APAC - Market size and forecast 2025-2030 ($ million)
Chart on APAC - Year-over-year growth 2025-2030 (%)
Data Table on APAC - Year-over-year growth 2025-2030 (%)
Chart on Regional Comparison - APAC
Data Table on Regional Comparison - APAC

12.5.1 China - Market size and forecast 2025-2030

Chart on China - Market size and forecast 2025-2030 ($ million)
Data Table on China - Market size and forecast 2025-2030 ($ million)
Chart on China - Year-over-year growth 2025-2030 (%)
Data Table on China - Year-over-year growth 2025-2030 (%)

12.5.2 India - Market size and forecast 2025-2030

Chart on India - Market size and forecast 2025-2030 ($ million)
Data Table on India - Market size and forecast 2025-2030 ($ million)
Chart on India - Year-over-year growth 2025-2030 (%)
Data Table on India - Year-over-year growth 2025-2030 (%)

12.5.3 Japan - Market size and forecast 2025-2030

Chart on Japan - Market size and forecast 2025-2030 ($ million)
Data Table on Japan - Market size and forecast 2025-2030 ($ million)
Chart on Japan - Year-over-year growth 2025-2030 (%)
Data Table on Japan - Year-over-year growth 2025-2030 (%)

12.5.4 Australia - Market size and forecast 2025-2030

Chart on Australia - Market size and forecast 2025-2030 ($ million)
Data Table on Australia - Market size and forecast 2025-2030 ($ million)
Chart on Australia - Year-over-year growth 2025-2030 (%)
Data Table on Australia - Year-over-year growth 2025-2030 (%)

12.5.5 South Korea - Market size and forecast 2025-2030

Chart on South Korea - Market size and forecast 2025-2030 ($ million)
Data Table on South Korea - Market size and forecast 2025-2030 ($ million)
Chart on South Korea - Year-over-year growth 2025-2030 (%)
Data Table on South Korea - Year-over-year growth 2025-2030 (%)

12.5.6 Indonesia - Market size and forecast 2025-2030

Chart on Indonesia - Market size and forecast 2025-2030 ($ million)
Data Table on Indonesia - Market size and forecast 2025-2030 ($ million)
Chart on Indonesia - Year-over-year growth 2025-2030 (%)
Data Table on Indonesia - Year-over-year growth 2025-2030 (%)

12.6 South America - Market size and forecast 2025-2030

Chart on South America - Market size and forecast 2025-2030 ($ million)
Data Table on South America - Market size and forecast 2025-2030 ($ million)
Chart on South America - Year-over-year growth 2025-2030 (%)
Data Table on South America - Year-over-year growth 2025-2030 (%)
Chart on Regional Comparison - South America
Data Table on Regional Comparison - South America

12.6.1 Brazil - Market size and forecast 2025-2030

Chart on Brazil - Market size and forecast 2025-2030 ($ million)
Data Table on Brazil - Market size and forecast 2025-2030 ($ million)
Chart on Brazil - Year-over-year growth 2025-2030 (%)
Data Table on Brazil - Year-over-year growth 2025-2030 (%)

12.6.2 Argentina - Market size and forecast 2025-2030

Chart on Argentina - Market size and forecast 2025-2030 ($ million)
Data Table on Argentina - Market size and forecast 2025-2030 ($ million)
Chart on Argentina - Year-over-year growth 2025-2030 (%)
Data Table on Argentina - Year-over-year growth 2025-2030 (%)

12.6.3 Colombia - Market size and forecast 2025-2030

Chart on Colombia - Market size and forecast 2025-2030 ($ million)
Data Table on Colombia - Market size and forecast 2025-2030 ($ million)
Chart on Colombia - Year-over-year growth 2025-2030 (%)
Data Table on Colombia - Year-over-year growth 2025-2030 (%)

12.7 Middle East and Africa - Market size and forecast 2025-2030

Chart on Middle East and Africa - Market size and forecast 2025-2030 ($ million)
Data Table on Middle East and Africa - Market size and forecast 2025-2030 ($ million)
Chart on Middle East and Africa - Year-over-year growth 2025-2030 (%)
Data Table on Middle East and Africa - Year-over-year growth 2025-2030 (%)
Chart on Regional Comparison - Middle East and Africa
Data Table on Regional Comparison - Middle East and Africa

12.7.1 Saudi Arabia - Market size and forecast 2025-2030

Chart on Saudi Arabia - Market size and forecast 2025-2030 ($ million)
Data Table on Saudi Arabia - Market size and forecast 2025-2030 ($ million)
Chart on Saudi Arabia - Year-over-year growth 2025-2030 (%)
Data Table on Saudi Arabia - Year-over-year growth 2025-2030 (%)

12.7.2 UAE - Market size and forecast 2025-2030

Chart on UAE - Market size and forecast 2025-2030 ($ million)
Data Table on UAE - Market size and forecast 2025-2030 ($ million)
Chart on UAE - Year-over-year growth 2025-2030 (%)
Data Table on UAE - Year-over-year growth 2025-2030 (%)

12.7.3 South Africa - Market size and forecast 2025-2030

Chart on South Africa - Market size and forecast 2025-2030 ($ million)
Data Table on South Africa - Market size and forecast 2025-2030 ($ million)
Chart on South Africa - Year-over-year growth 2025-2030 (%)
Data Table on South Africa - Year-over-year growth 2025-2030 (%)

12.7.4 Israel - Market size and forecast 2025-2030

Chart on Israel - Market size and forecast 2025-2030 ($ million)
Data Table on Israel - Market size and forecast 2025-2030 ($ million)
Chart on Israel - Year-over-year growth 2025-2030 (%)
Data Table on Israel - Year-over-year growth 2025-2030 (%)

12.7.5 Turkey - Market size and forecast 2025-2030

Chart on Turkey - Market size and forecast 2025-2030 ($ million)
Data Table on Turkey - Market size and forecast 2025-2030 ($ million)
Chart on Turkey - Year-over-year growth 2025-2030 (%)
Data Table on Turkey - Year-over-year growth 2025-2030 (%)

12.8 Market opportunity by geography

Market opportunity by geography ($ million)
Data Tables on Market opportunity by geography ($ million)

13. Drivers, Challenges, and Opportunity

13.1 Market drivers

Surging consumer emphasis on health and wellness and functional nutrition
Imperative for convenience and on-the-go consumption patterns
Proliferation of plant based diets and diversification of ingredients

13.2 Market challenges

Significant price sensitivity and escalating input costs
Inherent product perishability and complex cold chain logistics
Intense market competition and threat of category saturation

13.3 Impact of drivers and challenges

Impact of drivers and challenges in 2025 and 2030

13.4 Market opportunities

Ascendancy of hyper-personalization and customization
Imperative of sustainability and ethical sourcing
Incorporation of nootropics, adaptogens, and mood food ingredients

14. Competitive Landscape

14.1 Overview

14.2

Overview on criticality of inputs and factors of differentiation

14.3 Landscape disruption

Overview on factors of disruption

14.4 Industry risks

Impact of key risks on business

15. Competitive Analysis

15.1 Companies profiled

Companies covered

15.2 Company ranking index

15.3 Market positioning of companies

Matrix on companies position and classification

15.4 Bolthouse Farms Inc.

Bolthouse Farms Inc. - Overview
Bolthouse Farms Inc. - Product / Service
Bolthouse Farms Inc. - Key offerings
SWOT

15.5 Campbell Soup Co.

Campbell Soup Co. - Overview
Campbell Soup Co. - Business segments
Campbell Soup Co. - Key news
Campbell Soup Co. - Key offerings
Campbell Soup Co. - Segment focus
SWOT

15.6 Daily Harvest Inc.

Daily Harvest Inc. - Overview
Daily Harvest Inc. - Product / Service
Daily Harvest Inc. - Key offerings
SWOT

15.7 Danone S.A.

Danone S.A. - Overview
Danone S.A. - Business segments
Danone S.A. - Key news
Danone S.A. - Key offerings
Danone S.A. - Segment focus
SWOT

15.8 GOTO Foods

GOTO Foods - Overview
GOTO Foods - Product / Service
GOTO Foods - Key offerings
SWOT

15.9 Happy Planet Foods Inc.

Happy Planet Foods Inc. - Overview
Happy Planet Foods Inc. - Product / Service
Happy Planet Foods Inc. - Key offerings
SWOT

15.10 Kahala Franchising LLC

Kahala Franchising LLC - Overview
Kahala Franchising LLC - Product / Service
Kahala Franchising LLC - Key offerings
SWOT

15.11 Nestle SA

Nestle SA - Overview
Nestle SA - Business segments
Nestle SA - Key news
Nestle SA - Key offerings
Nestle SA - Segment focus
SWOT

15.12 PepsiCo Inc.

PepsiCo Inc. - Overview
PepsiCo Inc. - Business segments
PepsiCo Inc. - Key news
PepsiCo Inc. - Key offerings
PepsiCo Inc. - Segment focus
SWOT

15.13 Pressed Juicery Inc.

Pressed Juicery Inc. - Overview
Pressed Juicery Inc. - Product / Service
Pressed Juicery Inc. - Key offerings
SWOT

15.14 Sambazon Inc.

Sambazon Inc. - Overview
Sambazon Inc. - Product / Service
Sambazon Inc. - Key offerings
SWOT

15.15 Smoothie King Franchises Inc.

Smoothie King Franchises Inc. - Overview
Smoothie King Franchises Inc. - Product / Service
Smoothie King Franchises Inc. - Key offerings
SWOT

15.16 The Coca-Cola Co.

The Coca-Cola Co. - Overview
The Coca-Cola Co. - Business segments
The Coca-Cola Co. - Key news
The Coca-Cola Co. - Key offerings
The Coca-Cola Co. - Segment focus
SWOT

15.17 The Hain Celestial Group

The Hain Celestial Group - Overview
The Hain Celestial Group - Business segments
The Hain Celestial Group - Key news
The Hain Celestial Group - Key offerings
The Hain Celestial Group - Segment focus
SWOT

15.18 Tropical Smoothie Cafe LLC

Tropical Smoothie Cafe LLC - Overview
Tropical Smoothie Cafe LLC - Product / Service
Tropical Smoothie Cafe LLC - Key offerings
SWOT

16. Appendix

16.1 Scope of the report

Market definition
Objectives
Notes and caveats

16.2 Inclusions and exclusions checklist

Inclusions checklist
Exclusions checklist

16.3 Currency conversion rates for US$

16.4 Research methodology

16.5 Data procurement

Information sources

16.6 Data validation

16.7 Validation techniques employed for market sizing

16.8 Data synthesis

16.9 360 degree market analysis

16.10 List of abbreviations

Research Methodology

Technavio presents a detailed picture of the market by way of study, synthesis, and summation of data from multiple sources. The analysts have presented the various facets of the market with a particular focus on identifying the key industry influencers. The data thus presented is comprehensive, reliable, and the result of extensive research, both primary and secondary.

INFORMATION SOURCES

Primary sources

  • Manufacturers and suppliers
  • Channel partners
  • Industry experts
  • Strategic decision makers

Secondary sources

  • Industry journals and periodicals
  • Government data
  • Financial reports of key industry players
  • Historical data
  • Press releases

DATA ANALYSIS

Data Synthesis

  • Collation of data
  • Estimation of key figures
  • Analysis of derived insights

Data Validation

  • Triangulation with data models
  • Reference against proprietary databases
  • Corroboration with industry experts

REPORT WRITING

Qualitative

  • Market drivers
  • Market challenges
  • Market trends
  • Five forces analysis

Quantitative

  • Market size and forecast
  • Market segmentation
  • Geographical insights
  • Competitive landscape

Interested in this report?

Get your sample now to see our research methodology and insights!

Download Now

Frequently Asked Questions

Smoothies market growth will increase by USD 6487.5 million during 2026-2030.

The Smoothies market is expected to grow at a CAGR of 7.7% during 2026-2030.

Smoothies market is segmented by Consumption pattern (Out of home, At home) Product (Fruit based, Vegetable based, Dairy based, Others) Distribution channel (Offline, Online)

Bolthouse Farms Inc., Campbell Soup Co., Daily Harvest Inc., Danone S.A., Evolution Fresh LLC., GOTO Foods, Happy Planet Foods Inc., Kahala Franchising LLC, KOIA, Maui Wowi, Nestle SA, PepsiCo Inc., Pressed Juicery Inc., Sambazon Inc., Smoothie King Franchises Inc., Suja Life LLC, Sunny Sky Products, The Coca-Cola Co., The Hain Celestial Group, Tropical Smoothie Cafe LLC are a few of the key vendors in the Smoothies market.

North America will register the highest growth rate of 39.3% among the other regions. Therefore, the Smoothies market in North America is expected to garner significant business opportunities for the vendors during the forecast period.

US, Canada, Mexico, Germany, UK, France, Italy, The Netherlands, Spain, China, India, Japan, Australia, South Korea, Indonesia, Brazil, Argentina, Colombia, Saudi Arabia, UAE, South Africa, Israel, Turkey

  • Surging consumer emphasis on health and wellness and functional nutrition is the driving factor this market.

The Smoothies market vendors should focus on grabbing business opportunities from the Consumption pattern segment as it accounted for the largest market share in the base year.