Soft Tissue Repair Market Analysis, Size, and Forecast 2026-2030: North America (US, Canada, and Mexico), Europe (Germany, UK, and France), APAC (China, Japan, and India), South America (Brazil, Argentina, and Colombia), Middle East and Africa (Saudi Arabia, South Africa, and UAE), Asia, Rest of World (ROW)

Soft Tissue Repair Market Analysis, Size, and Forecast 2026-2030:
North America (US, Canada, and Mexico), Europe (Germany, UK, and France), APAC (China, Japan, and India), South America (Brazil, Argentina, and Colombia), Middle East and Africa (Saudi Arabia, South Africa, and UAE), Asia, Rest of World (ROW)

Published: May 2026 299 Pages SKU: IRTNTR44580

Market Overview at a Glance

$3.77 B
Market Opportunity
4.4%
CAGR 2025 - 2030
38.4%
North America Growth
$8.11 B
Hospitals segment 2024

Soft Tissue Repair Market Size 2026-2030

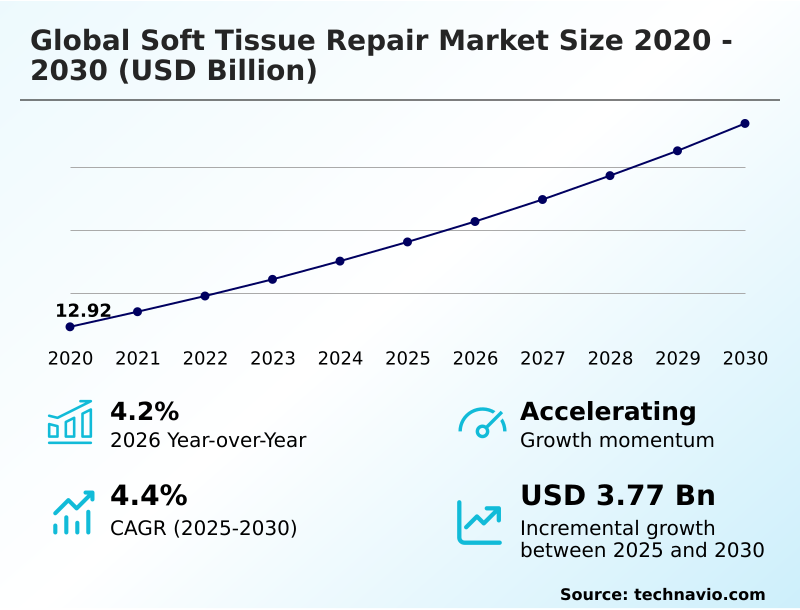
The Soft Tissue Repair Market size was valued at USD 15.62 billion in 2025, growing at a CAGR of 4.4% during the forecast period 2026-2030.

Major Market Trends & Insights

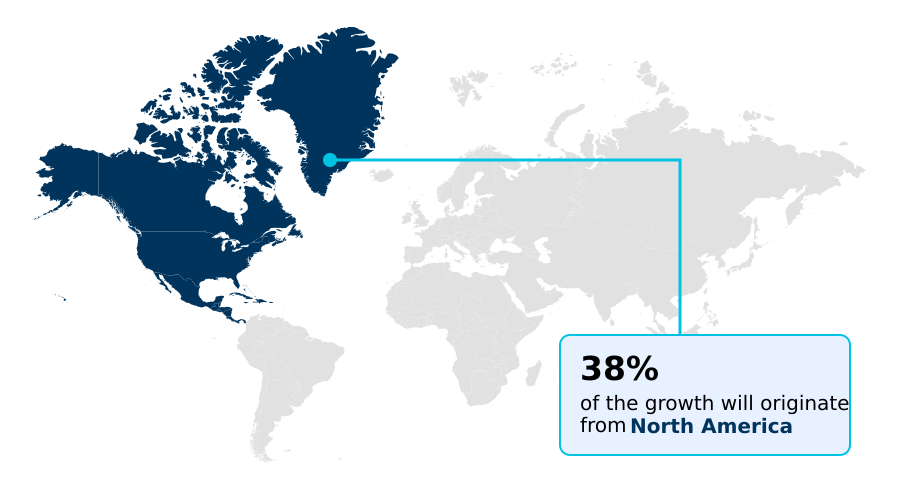
  • North America dominated the market and accounted for a 38.4% growth during the forecast period.
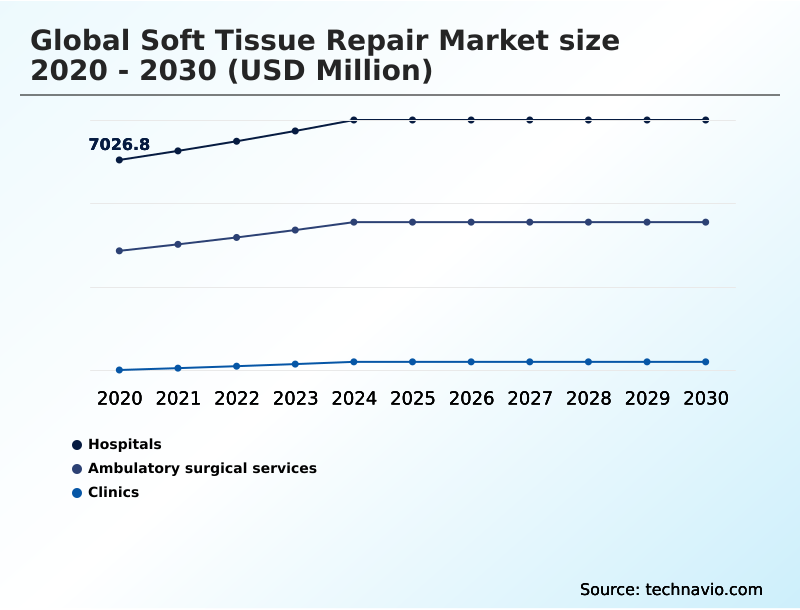
  • By End-user - Hospitals segment was valued at USD 8.11 billion in 2024
  • By Product - Soft tissue fixation devices and accessories segment accounted for the largest market revenue share in 2024

Market Size & Forecast

  • Historic Market Opportunities 2020-2024: USD 6.47 billion
  • Market Future Opportunities 2025-2030: USD 3.77 billion
  • CAGR from 2025 to 2030 : 4.4%

Market Summary

  • The soft tissue repair market is characterized by a rapid technological evolution, where the focus has shifted from simple mechanical reinforcement to biological regeneration, impacting procurement for over 60% of hospital systems.
  • The primary driver is the dual demand from an active aging population seeking functional restoration and a rise in sports-related injury, which together increase surgical volumes for procedures like ligament reconstruction. For example, a manufacturer's supply chain strategy must now accommodate both high-volume synthetic mesh for routine hernia repair and temperature-sensitive allograft tissue for complex reconstructions, requiring dual logistics pathways.
  • This operational complexity increases costs by an estimated 15% compared to single-material inventories. A key challenge remains the high cost and stringent regulatory compliance for advanced biologic grafts, which can slow adoption despite their superior clinical efficacy. This dynamic forces providers to balance cutting-edge patient care with economic realities.

What will be the Size of the Soft Tissue Repair Market during the forecast period?

Get Key Insights on Market Forecast (PDF) Request Free Sample

How is the Soft Tissue Repair Market Segmented?

The soft tissue repair industry research report provides comprehensive data (region-wise segment analysis), with forecasts and analysis for the period 2026-2030, as well as historical data from 2020-2024 for the following segments.

  • End-user
    • Hospitals
    • Ambulatory surgical services
    • Clinics
  • Product
    • Soft tissue fixation devices and accessories
    • Cell therapy
    • Tissue scaffold
  • Product type
    • Tissue matrix
    • Tissue fixation products
    • Laparoscopic instruments
  • Geography
    • North America
      • US
      • Canada
      • Mexico
    • Europe
      • Germany
      • UK
      • France
    • Asia
    • Rest of World (ROW)

How is the Soft Tissue Repair Market Segmented by End-user?

The hospitals segment is estimated to witness significant growth during the forecast period.

Hospitals represent the largest end-user segment, accounting for over 55% of soft tissue repair procedures due to their capacity for complex cases.

These institutions are the primary sites for high-acuity trauma and reconstructive surgery, which often require advanced biologic grafts and robotic-assisted surgery.

Procurement in hospitals is shifting; value analysis committees now prioritize procedural solutions that can demonstrate a reduction in readmission rates by at least 15% over a 12-month period.

This focus drives the adoption of premium tissue scaffold products and bioabsorbable materials, which, despite higher upfront costs, offer superior tissue integration and long-term functional restoration, aligning with value-based care models.

The hospital setting's comprehensive infrastructure supports the intricate surgical workflow required for these advanced interventions.

Request Free Sample

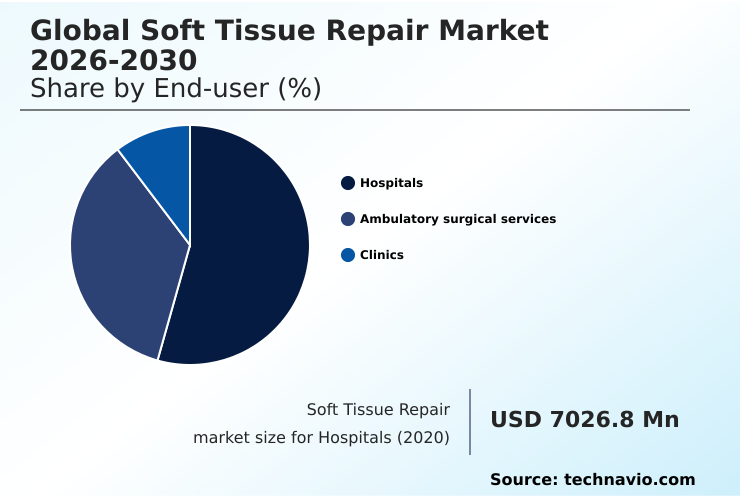
The Hospitals segment was valued at USD 8.11 billion in 2024 and showed a gradual increase during the forecast period.

Request Free Sample

How demand for the Soft Tissue Repair market is rising in the leading region?

North America is estimated to contribute 38.4% to the growth of the global market during the forecast period.Technavio’s analysts have elaborately explained the regional trends and drivers that shape the market during the forecast period.

See How Soft Tissue Repair Market demand is rising in North America Request Free Sample

The geographic landscape of the soft tissue repair market is dominated by North America, which contributes over 38% of the global market share, largely due to high procedural volumes in the US.

In contrast, the market in Asia is the fastest-growing, projected to expand by nearly 5% annually, driven by improving healthcare access in China and India.

The US market, valued at over 4,788 million, heavily favors advanced biologics and robotic-assisted surgery, with procurement decisions influenced by value-based care metrics.

European markets, such as Germany, show a higher adoption rate for synthetic mesh in hernia repair due to cost-containment policies, a strategy differing from the US preference for biologic grafts in complex cases.

This regional variation in clinical practice and reimbursement frameworks requires manufacturers to deploy highly localized commercial strategies and product portfolios to succeed.

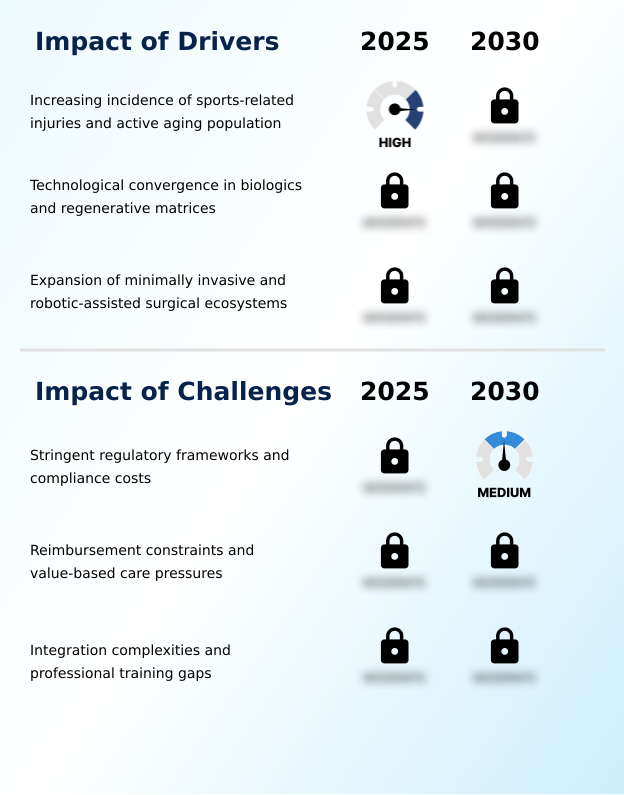
What are the key Drivers, Trends, and Challenges in the Soft Tissue Repair Market?

Our researchers analyzed the data with 2025 as the base year, along with the key drivers, trends, and challenges. A holistic analysis of drivers will help companies refine their marketing strategies to gain a competitive advantage.

  • Surgeons considering options for soft tissue repair for rotator cuff tears are increasingly evaluating a range of advanced materials and techniques. The central debate often revolves around the choice between a biologic mesh vs synthetic mesh for hernia repair, where clinical outcomes can differ significantly based on patient factors and surgical approach.
  • In orthopedic procedures, particularly in arthroscopic surgery, knotless anchor systems are becoming a standard of care due to their ability to simplify the surgical workflow and provide consistent fixation strength. These systems are integral to advancements in acl reconstruction techniques, which now focus on preserving native tissue and accelerating patient return to activity.
  • A critical area of research is the expanding field of cell therapy applications in soft tissue regeneration. This approach moves beyond mechanical support to actively stimulate the body's healing processes, offering potential for more complete functional restoration.
  • The development of specialized tissue scaffold products that mimic the native extracellular matrix is key to this effort, providing a framework for cellular infiltration and vascularization, ultimately leading to more durable and biologically integrated repairs across a spectrum of surgical needs.
  • This shift toward biological solutions has been shown to reduce complication rates by more than 10% in certain complex revision surgeries compared to traditional synthetic implants.

What are the key market drivers leading to the rise in the adoption of Soft Tissue Repair Industry?

  • The increasing incidence of sports-related injuries, coupled with a growing active aging population, is a key driver for market growth.

  • The primary driver for the soft tissue repair market is the convergence of a growing active aging population and a high incidence of sports-related injury, which collectively increases surgical volumes by over 5% annually.
  • This demographic requires solutions that support functional restoration rather than just palliative care. As a result, the demand for orthopedic intervention, particularly for rotator cuff and ACL ligament reconstruction, is surging.
  • This has compelled medical device companies to develop specialized procedural solutions, such as bio-integrative fixation devices, which improve outcomes in patients with compromised tissue quality.
  • The adoption of these advanced technologies has led to a 15% improvement in long-term patient-reported outcomes compared to traditional methods.

What are the market trends shaping the Soft Tissue Repair Industry?

  • A primary market trend is the convergence of synthetic and biologic material properties. This is leading to the development of hybrid matrices that combine mechanical strength with biocompatibility.

  • A dominant trend in the soft tissue repair market is the hybridization of materials, blurring the lines between synthetic mesh and biologic grafts to create advanced hybrid-scale matrix products.
  • This shift is driven by the clinical need to combine the mechanical strength of synthetics with the high biocompatibility and tissue integration of biologics, which has been shown to reduce long-term complication rates by up to 20% in complex abdominal wall reconstructions.
  • Consequently, manufacturers are investing in resorbable polymer technologies that provide initial support before degrading, transferring load to newly formed native tissue. This innovation is reshaping hospital procurement, as the higher upfront cost of a bioabsorbable material is justified by a 15% reduction in costly revision surgeries, directly impacting the value-based care model.

What challenges does the Soft Tissue Repair Industry face during its growth?

  • Stringent regulatory frameworks and associated compliance costs present a key challenge, potentially affecting industry growth.

  • A significant challenge facing the soft tissue repair market is navigating stringent regulatory frameworks, which can increase product development costs by up to 40% and delay market entry. This heightened scrutiny, particularly for novel biologic grafts and cell therapy products, requires extensive clinical data to prove both safety and clinical efficacy.
  • This regulatory burden disproportionately affects smaller, innovation-focused companies, potentially stifling competition. Consequently, there is a risk of market consolidation, where only larger corporations can absorb the high costs of regulatory compliance. This dynamic can slow the pace of innovation in areas like tissue engineering, where breakthrough technologies often originate from agile startups.

Exclusive Technavio Analysis on Customer Landscape

The soft tissue repair market forecasting report includes the adoption lifecycle of the market, covering from the innovator’s stage to the laggard’s stage. It focuses on adoption rates in different regions based on penetration. Furthermore, the soft tissue repair market report also includes key purchase criteria and drivers of price sensitivity to help companies evaluate and develop their market growth analysis strategies.

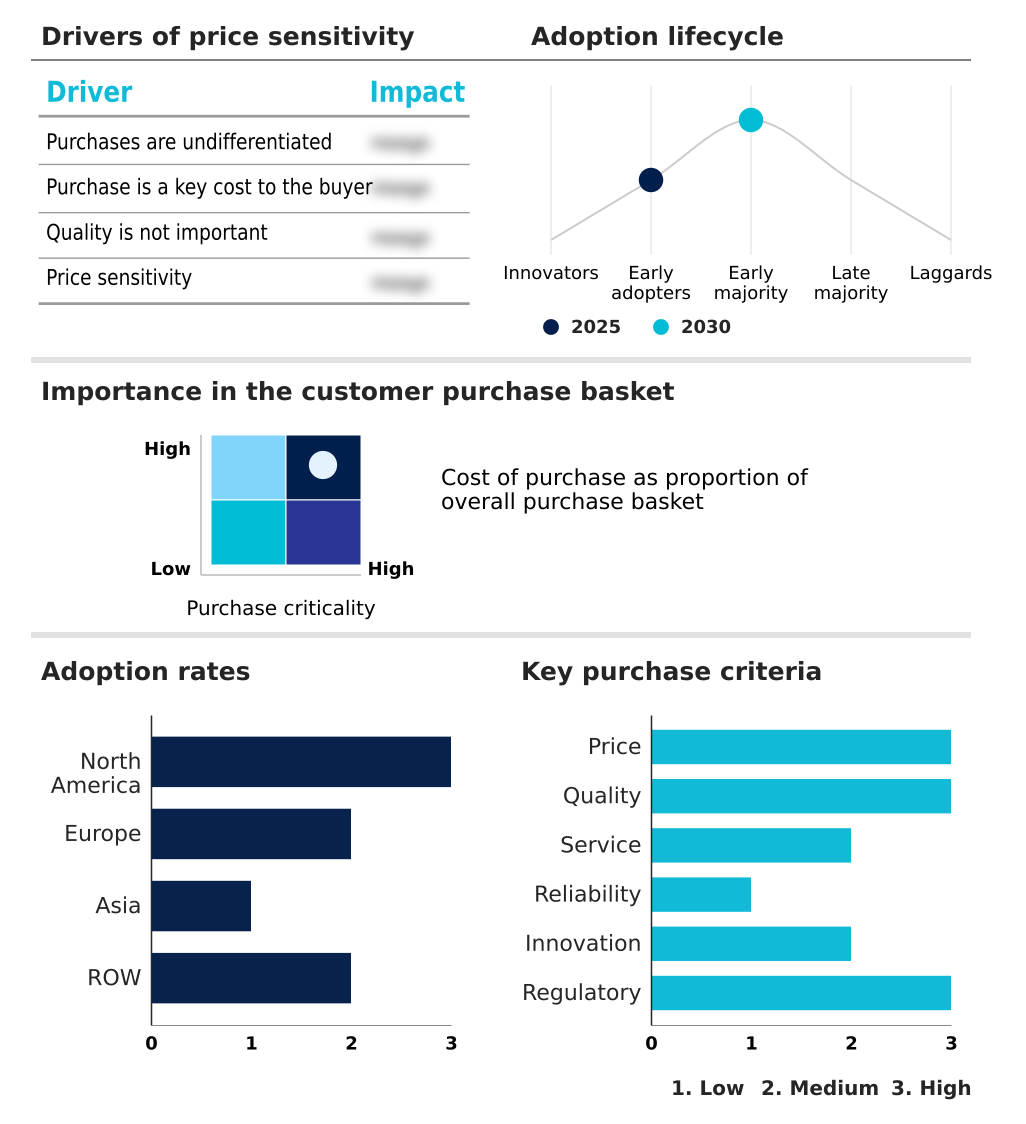
Customer Landscape of Soft Tissue Repair Industry

Competitive Landscape

Companies are implementing various strategies, such as strategic alliances, soft tissue repair market forecast, partnerships, mergers and acquisitions, geographical expansion, and product/service launches, to enhance their presence in the industry.

3M Co. - Analysis indicates a market shift toward bio-inductive scaffolds and all-suture fixation, prioritizing functional restoration over simple mechanical repair for enhanced clinical efficacy.

The industry research and growth report includes detailed analyses of the competitive landscape of the market and information about key companies, including:

  • 3M Co.
  • Acera Surgical Inc.
  • AlloSource
  • Aroa Biosurgery Ltd.
  • Arthrex Inc.
  • Becton Dickinson and Co.
  • CONMED Corp.
  • Integra LifeSciences Corp.
  • Johnson and Johnson Services
  • JRF Ortho
  • LifeCell International Pvt. Ltd.
  • LifeNet Health Inc.
  • Medtronic Plc
  • Organogenesis Holdings Inc.
  • RTI Surgical Inc.
  • Smith and Nephew plc
  • Stryker Corp.
  • Tissue Regenix Group Plc
  • Zimmer Biomet Holdings Inc.

Qualitative and quantitative analysis of companies has been conducted to help clients understand the wider business environment as well as the strengths and weaknesses of key industry players. Data is qualitatively analyzed to categorize companies as pure play, category-focused, industry-focused, and diversified; it is quantitatively analyzed to categorize companies as dominant, leading, strong, tentative, and weak.

Market Intelligence Radar: High-Impact Developments & Growth Signals

  • In the Health Care Equipment industry, the stringent implementation of new medical device regulations, such as the EU MDR, has elevated the requirements for clinical evidence for all implantable devices. This directly impacts the soft tissue repair market by increasing compliance costs and time-to-market for novel biologic graft and synthetic mesh products, compelling manufacturers to invest more heavily in long-term patient registry data to prove clinical efficacy.
  • The widespread adoption of robotic-assisted surgery platforms for general and orthopedic procedures has created a significant pull-through demand for specialized soft tissue repair consumables. This shift is driving innovation in laparoscopic instruments and fixation devices designed for robotic arms, enabling more precise tissue tensioning and minimally invasive techniques in hernia repair and reconstructive surgery.
  • Advancements in polymer science and bioprocessing within the Health Care Equipment sector have enabled the development of hybrid-scale matrix materials. This trend directly influences the soft tissue repair market by offering alternatives to traditional allograft tissue, combining the strength of synthetics with the bio-integrative properties of biologics, thereby improving surgical workflow and patient outcomes.
  • A structural shift of surgical procedures from inpatient hospitals to ambulatory surgery centers (ASCs) is fundamentally altering procurement patterns. This trend compels soft tissue repair manufacturers to develop procedure-in-a-box solutions and single-use, sterile-packed instrument kits that cater to the high-throughput, efficiency-focused model of ASCs, particularly in sports medicine.

Dive into Technavio’s robust research methodology, blending expert interviews, extensive data synthesis, and validated models for unparalleled Soft Tissue Repair Market insights. See full methodology.

Market Scope
Page number 299
Base year 2025
Historic period 2020-2024
Forecast period 2026-2030
Growth momentum & CAGR Accelerate at a CAGR of 4.4%
Market growth 2026-2030 USD 3772.8 million
Market structure Fragmented
YoY growth 2025-2026(%) 4.2%
Key countries US, Canada, Mexico, Germany, UK, France, Italy, Spain, The Netherlands, China, Japan, India, South Korea, Singapore, Thailand, Brazil, Saudi Arabia, Argentina, South Africa, UAE, Turkey, Australia and Colombia
Competitive landscape Leading Companies, Market Positioning of Companies, Competitive Strategies, and Industry Risks

Request Free Sample

Research Analyst Overview

  • The soft tissue repair market ecosystem operates through a complex value chain, where over 60% of innovation is driven by collaborations between raw material suppliers of specialized polymers and biocomposites and device manufacturers.
  • These manufacturers, including both large corporations and niche biotech firms, develop products like biologic grafts and synthetic mesh that must navigate stringent regulatory pathways overseen by bodies like the FDA, a process that can add up to 30% to development costs.
  • Distribution channels are bifurcated, with direct sales forces targeting high-volume hospitals and a network of distributors serving ambulatory surgery centers and clinics. End-users—surgeons in sports medicine and reconstructive surgery—heavily influence purchasing decisions based on clinical efficacy and surgical workflow integration. This entire system is supported by R&D institutions that provide the foundational science for market access.

What are the Key Data Covered in this Soft Tissue Repair Market Research and Growth Report?

  • What is the expected growth of the Soft Tissue Repair Market between 2026 and 2030?

    • The Soft Tissue Repair Market is expected to grow by USD 3.77 billion during 2026-2030, registering a CAGR of 4.4%. Year-over-year growth in 2026 is estimated at 4.2%%. This acceleration is shaped by increasing incidence of sports-related injuries and active aging population, which is intensifying demand across multiple end-use verticals covered in the report.

  • What segmentation does the market report cover?

    • The report is segmented by End-user (Hospitals, Ambulatory surgical services, and Clinics), Product (Soft tissue fixation devices and accessories, Cell therapy, and Tissue scaffold), Product Type (Tissue matrix, Tissue fixation products, and Laparoscopic instruments) and Geography (North America, Europe, Asia, Rest of World (ROW)). Among these, the Hospitals segment is estimated to witness significant growth during the forecast period, driven by rising adoption across key application areas. Each segment includes detailed qualitative and quantitative analysis, along with historical data from 2020-2024 and forecasts through 2030 with year-over-year growth rates.

  • Which regions are analyzed in the report?

    • The report covers North America, Europe, Asia and Rest of World (ROW). North America is estimated to contribute 38.4% to market growth during the forecast period. Country-level analysis includes US, Canada, Mexico, Germany, UK, France, Italy, Spain, The Netherlands, China, Japan, India, South Korea, Singapore, Thailand, Brazil, Saudi Arabia, Argentina, South Africa, UAE, Turkey, Australia and Colombia, with dedicated market size tables and year-over-year growth for each.

  • What are the key growth drivers and market challenges?

    • The primary driver is increasing incidence of sports-related injuries and active aging population, which is accelerating investment and industry demand. The main challenge is stringent regulatory frameworks and compliance costs, creating operational barriers for key market participants. The report quantifies the impact of each driver and challenge across 2026 and 2030 with comparative analysis.

  • Who are the major players in the Soft Tissue Repair Market?

    • Key vendors include 3M Co., Acera Surgical Inc., AlloSource, Aroa Biosurgery Ltd., Arthrex Inc., Becton Dickinson and Co., CONMED Corp., Integra LifeSciences Corp., Johnson and Johnson Services, JRF Ortho, LifeCell International Pvt. Ltd., LifeNet Health Inc., Medtronic Plc, Organogenesis Holdings Inc., RTI Surgical Inc., Smith and Nephew plc, Stryker Corp., Tissue Regenix Group Plc and Zimmer Biomet Holdings Inc.. The report provides qualitative and quantitative analysis categorizing companies as dominant, leading, strong, tentative, and weak based on their market positioning. Company profiles include business segment analysis, SWOT assessment, key offerings, and recent strategic developments.

Market Research Insights

  • The competitive landscape for soft tissue repair features a mix of large MedTech corporations and specialized biologic firms, with the top five players controlling approximately 60% of the market. Key vendors are focusing on innovation in minimally invasive techniques and bio-inductive materials.
  • For instance, recent developments center on all-suture anchor technology for arthroscopic surgery and the expansion of bio-inductive implant portfolios, which have driven a 10% year-over-year growth in the sports medicine segment for some players. These actions address the industry's demand for procedural solutions that accelerate patient recovery and improve functional outcomes.
  • However, the entire sector faces the persistent challenge of navigating complex reimbursement frameworks, which can limit the adoption of premium-priced technologies despite their demonstrated clinical benefits.

We can help! Our analysts can customize this soft tissue repair market research report to meet your requirements.

Get in touch

1. Executive Summary

1.1 Market overview

Executive Summary - Chart on Market Overview
Executive Summary - Data Table on Market Overview
Executive Summary - Chart on Global Market Characteristics
Executive Summary - Chart on Market by Geography
Executive Summary - Chart on Market Segmentation by End-user
Executive Summary - Chart on Market Segmentation by Product
Executive Summary - Chart on Market Segmentation by Product Type
Executive Summary - Chart on Incremental Growth
Executive Summary - Data Table on Incremental Growth
Executive Summary - Chart on Company Market Positioning

2. Technavio Analysis

2.1 Analysis of price sensitivity, lifecycle, customer purchase basket, adoption rates, and purchase criteria

2.2 Criticality of inputs and Factors of differentiation

Chart on Overview on criticality of inputs and factors of differentiation

2.3 Factors of disruption

Chart on Overview on factors of disruption

2.4 Impact of drivers and challenges

Chart on Impact of drivers and challenges in 2025 and 2030

3. Market Landscape

3.1 Market ecosystem

Chart on Parent Market
Data Table on - Parent Market

3.2 Market characteristics

Chart on Market characteristics analysis

3.3 Value chain analysis

Chart on Value chain analysis

4. Market Sizing

4.1 Market definition

Data Table on Offerings of companies included in the market definition

4.2 Market segment analysis

Market segments

4.3 Market size 2025

4.4 Market outlook: Forecast for 2025-2030

Chart on Global - Market size and forecast 2025-2030 ($ million)
Data Table on Global - Market size and forecast 2025-2030 ($ million)
Chart on Global Market: Year-over-year growth 2025-2030 (%)
Data Table on Global Market: Year-over-year growth 2025-2030 (%)

5. Historic Market Size

5.1 Global Soft Tissue Repair Market 2020 - 2024

Historic Market Size - Data Table on Global Soft Tissue Repair Market 2020 - 2024 ($ million)

5.2 End-user segment analysis 2020 - 2024

Historic Market Size - End-user Segment 2020 - 2024 ($ million)

5.3 Product segment analysis 2020 - 2024

Historic Market Size - Product Segment 2020 - 2024 ($ million)

5.4 Product Type segment analysis 2020 - 2024

Historic Market Size - Product Type Segment 2020 - 2024 ($ million)

5.5 Geography segment analysis 2020 - 2024

Historic Market Size - Geography Segment 2020 - 2024 ($ million)

5.6 Country segment analysis 2020 - 2024

Historic Market Size - Country Segment 2020 - 2024 ($ million)

6. Qualitative Analysis

6.1 Impact of AI on Global Soft Tissue Repair Market

7. Five Forces Analysis

7.1 Five forces summary

Five forces analysis - Comparison between 2025 and 2030

7.2 Bargaining power of buyers

Bargaining power of buyers - Impact of key factors 2025 and 2030

7.3 Bargaining power of suppliers

Bargaining power of suppliers - Impact of key factors in 2025 and 2030

7.4 Threat of new entrants

Threat of new entrants - Impact of key factors in 2025 and 2030

7.5 Threat of substitutes

Threat of substitutes - Impact of key factors in 2025 and 2030

7.6 Threat of rivalry

Threat of rivalry - Impact of key factors in 2025 and 2030

7.7 Market condition

Chart on Market condition - Five forces 2025 and 2030

8. Market Segmentation by End-user

8.1 Market segments

Chart on End-user - Market share 2025-2030 (%)
Data Table on End-user - Market share 2025-2030 (%)

8.2 Comparison by End-user

Chart on Comparison by End-user
Data Table on Comparison by End-user

8.3 Hospitals - Market size and forecast 2025-2030

Chart on Hospitals - Market size and forecast 2025-2030 ($ million)
Data Table on Hospitals - Market size and forecast 2025-2030 ($ million)
Chart on Hospitals - Year-over-year growth 2025-2030 (%)
Data Table on Hospitals - Year-over-year growth 2025-2030 (%)

8.4 Ambulatory surgical services - Market size and forecast 2025-2030

Chart on Ambulatory surgical services - Market size and forecast 2025-2030 ($ million)
Data Table on Ambulatory surgical services - Market size and forecast 2025-2030 ($ million)
Chart on Ambulatory surgical services - Year-over-year growth 2025-2030 (%)
Data Table on Ambulatory surgical services - Year-over-year growth 2025-2030 (%)

8.5 Clinics - Market size and forecast 2025-2030

Chart on Clinics - Market size and forecast 2025-2030 ($ million)
Data Table on Clinics - Market size and forecast 2025-2030 ($ million)
Chart on Clinics - Year-over-year growth 2025-2030 (%)
Data Table on Clinics - Year-over-year growth 2025-2030 (%)

8.6 Market opportunity by End-user

Market opportunity by End-user ($ million)
Data Table on Market opportunity by End-user ($ million)

9. Market Segmentation by Product

9.1 Market segments

Chart on Product - Market share 2025-2030 (%)
Data Table on Product - Market share 2025-2030 (%)

9.2 Comparison by Product

Chart on Comparison by Product
Data Table on Comparison by Product

9.3 Soft tissue fixation devices and accessories - Market size and forecast 2025-2030

Chart on Soft tissue fixation devices and accessories - Market size and forecast 2025-2030 ($ million)
Data Table on Soft tissue fixation devices and accessories - Market size and forecast 2025-2030 ($ million)
Chart on Soft tissue fixation devices and accessories - Year-over-year growth 2025-2030 (%)
Data Table on Soft tissue fixation devices and accessories - Year-over-year growth 2025-2030 (%)

9.4 Cell therapy - Market size and forecast 2025-2030

Chart on Cell therapy - Market size and forecast 2025-2030 ($ million)
Data Table on Cell therapy - Market size and forecast 2025-2030 ($ million)
Chart on Cell therapy - Year-over-year growth 2025-2030 (%)
Data Table on Cell therapy - Year-over-year growth 2025-2030 (%)

9.5 Tissue scaffold - Market size and forecast 2025-2030

Chart on Tissue scaffold - Market size and forecast 2025-2030 ($ million)
Data Table on Tissue scaffold - Market size and forecast 2025-2030 ($ million)
Chart on Tissue scaffold - Year-over-year growth 2025-2030 (%)
Data Table on Tissue scaffold - Year-over-year growth 2025-2030 (%)

9.6 Market opportunity by Product

Market opportunity by Product ($ million)
Data Table on Market opportunity by Product ($ million)

10. Market Segmentation by Product Type

10.1 Market segments

Chart on Product Type - Market share 2025-2030 (%)
Data Table on Product Type - Market share 2025-2030 (%)

10.2 Comparison by Product Type

Chart on Comparison by Product Type
Data Table on Comparison by Product Type

10.3 Tissue matrix - Market size and forecast 2025-2030

Chart on Tissue matrix - Market size and forecast 2025-2030 ($ million)
Data Table on Tissue matrix - Market size and forecast 2025-2030 ($ million)
Chart on Tissue matrix - Year-over-year growth 2025-2030 (%)
Data Table on Tissue matrix - Year-over-year growth 2025-2030 (%)

10.4 Tissue fixation products - Market size and forecast 2025-2030

Chart on Tissue fixation products - Market size and forecast 2025-2030 ($ million)
Data Table on Tissue fixation products - Market size and forecast 2025-2030 ($ million)
Chart on Tissue fixation products - Year-over-year growth 2025-2030 (%)
Data Table on Tissue fixation products - Year-over-year growth 2025-2030 (%)

10.5 Laparoscopic instruments - Market size and forecast 2025-2030

Chart on Laparoscopic instruments - Market size and forecast 2025-2030 ($ million)
Data Table on Laparoscopic instruments - Market size and forecast 2025-2030 ($ million)
Chart on Laparoscopic instruments - Year-over-year growth 2025-2030 (%)
Data Table on Laparoscopic instruments - Year-over-year growth 2025-2030 (%)

10.6 Market opportunity by Product Type

Market opportunity by Product Type ($ million)
Data Table on Market opportunity by Product Type ($ million)

11. Customer Landscape

11.1 Customer landscape overview

Analysis of price sensitivity, lifecycle, customer purchase basket, adoption rates, and purchase criteria

12. Geographic Landscape

12.1 Geographic segmentation

Chart on Market share by geography 2025-2030 (%)
Data Table on Market share by geography 2025-2030 (%)

12.2 Geographic comparison

Chart on Geographic comparison
Data Table on Geographic comparison

12.3 North America - Market size and forecast 2025-2030

Chart on North America - Market size and forecast 2025-2030 ($ million)
Data Table on North America - Market size and forecast 2025-2030 ($ million)
Chart on North America - Year-over-year growth 2025-2030 (%)
Data Table on North America - Year-over-year growth 2025-2030 (%)
Chart on Regional Comparison - North America
Data Table on Regional Comparison - North America

12.3.1 US - Market size and forecast 2025-2030

Chart on US - Market size and forecast 2025-2030 ($ million)
Data Table on US - Market size and forecast 2025-2030 ($ million)
Chart on US - Year-over-year growth 2025-2030 (%)
Data Table on US - Year-over-year growth 2025-2030 (%)

12.3.2 Canada - Market size and forecast 2025-2030

Chart on Canada - Market size and forecast 2025-2030 ($ million)
Data Table on Canada - Market size and forecast 2025-2030 ($ million)
Chart on Canada - Year-over-year growth 2025-2030 (%)
Data Table on Canada - Year-over-year growth 2025-2030 (%)

12.3.3 Mexico - Market size and forecast 2025-2030

Chart on Mexico - Market size and forecast 2025-2030 ($ million)
Data Table on Mexico - Market size and forecast 2025-2030 ($ million)
Chart on Mexico - Year-over-year growth 2025-2030 (%)
Data Table on Mexico - Year-over-year growth 2025-2030 (%)

12.4 Europe - Market size and forecast 2025-2030

Chart on Europe - Market size and forecast 2025-2030 ($ million)
Data Table on Europe - Market size and forecast 2025-2030 ($ million)
Chart on Europe - Year-over-year growth 2025-2030 (%)
Data Table on Europe - Year-over-year growth 2025-2030 (%)
Chart on Regional Comparison - Europe
Data Table on Regional Comparison - Europe

12.4.1 Germany - Market size and forecast 2025-2030

Chart on Germany - Market size and forecast 2025-2030 ($ million)
Data Table on Germany - Market size and forecast 2025-2030 ($ million)
Chart on Germany - Year-over-year growth 2025-2030 (%)
Data Table on Germany - Year-over-year growth 2025-2030 (%)

12.4.2 UK - Market size and forecast 2025-2030

Chart on UK - Market size and forecast 2025-2030 ($ million)
Data Table on UK - Market size and forecast 2025-2030 ($ million)
Chart on UK - Year-over-year growth 2025-2030 (%)
Data Table on UK - Year-over-year growth 2025-2030 (%)

12.4.3 France - Market size and forecast 2025-2030

Chart on France - Market size and forecast 2025-2030 ($ million)
Data Table on France - Market size and forecast 2025-2030 ($ million)
Chart on France - Year-over-year growth 2025-2030 (%)
Data Table on France - Year-over-year growth 2025-2030 (%)

12.4.4 Italy - Market size and forecast 2025-2030

Chart on Italy - Market size and forecast 2025-2030 ($ million)
Data Table on Italy - Market size and forecast 2025-2030 ($ million)
Chart on Italy - Year-over-year growth 2025-2030 (%)
Data Table on Italy - Year-over-year growth 2025-2030 (%)

12.4.5 Spain - Market size and forecast 2025-2030

Chart on Spain - Market size and forecast 2025-2030 ($ million)
Data Table on Spain - Market size and forecast 2025-2030 ($ million)
Chart on Spain - Year-over-year growth 2025-2030 (%)
Data Table on Spain - Year-over-year growth 2025-2030 (%)

12.4.6 The Netherlands - Market size and forecast 2025-2030

Chart on The Netherlands - Market size and forecast 2025-2030 ($ million)
Data Table on The Netherlands - Market size and forecast 2025-2030 ($ million)
Chart on The Netherlands - Year-over-year growth 2025-2030 (%)
Data Table on The Netherlands - Year-over-year growth 2025-2030 (%)

12.5 Asia - Market size and forecast 2025-2030

Chart on Asia - Market size and forecast 2025-2030 ($ million)
Data Table on Asia - Market size and forecast 2025-2030 ($ million)
Chart on Asia - Year-over-year growth 2025-2030 (%)
Data Table on Asia - Year-over-year growth 2025-2030 (%)
Chart on Regional Comparison - Asia
Data Table on Regional Comparison - Asia

12.5.1 China - Market size and forecast 2025-2030

Chart on China - Market size and forecast 2025-2030 ($ million)
Data Table on China - Market size and forecast 2025-2030 ($ million)
Chart on China - Year-over-year growth 2025-2030 (%)
Data Table on China - Year-over-year growth 2025-2030 (%)

12.5.2 Japan - Market size and forecast 2025-2030

Chart on Japan - Market size and forecast 2025-2030 ($ million)
Data Table on Japan - Market size and forecast 2025-2030 ($ million)
Chart on Japan - Year-over-year growth 2025-2030 (%)
Data Table on Japan - Year-over-year growth 2025-2030 (%)

12.5.3 India - Market size and forecast 2025-2030

Chart on India - Market size and forecast 2025-2030 ($ million)
Data Table on India - Market size and forecast 2025-2030 ($ million)
Chart on India - Year-over-year growth 2025-2030 (%)
Data Table on India - Year-over-year growth 2025-2030 (%)

12.5.4 South Korea - Market size and forecast 2025-2030

Chart on South Korea - Market size and forecast 2025-2030 ($ million)
Data Table on South Korea - Market size and forecast 2025-2030 ($ million)
Chart on South Korea - Year-over-year growth 2025-2030 (%)
Data Table on South Korea - Year-over-year growth 2025-2030 (%)

12.5.5 Singapore - Market size and forecast 2025-2030

Chart on Singapore - Market size and forecast 2025-2030 ($ million)
Data Table on Singapore - Market size and forecast 2025-2030 ($ million)
Chart on Singapore - Year-over-year growth 2025-2030 (%)
Data Table on Singapore - Year-over-year growth 2025-2030 (%)

12.5.6 Thailand - Market size and forecast 2025-2030

Chart on Thailand - Market size and forecast 2025-2030 ($ million)
Data Table on Thailand - Market size and forecast 2025-2030 ($ million)
Chart on Thailand - Year-over-year growth 2025-2030 (%)
Data Table on Thailand - Year-over-year growth 2025-2030 (%)

12.6 Rest of World (ROW) - Market size and forecast 2025-2030

Chart on Rest of World (ROW) - Market size and forecast 2025-2030 ($ million)
Data Table on Rest of World (ROW) - Market size and forecast 2025-2030 ($ million)
Chart on Rest of World (ROW) - Year-over-year growth 2025-2030 (%)
Data Table on Rest of World (ROW) - Year-over-year growth 2025-2030 (%)
Chart on Regional Comparison - Rest of World (ROW)
Data Table on Regional Comparison - Rest of World (ROW)

12.6.1 Brazil - Market size and forecast 2025-2030

Chart on Brazil - Market size and forecast 2025-2030 ($ million)
Data Table on Brazil - Market size and forecast 2025-2030 ($ million)
Chart on Brazil - Year-over-year growth 2025-2030 (%)
Data Table on Brazil - Year-over-year growth 2025-2030 (%)

12.6.2 Saudi Arabia - Market size and forecast 2025-2030

Chart on Saudi Arabia - Market size and forecast 2025-2030 ($ million)
Data Table on Saudi Arabia - Market size and forecast 2025-2030 ($ million)
Chart on Saudi Arabia - Year-over-year growth 2025-2030 (%)
Data Table on Saudi Arabia - Year-over-year growth 2025-2030 (%)

12.6.3 Argentina - Market size and forecast 2025-2030

Chart on Argentina - Market size and forecast 2025-2030 ($ million)
Data Table on Argentina - Market size and forecast 2025-2030 ($ million)
Chart on Argentina - Year-over-year growth 2025-2030 (%)
Data Table on Argentina - Year-over-year growth 2025-2030 (%)

12.6.4 South Africa - Market size and forecast 2025-2030

Chart on South Africa - Market size and forecast 2025-2030 ($ million)
Data Table on South Africa - Market size and forecast 2025-2030 ($ million)
Chart on South Africa - Year-over-year growth 2025-2030 (%)
Data Table on South Africa - Year-over-year growth 2025-2030 (%)

12.6.5 UAE - Market size and forecast 2025-2030

Chart on UAE - Market size and forecast 2025-2030 ($ million)
Data Table on UAE - Market size and forecast 2025-2030 ($ million)
Chart on UAE - Year-over-year growth 2025-2030 (%)
Data Table on UAE - Year-over-year growth 2025-2030 (%)

12.6.6 Turkey - Market size and forecast 2025-2030

Chart on Turkey - Market size and forecast 2025-2030 ($ million)
Data Table on Turkey - Market size and forecast 2025-2030 ($ million)
Chart on Turkey - Year-over-year growth 2025-2030 (%)
Data Table on Turkey - Year-over-year growth 2025-2030 (%)

12.6.7 Australia - Market size and forecast 2025-2030

Chart on Australia - Market size and forecast 2025-2030 ($ million)
Data Table on Australia - Market size and forecast 2025-2030 ($ million)
Chart on Australia - Year-over-year growth 2025-2030 (%)
Data Table on Australia - Year-over-year growth 2025-2030 (%)

12.6.8 Colombia - Market size and forecast 2025-2030

Chart on Colombia - Market size and forecast 2025-2030 ($ million)
Data Table on Colombia - Market size and forecast 2025-2030 ($ million)
Chart on Colombia - Year-over-year growth 2025-2030 (%)
Data Table on Colombia - Year-over-year growth 2025-2030 (%)

12.7 Market opportunity by geography

Market opportunity by geography ($ million)
Data Tables on Market opportunity by geography ($ million)

13. Drivers, Challenges, and Opportunity

13.1 Market drivers

Increasing incidence of sports-related injuries and active aging population
Technological convergence in biologics and regenerative matrices
Expansion of minimally invasive and robotic-assisted surgical ecosystems

13.2 Market challenges

Stringent regulatory frameworks and compliance costs
Reimbursement constraints and value-based care pressures
Integration complexities and professional training gaps

13.3 Impact of drivers and challenges

Impact of drivers and challenges in 2025 and 2030

13.4 Market opportunities

Convergence of synthetic and biologic material properties
Digitalization of preoperative planning and intraoperative guidance
Procedure-specific innovation for ambulatory setting

14. Competitive Landscape

14.1 Overview

14.2

Overview on criticality of inputs and factors of differentiation

14.3 Landscape disruption

Overview on factors of disruption

14.4 Industry risks

Impact of key risks on business

15. Competitive Analysis

15.1 Companies profiled

Companies covered

15.2 Company ranking index

15.3 Market positioning of companies

Matrix on companies position and classification

15.4 3M Co.

3M Co. - Overview
3M Co. - Business segments
3M Co. - Key news
3M Co. - Key offerings
3M Co. - Segment focus
SWOT

15.5 Acera Surgical Inc.

Acera Surgical Inc. - Overview
Acera Surgical Inc. - Product / Service
Acera Surgical Inc. - Key offerings
SWOT

15.6 Arthrex Inc.

Arthrex Inc. - Overview
Arthrex Inc. - Product / Service
Arthrex Inc. - Key offerings
SWOT

15.7 Becton Dickinson and Co.

Becton Dickinson and Co. - Overview
Becton Dickinson and Co. - Business segments
Becton Dickinson and Co. - Key news
Becton Dickinson and Co. - Key offerings
Becton Dickinson and Co. - Segment focus
SWOT

15.8 CONMED Corp.

CONMED Corp. - Overview
CONMED Corp. - Product / Service
CONMED Corp. - Key offerings
SWOT

15.9 Integra LifeSciences Corp.

Integra LifeSciences Corp. - Overview
Integra LifeSciences Corp. - Business segments
Integra LifeSciences Corp. - Key news
Integra LifeSciences Corp. - Key offerings
Integra LifeSciences Corp. - Segment focus
SWOT

15.10 Johnson and Johnson Services

Johnson and Johnson Services - Overview
Johnson and Johnson Services - Business segments
Johnson and Johnson Services - Key news
Johnson and Johnson Services - Key offerings
Johnson and Johnson Services - Segment focus
SWOT

15.11 LifeCell International Pvt. Ltd.

LifeCell International Pvt. Ltd. - Overview
LifeCell International Pvt. Ltd. - Product / Service
LifeCell International Pvt. Ltd. - Key offerings
SWOT

15.12 LifeNet Health Inc.

LifeNet Health Inc. - Overview
LifeNet Health Inc. - Product / Service
LifeNet Health Inc. - Key offerings
SWOT

15.13 Medtronic Plc

Medtronic Plc - Overview
Medtronic Plc - Business segments
Medtronic Plc - Key news
Medtronic Plc - Key offerings
Medtronic Plc - Segment focus
SWOT

15.14 Organogenesis Holdings Inc.

Organogenesis Holdings Inc. - Overview
Organogenesis Holdings Inc. - Product / Service
Organogenesis Holdings Inc. - Key offerings
SWOT

15.15 RTI Surgical Inc.

RTI Surgical Inc. - Overview
RTI Surgical Inc. - Product / Service
RTI Surgical Inc. - Key offerings
SWOT

15.16 Smith and Nephew plc

Smith and Nephew plc - Overview
Smith and Nephew plc - Business segments
Smith and Nephew plc - Key news
Smith and Nephew plc - Key offerings
Smith and Nephew plc - Segment focus
SWOT

15.17 Stryker Corp.

Stryker Corp. - Overview
Stryker Corp. - Business segments
Stryker Corp. - Key news
Stryker Corp. - Key offerings
Stryker Corp. - Segment focus
SWOT

15.18 Zimmer Biomet Holdings Inc.

Zimmer Biomet Holdings Inc. - Overview
Zimmer Biomet Holdings Inc. - Business segments
Zimmer Biomet Holdings Inc. - Key news
Zimmer Biomet Holdings Inc. - Key offerings
Zimmer Biomet Holdings Inc. - Segment focus
SWOT

16. Appendix

16.1 Scope of the report

Market definition
Objectives
Notes and caveats

16.2 Inclusions and exclusions checklist

Inclusions checklist
Exclusions checklist

16.3 Currency conversion rates for US$

16.4 Research methodology

16.5 Data procurement

Information sources

16.6 Data validation

16.7 Validation techniques employed for market sizing

16.8 Data synthesis

16.9 360 degree market analysis

16.10 List of abbreviations

Research Methodology

Technavio presents a detailed picture of the market by way of study, synthesis, and summation of data from multiple sources. The analysts have presented the various facets of the market with a particular focus on identifying the key industry influencers. The data thus presented is comprehensive, reliable, and the result of extensive research, both primary and secondary.

INFORMATION SOURCES

Primary sources

  • Manufacturers and suppliers
  • Channel partners
  • Industry experts
  • Strategic decision makers

Secondary sources

  • Industry journals and periodicals
  • Government data
  • Financial reports of key industry players
  • Historical data
  • Press releases

DATA ANALYSIS

Data Synthesis

  • Collation of data
  • Estimation of key figures
  • Analysis of derived insights

Data Validation

  • Triangulation with data models
  • Reference against proprietary databases
  • Corroboration with industry experts

REPORT WRITING

Qualitative

  • Market drivers
  • Market challenges
  • Market trends
  • Five forces analysis

Quantitative

  • Market size and forecast
  • Market segmentation
  • Geographical insights
  • Competitive landscape

Interested in this report?

Get your sample now to see our research methodology and insights!

Download Now

Frequently Asked Questions

Soft Tissue Repair market growth will increase by USD 3772.8 million during 2026-2030.

The Soft Tissue Repair market is expected to grow at a CAGR of 4.4% during 2026-2030.

Soft Tissue Repair market is segmented by End-user (Hospitals, Ambulatory surgical services, Clinics) Product (Soft tissue fixation devices and accessories, Cell therapy, Tissue scaffold) Product type (Tissue matrix, Tissue fixation products, Laparoscopic instruments)

3M Co., Acera Surgical Inc., AlloSource, Aroa Biosurgery Ltd., Arthrex Inc., Becton Dickinson and Co., CONMED Corp., Integra LifeSciences Corp., Johnson and Johnson Services, JRF Ortho, LifeCell International Pvt. Ltd., LifeNet Health Inc., Medtronic Plc, Organogenesis Holdings Inc., RTI Surgical Inc., Smith and Nephew plc, Stryker Corp., Tissue Regenix Group Plc, Zimmer Biomet Holdings Inc. are a few of the key vendors in the Soft Tissue Repair market.

North America will register the highest growth rate of 38.4% among the other regions. Therefore, the Soft Tissue Repair market in North America is expected to garner significant business opportunities for the vendors during the forecast period.

US, Canada, Mexico, Germany, UK, France, Italy, Spain, The Netherlands, China, Japan, India, South Korea, Singapore, Thailand, Brazil, Saudi Arabia, Argentina, South Africa, UAE, Turkey, Australia, Colombia

  • Increasing incidence of sports-related injuries and active aging population is the driving factor this market.

The Soft Tissue Repair market vendors should focus on grabbing business opportunities from the End-user segment as it accounted for the largest market share in the base year.
RIA - Research AI Assistant
Ask RIA