Software-Defined Networking (SDN) Market Analysis North America, APAC, Europe, South America, Middle East and Africa - US, Australia, China, Japan, UK - Size and Forecast 2024-2028

Software-Defined Networking (SDN) Market Analysis North America, APAC, Europe, South America, Middle East and Africa - US, Australia, China, Japan, UK - Size and Forecast 2024-2028

Published: Oct 2023 186 Pages SKU: IRTNTR71948

Market Overview at a Glance

$67.38 B
Market Opportunity
29.04%
CAGR
28.55
YoY growth 2023-2024(%)

Software-Defined Networking (SDN) Market Size 2024-2028 

The software-defined networking (SDN) market size is forecast to increase by USD 67.38 billion at a CAGR of 29.04% between 2023 and 2028. The market is experiencing remarkable growth due to several key drivers. First, the increasing adoption of cloud solutions by various industries, including banking, financial services, and insurance (BFSI), is fueling the demand for SDN technology. Second, the proliferation of the Internet of Things (IoT) and edge computing is creating complex network design challenges that SDN is well-positioned to address. Network policies and security configurations can be centrally managed and applied consistently across the organization, ensuring optimal application performance. The BFSI segment, in particular, stands to benefit from SDN's ability to improve network agility and security while reducing operational costs. This trend is expected to continue, making SDN an essential technology for businesses looking to streamline their IT infrastructure and enhance their customer experience.  In summary, the SDN market is witnessing substantial growth due to the adoption of cloud solutions, the emergence of 5G technology, and the need for advanced security technologies.

Market Analysis

Software-Defined Networking (SDN) Market Size

 Request Free Sample

Software-Defined Networking (SDN) is a revolutionary network architecture that separates the control plane from the data plane, enabling network managers to centrally manage network resources and traffic flows in real-time. This approach offers numerous benefits, including increased network agility, improved network performance, and enhanced security. However, the adoption of SDN also presents certain challenges and emerging threats that require continuous monitoring and advanced security technologies. SDN architectures offer control functions that enable network administrators to make quick decisions and respond to disruptions, unauthorized access, malicious activities, and system failures.

Moreover, these functions include authentication mechanisms, encryption protocols, and continuous monitoring. However, the centralized controller used in SDN can be a potential target for targeted attacks, making security a top priority. The SDN market is witnessing significant growth due to the increasing demand for intelligent network architectures in the 5G ecosystem. The 5G ecosystem requires high network bandwidth, low latency, and network redundancy to support the massive data flows generated by IoT devices and other connected devices. SDN provides the flexibility and agility required to meet these demands and address reliability concerns. Despite the benefits, SDN adoption faces challenges related to network outages and collaboration between enterprises segment.

Network outages can lead to significant downtime and revenue loss, making network reliability a critical concern. Collaboration between enterprises is also essential to ensure seamless communication and data exchange in SDN environments. Advanced security technologies, such as machine learning and artificial intelligence, are being integrated into SDN to address emerging threats. These technologies enable real-time threat detection and response, ensuring the security and integrity of network resources. In conclusion, the SDN market is experiencing significant growth due to the increasing demand for agile networks and intelligent network architectures in the 5G ecosystem. While SDN offers numerous benefits, it also presents certain challenges related to security and network reliability. Continuous monitoring, advanced security technologies, and collaboration between enterprises are essential to ensure the successful adoption and implementation of SDN.

Market Segmentation

The market research report provides comprehensive data (region-wise segment analysis), with forecasts and estimates in "USD billion" for the period 2024-2028, as well as historical data from 2018-2022 for the following segments.

  • End-user
    • BFSI
    • Healthcare
    • Retail
    • Education
    • Others
  • Component
    • Physical network infrastructure
    • SDN applications
    • Controller software
  • Geography
    • North America
      • US
    • APAC
      • China
      • Japan
    • Europe
      • UK
    • South America
    • Middle East and Africa

By End-user Insights

The BFSI segment is estimated to witness significant growth during the forecast period. Software-Defined Networking (SDN) is a cutting-edge technology that offers significant benefits to secure networks in various industries, particularly in high-performance sectors like financial services. In the US market, the Banking, Finance, Services, and Insurance (BFSI) segment is poised for substantial growth in the SDN domain. This technology enables financial institutions to manage their networks more effectively, ensuring compliance and optimizing traffic flows. SDN's centralized management system offers enhanced security features, allowing financial organizations to implement and enforce strict safety rules. This centralized approach is crucial for safeguarding sensitive financial data, whether it's stored on-site or in the cloud. The advantages of SDN for financial institutions include streamlined provisioning and management, improved application performance, and reduced operational costs.

Moreover, the integration of SDN with Zero Trust security models further strengthens network security, especially in the context of the increasing number of Internet of Things (IoT) devices and ecosystems. Symantec, a leading cybersecurity company, highlights the importance of SDN in securing networks against advanced threats. The US market for SDN is expected to witness increased adoption as financial institutions recognize the potential of this technology to optimize their networks while maintaining the highest levels of security.

Software-Defined Networking (SDN) Market Size

Get a glance at the market share of various segments Request Free Sample

The BFSI segment accounted for USD 2.94 billion in 2018 and showed a gradual increase during the forecast period.

Regional Insights

North America is estimated to contribute 38% to the growth of the global market during the forecast period. Technavio's analysts have elaborately explained the regional trends and drivers that shape the market during the forecast period.

Software-Defined Networking (SDN) Market Share by Geography

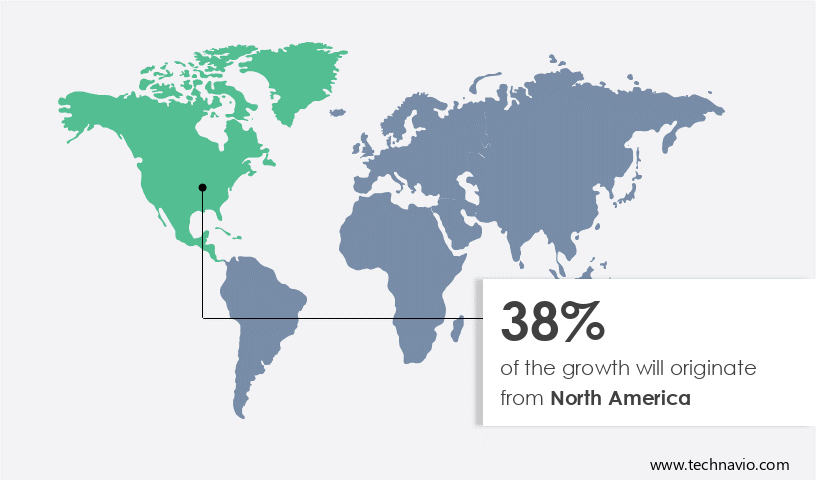
For more insights on the market share of various regions Request Free Sample

In North America, the market is poised for expansion due to the escalating need for advanced network management in response to the increasing adoption of IoT technologies and the rollout of 5G networks. IoT devices generate massive amounts of data, necessitating high-capacity bandwidth. Enterprises are turning to SDN architectures to optimally utilize data center network resources. The proliferation of IoT investments and 5G deployment are anticipated to fuel the demand for SDN solutions in the region. Additionally, industries such as content and digital media, banking, financial services, and insurance (BFSI) require high connectivity with minimal latency, making SDN an indispensable tool for network management. The control functions of SDN architectures offer enhanced security features, including protection against targeted attacks, unauthorized access, and malicious activities, making them a preferred choice for organizations seeking to safeguard their network resources.

Market Dynamics

Our researchers analyzed the data with 2023 as the base year, along with the key drivers, trends, and challenges. A holistic analysis of drivers will help companies refine their marketing strategies to gain a competitive advantage.

Market Driver

High demand for cloud solutions adoption by enterprises is the key driver of the market. The market is experiencing significant growth due to enterprises' increasing adoption of cloud solutions. The primary reasons for this trend are the cost savings from reduced operational expenses and the flexibility to scale resources according to business needs. Hybrid cloud solutions, which combine the benefits of both private and public clouds, have gained popularity among enterprises. These solutions allow businesses to manage their applications and workloads efficiently by allocating resources from multiple clouds.

Moreover, the emergence of 5G technology and the 5G ecosystem is driving the demand for advanced security technologies in SDN. Encryption protocols and continuous monitoring are essential components of SDN security to counteract emerging threats. Intelligent network architectures are being adopted to optimize data flows and network bandwidth, ensuring low latency. As the use of cloud data centers continues to expand, it is crucial to implement strong security measures to protect sensitive data.

Market Trends

The rise of IoT and edge computing is the upcoming trend in the market. Software-defined networking (SDN) has gained significant traction in various industries due to the increasing need to manage and optimize network resources efficiently. With the proliferation of IoT and edge computing, applications such as connected cars, smart homes, and smart cities require low latency and high bandwidth. SDN's ability to control network infrastructure via software offers dynamic resource allocation, a centralized view of forwarding devices, and improved network management. This makes SDN an ideal solution for managing the complex network requirements of IoT applications.

Moreover, enterprises are expanding their operations globally to reach a larger customer base. SDN's centralized management and policy-driven approach enable businesses to implement network policies and security configurations consistently across multiple locations. This not only enhances application performance but also ensures data security. The BFSI segment, including banking and financial services, and the insurance industry, are expected to witness remarkable growth in SDN adoption. SDN's ability to provide real-time network visibility and control can help these industries comply with regulatory requirements and mitigate security threats. In conclusion, SDN's flexibility, scalability, and centralized management make it an essential technology for businesses looking to optimize their network resources and improve application performance. With the increasing adoption of IoT and the expansion of businesses across borders, the demand for SDN is expected to continue growing.

Market Challenge

Network design challenges in SDN technology is a key challenge affecting the market growth. Software-Defined Networking (SDN) has gained considerable attention in the business world due to its advantages, such as efficient resource utilization, compatibility with various forwarding devices, and cost savings. However, enterprises face challenges in adopting SDN, particularly with network design issues. These concerns encompass scalability, fault tolerance, flexibility, and elasticity. Scalability refers to a network's ability to manage unexpected or heavy traffic loads without compromising efficiency. In the event of heavy network usage, potential bottlenecks may occur between the centralized controller and forwarding devices, as a single controller may not be able to accommodate network expansion.

Network reliability is another significant concern for enterprises, as network outages and redundancy issues can lead to collaboration disruptions and a subpar user experience. Agile and responsive networks are essential to meet changing business requirements. SDN offers solutions to these challenges by enabling network administrators to centrally manage and control network traffic, ensuring reliable and efficient communication between devices and enhancing overall network performance.

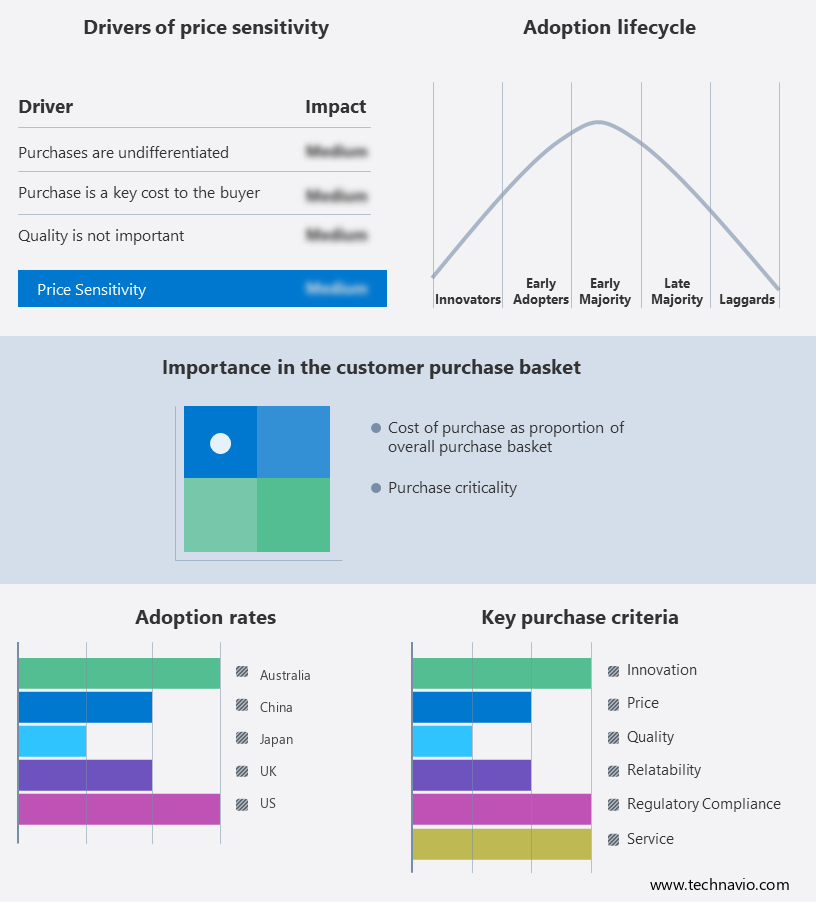
Exclusive Customer Landscape

The market forecasting report includes the adoption lifecycle of the market, covering from the innovator's stage to the laggard's stage. It focuses on adoption rates in different regions based on penetration. Furthermore, the report also includes key purchase criteria and drivers of price sensitivity to help companies evaluate and develop their market growth analysis strategies.

Software-Defined Networking (SDN) Market Share by Geography

 Customer Landscape

Key Companies & Market Insights

Companies are implementing various strategies, such as strategic alliances, partnerships, mergers and acquisitions, geographical expansion, and product/service launches, to enhance their presence in the market.

Arista Networks Inc.: The company offers software-defined networking solutions such as Arista EOS network stack, and network data lake architecture, with the application of artificial intelligence and machine learning (AI/ML) to automation and security challenges.

The market research and growth report includes detailed analyses of the competitive landscape of the market and information about key companies, including:

  • AT and T Inc.
  • Broadcom Inc.
  • Ciena Corp.
  • Cisco Systems Inc.
  • Dell Technologies Inc.
  • Extreme Networks Inc.
  • Hamburgnet eK
  • Hewlett Packard Enterprise Co.
  • Huawei Technologies Co. Ltd.
  • International Business Machines Corp.
  • Juniper Networks Inc.
  • Kyndryl Inc.
  • Nokia Corp.
  • NVIDIA Corp.
  • Oracle Corp.
  • Schweitzer Engineering Laboratories Inc.
  • Telefonaktiebolaget LM Ericsson
  • VMware Inc.
  • Wipro Ltd.

Qualitative and quantitative analysis of companies has been conducted to help clients understand the wider business environment as well as the strengths and weaknesses of key market players. Data is qualitatively analyzed to categorize companies as pure play, category-focused, industry-focused, and diversified; it is quantitatively analyzed to categorize companies as dominant, leading, strong, tentative, and weak.

Research Analyst Overview

Software-Defined Networking (SDN) is a revolutionary network architecture that enables organizations to centrally manage and control their network functions, providing agility, reliability, and security. SDN separates the control plane from the data plane, allowing for dynamic and flexible network management. This technology addresses various challenges, including targeted attacks, system failures, and unauthorized access, through advanced security technologies such as authentication mechanisms, encryption protocols, and continuous monitoring. SDN is increasingly being adopted in diverse industries, including the BFSI segment, to create secure and high-performance networks for financial institutions. The 5G ecosystem and intelligent network architecture are driving the remarkable growth of SDN, enabling dynamic allocation of resources, optimization of traffic flows, and enhancement of security.

Enterprises are embracing SDN to meet changing business requirements, improve collaboration, and deliver a superior user experience. SDN for 5G networks offers low latency, network redundancy, and reliability, addressing concerns related to outages and network collapse. The increasing adoption of IoT devices and ecosystems brings interoperability challenges and security concerns. SDN solutions provide advanced encryption protocols, threat detection mechanisms, and proactive measures to address these challenges. Cloud environments and cloud-native architectures require elasticity, automation, and business agility. SDN infrastructure offers these capabilities, enabling businesses to respond to changing requirements and optimize application performance. Autonomous networks and service providers, including telecom operators, are leveraging SDN to deliver reliable networks and innovative services. The digital landscape is evolving, and SDN is a crucial component of the solution.

Market Scope

Report Coverage

Details

Page number

186

Base year

2023

Historic period

2018-2022

Forecast period

2024-2028

Growth momentum & CAGR

Accelerate at a CAGR of 29.04%

Market Growth 2024-2028

USD 67.38 billion

Market structure

Fragmented

YoY growth 2023-2024(%)

28.55

Regional analysis

North America, APAC, Europe, South America, and Middle East and Africa

Performing market contribution

North America at 38%

Key countries

US, Australia, China, Japan, and UK

Competitive landscape

Leading Companies, Market Positioning of Companies, Competitive Strategies, and Industry Risks

Key companies profiled

Arista Networks Inc., AT and T Inc., Broadcom Inc., Ciena Corp., Cisco Systems Inc., Dell Technologies Inc., Extreme Networks Inc., Hamburgnet eK, Hewlett Packard Enterprise Co., Huawei Technologies Co. Ltd., International Business Machines Corp., Juniper Networks Inc., Kyndryl Inc., Nokia Corp., NVIDIA Corp., Oracle Corp., Schweitzer Engineering Laboratories Inc., Telefonaktiebolaget LM Ericsson, VMware Inc., and Wipro Ltd.

Market dynamics

Parent market analysis, market growth inducers and obstacles, market forecast, fast-growing and slow-growing segment analysis, COVID-19 impact and recovery analysis and future consumer dynamics, market condition analysis for the forecast period

Customization purview

If our market report has not included the data that you are looking for, you can reach out to our analysts and get segments customized.

Request Free Sample

What are the Key Data Covered in this Market Research and Growth Report?

  • CAGR of the market during the forecast period
  • Detailed information on factors that will drive the market growth and forecasting between 2024 and 2028
  • Precise estimation of the size of the market  and its contribution of the market in focus to the parent market
  • Accurate predictions about upcoming market growth and trends and changes in consumer behaviour
  • Growth of the market across North America, APAC, Europe, South America, and Middle East and Africa
  • Thorough analysis of the market's competitive landscape and detailed information about companies
  • Comprehensive analysis of factors that will challenge the growth of market companies

We can help! Our analysts can customize this market research report to meet your requirements. Get in touch

1 Executive Summary

  • 1.1 Market overview
    • Exhibit 01: Executive Summary – Chart on Market Overview
    • Exhibit 02: Executive Summary – Data Table on Market Overview
    • Exhibit 03: Executive Summary – Chart on Global Market Characteristics
    • Exhibit 04: Executive Summary – Chart on Market by Geography
    • Exhibit 05: Executive Summary – Chart on Market Segmentation by End-user
    • Exhibit 06: Executive Summary – Chart on Market Segmentation by Component
    • Exhibit 07: Executive Summary – Chart on Incremental Growth
    • Exhibit 08: Executive Summary – Data Table on Incremental Growth
    • Exhibit 09: Executive Summary – Chart on Vendor Market Positioning

2 Market Landscape

  • 2.1 Market ecosystem
    • Exhibit 10: Parent market
    • Exhibit 11: Market Characteristics

3 Market Sizing

  • 3.1 Market definition
    • Exhibit 12: Offerings of vendors included in the market definition
  • 3.2 Market segment analysis
    • Exhibit 13: Market segments
  • 3.3 Market size 2023
    • 3.4 Market outlook: Forecast for 2023-2028
      • Exhibit 14: Chart on Global - Market size and forecast 2023-2028 ($ million)
      • Exhibit 15: Data Table on Global - Market size and forecast 2023-2028 ($ million)
      • Exhibit 16: Chart on Global Market: Year-over-year growth 2023-2028 (%)
      • Exhibit 17: Data Table on Global Market: Year-over-year growth 2023-2028 (%)

    4 Historic Market Size

    • 4.1 Global software-defined networking (SDN) market 2018 - 2022
      • Exhibit 18: Historic Market Size – Data Table on global software-defined networking (sdn) market 2018 - 2022 ($ million)
    • 4.2 End-user Segment Analysis 2018 - 2022
      • Exhibit 19: Historic Market Size – End-user Segment 2018 - 2022 ($ million)
    • 4.3 Component Segment Analysis 2018 - 2022
      • Exhibit 20: Historic Market Size – Component Segment 2018 - 2022 ($ million)
    • 4.4 Geography Segment Analysis 2018 - 2022
      • Exhibit 21: Historic Market Size – Geography Segment 2018 - 2022 ($ million)
    • 4.5 Country Segment Analysis 2018 - 2022
      • Exhibit 22: Historic Market Size – Country Segment 2018 - 2022 ($ million)

    5 Five Forces Analysis

    • 5.1 Five forces summary
      • Exhibit 23: Five forces analysis - Comparison between 2023 and 2028
    • 5.2 Bargaining power of buyers
      • Exhibit 24: Chart on Bargaining power of buyers – Impact of key factors 2023 and 2028
    • 5.3 Bargaining power of suppliers
      • Exhibit 25: Bargaining power of suppliers – Impact of key factors in 2023 and 2028
    • 5.4 Threat of new entrants
      • Exhibit 26: Threat of new entrants – Impact of key factors in 2023 and 2028
    • 5.5 Threat of substitutes
      • Exhibit 27: Threat of substitutes – Impact of key factors in 2023 and 2028
    • 5.6 Threat of rivalry
      • Exhibit 28: Threat of rivalry – Impact of key factors in 2023 and 2028
    • 5.7 Market condition
      • Exhibit 29: Chart on Market condition - Five forces 2023 and 2028

    6 Market Segmentation by End-user

    • 6.1 Market segments
      • Exhibit 30: Chart on End-user - Market share 2023-2028 (%)
      • Exhibit 31: Data Table on End-user - Market share 2023-2028 (%)
    • 6.2 Comparison by End-user
      • Exhibit 32: Chart on Comparison by End-user
      • Exhibit 33: Data Table on Comparison by End-user
    • 6.3 BFSI - Market size and forecast 2023-2028
      • Exhibit 34: Chart on BFSI - Market size and forecast 2023-2028 ($ million)
      • Exhibit 35: Data Table on BFSI - Market size and forecast 2023-2028 ($ million)
      • Exhibit 36: Chart on BFSI - Year-over-year growth 2023-2028 (%)
      • Exhibit 37: Data Table on BFSI - Year-over-year growth 2023-2028 (%)
    • 6.4 Healthcare - Market size and forecast 2023-2028
      • Exhibit 38: Chart on Healthcare - Market size and forecast 2023-2028 ($ million)
      • Exhibit 39: Data Table on Healthcare - Market size and forecast 2023-2028 ($ million)
      • Exhibit 40: Chart on Healthcare - Year-over-year growth 2023-2028 (%)
      • Exhibit 41: Data Table on Healthcare - Year-over-year growth 2023-2028 (%)
    • 6.5 Retail - Market size and forecast 2023-2028
      • Exhibit 42: Chart on Retail - Market size and forecast 2023-2028 ($ million)
      • Exhibit 43: Data Table on Retail - Market size and forecast 2023-2028 ($ million)
      • Exhibit 44: Chart on Retail - Year-over-year growth 2023-2028 (%)
      • Exhibit 45: Data Table on Retail - Year-over-year growth 2023-2028 (%)
    • 6.6 Education - Market size and forecast 2023-2028
      • Exhibit 46: Chart on Education - Market size and forecast 2023-2028 ($ million)
      • Exhibit 47: Data Table on Education - Market size and forecast 2023-2028 ($ million)
      • Exhibit 48: Chart on Education - Year-over-year growth 2023-2028 (%)
      • Exhibit 49: Data Table on Education - Year-over-year growth 2023-2028 (%)
    • 6.7 Others - Market size and forecast 2023-2028
      • Exhibit 50: Chart on Others - Market size and forecast 2023-2028 ($ million)
      • Exhibit 51: Data Table on Others - Market size and forecast 2023-2028 ($ million)
      • Exhibit 52: Chart on Others - Year-over-year growth 2023-2028 (%)
      • Exhibit 53: Data Table on Others - Year-over-year growth 2023-2028 (%)
    • 6.8 Market opportunity by End-user
      • Exhibit 54: Market opportunity by End-user ($ million)
      • Exhibit 55: Data Table on Market opportunity by End-user ($ million)

    7 Market Segmentation by Component

    • 7.1 Market segments
      • Exhibit 56: Chart on Component - Market share 2023-2028 (%)
      • Exhibit 57: Data Table on Component - Market share 2023-2028 (%)
    • 7.2 Comparison by Component
      • Exhibit 58: Chart on Comparison by Component
      • Exhibit 59: Data Table on Comparison by Component
    • 7.3 Physical network infrastructure - Market size and forecast 2023-2028
      • Exhibit 60: Chart on Physical network infrastructure - Market size and forecast 2023-2028 ($ million)
      • Exhibit 61: Data Table on Physical network infrastructure - Market size and forecast 2023-2028 ($ million)
      • Exhibit 62: Chart on Physical network infrastructure - Year-over-year growth 2023-2028 (%)
      • Exhibit 63: Data Table on Physical network infrastructure - Year-over-year growth 2023-2028 (%)
    • 7.4 SDN applications - Market size and forecast 2023-2028
      • Exhibit 64: Chart on SDN applications - Market size and forecast 2023-2028 ($ million)
      • Exhibit 65: Data Table on SDN applications - Market size and forecast 2023-2028 ($ million)
      • Exhibit 66: Chart on SDN applications - Year-over-year growth 2023-2028 (%)
      • Exhibit 67: Data Table on SDN applications - Year-over-year growth 2023-2028 (%)
    • 7.5 Controller software - Market size and forecast 2023-2028
      • Exhibit 68: Chart on Controller software - Market size and forecast 2023-2028 ($ million)
      • Exhibit 69: Data Table on Controller software - Market size and forecast 2023-2028 ($ million)
      • Exhibit 70: Chart on Controller software - Year-over-year growth 2023-2028 (%)
      • Exhibit 71: Data Table on Controller software - Year-over-year growth 2023-2028 (%)
    • 7.6 Market opportunity by Component
      • Exhibit 72: Market opportunity by Component ($ million)
      • Exhibit 73: Data Table on Market opportunity by Component ($ million)

    8 Customer Landscape

    • 8.1 Customer landscape overview
      • Exhibit 74: Analysis of price sensitivity, lifecycle, customer purchase basket, adoption rates, and purchase criteria

    9 Geographic Landscape

    • 9.1 Geographic segmentation
      • Exhibit 75: Chart on Market share by geography 2023-2028 (%)
      • Exhibit 76: Data Table on Market share by geography 2023-2028 (%)
    • 9.2 Geographic comparison
      • Exhibit 77: Chart on Geographic comparison
      • Exhibit 78: Data Table on Geographic comparison
    • 9.3 North America - Market size and forecast 2023-2028
      • Exhibit 79: Chart on North America - Market size and forecast 2023-2028 ($ million)
      • Exhibit 80: Data Table on North America - Market size and forecast 2023-2028 ($ million)
      • Exhibit 81: Chart on North America - Year-over-year growth 2023-2028 (%)
      • Exhibit 82: Data Table on North America - Year-over-year growth 2023-2028 (%)
    • 9.4 APAC - Market size and forecast 2023-2028
      • Exhibit 83: Chart on APAC - Market size and forecast 2023-2028 ($ million)
      • Exhibit 84: Data Table on APAC - Market size and forecast 2023-2028 ($ million)
      • Exhibit 85: Chart on APAC - Year-over-year growth 2023-2028 (%)
      • Exhibit 86: Data Table on APAC - Year-over-year growth 2023-2028 (%)
    • 9.5 Europe - Market size and forecast 2023-2028
      • Exhibit 87: Chart on Europe - Market size and forecast 2023-2028 ($ million)
      • Exhibit 88: Data Table on Europe - Market size and forecast 2023-2028 ($ million)
      • Exhibit 89: Chart on Europe - Year-over-year growth 2023-2028 (%)
      • Exhibit 90: Data Table on Europe - Year-over-year growth 2023-2028 (%)
    • 9.6 South America - Market size and forecast 2023-2028
      • Exhibit 91: Chart on South America - Market size and forecast 2023-2028 ($ million)
      • Exhibit 92: Data Table on South America - Market size and forecast 2023-2028 ($ million)
      • Exhibit 93: Chart on South America - Year-over-year growth 2023-2028 (%)
      • Exhibit 94: Data Table on South America - Year-over-year growth 2023-2028 (%)
    • 9.7 Middle East and Africa - Market size and forecast 2023-2028
      • Exhibit 95: Chart on Middle East and Africa - Market size and forecast 2023-2028 ($ million)
      • Exhibit 96: Data Table on Middle East and Africa - Market size and forecast 2023-2028 ($ million)
      • Exhibit 97: Chart on Middle East and Africa - Year-over-year growth 2023-2028 (%)
      • Exhibit 98: Data Table on Middle East and Africa - Year-over-year growth 2023-2028 (%)
    • 9.8 US - Market size and forecast 2023-2028
      • Exhibit 99: Chart on US - Market size and forecast 2023-2028 ($ million)
      • Exhibit 100: Data Table on US - Market size and forecast 2023-2028 ($ million)
      • Exhibit 101: Chart on US - Year-over-year growth 2023-2028 (%)
      • Exhibit 102: Data Table on US - Year-over-year growth 2023-2028 (%)
    • 9.9 Australia - Market size and forecast 2023-2028
      • Exhibit 103: Chart on Australia - Market size and forecast 2023-2028 ($ million)
      • Exhibit 104: Data Table on Australia - Market size and forecast 2023-2028 ($ million)
      • Exhibit 105: Chart on Australia - Year-over-year growth 2023-2028 (%)
      • Exhibit 106: Data Table on Australia - Year-over-year growth 2023-2028 (%)
    • 9.10 China - Market size and forecast 2023-2028
      • Exhibit 107: Chart on China - Market size and forecast 2023-2028 ($ million)
      • Exhibit 108: Data Table on China - Market size and forecast 2023-2028 ($ million)
      • Exhibit 109: Chart on China - Year-over-year growth 2023-2028 (%)
      • Exhibit 110: Data Table on China - Year-over-year growth 2023-2028 (%)
    • 9.11 Japan - Market size and forecast 2023-2028
      • Exhibit 111: Chart on Japan - Market size and forecast 2023-2028 ($ million)
      • Exhibit 112: Data Table on Japan - Market size and forecast 2023-2028 ($ million)
      • Exhibit 113: Chart on Japan - Year-over-year growth 2023-2028 (%)
      • Exhibit 114: Data Table on Japan - Year-over-year growth 2023-2028 (%)
    • 9.12 UK - Market size and forecast 2023-2028
      • Exhibit 115: Chart on UK - Market size and forecast 2023-2028 ($ million)
      • Exhibit 116: Data Table on UK - Market size and forecast 2023-2028 ($ million)
      • Exhibit 117: Chart on UK - Year-over-year growth 2023-2028 (%)
      • Exhibit 118: Data Table on UK - Year-over-year growth 2023-2028 (%)
    • 9.13 Market opportunity by geography
      • Exhibit 119: Market opportunity by geography ($ million)
      • Exhibit 120: Data Tables on Market opportunity by geography ($ million)

    10 Drivers, Challenges, and Trends

    • 10.1 Market drivers
      • 10.2 Market challenges
        • 10.3 Impact of drivers and challenges
          • Exhibit 121: Impact of drivers and challenges in 2023 and 2028
        • 10.4 Market trends

          11 Vendor Landscape

          • 11.1 Overview
            • 11.2 Vendor landscape
              • Exhibit 122: Overview on Criticality of inputs and Factors of differentiation
            • 11.3 Landscape disruption
              • Exhibit 123: Overview on factors of disruption
            • 11.4 Industry risks
              • Exhibit 124: Impact of key risks on business

            12 Vendor Analysis

            • 12.1 Vendors covered
              • Exhibit 125: Vendors covered
            • 12.2 Market positioning of vendors
              • Exhibit 126: Matrix on vendor position and classification
            • 12.3 Arista Networks Inc.
              • Exhibit 127: Arista Networks Inc. - Overview
              • Exhibit 128: Arista Networks Inc. - Product / Service
              • Exhibit 129: Arista Networks Inc. - Key offerings
            • 12.4 AT and T Inc.
              • Exhibit 130: AT and T Inc. - Overview
              • Exhibit 131: AT and T Inc. - Business segments
              • Exhibit 132: AT and T Inc. - Key news
              • Exhibit 133: AT and T Inc. - Key offerings
              • Exhibit 134: AT and T Inc. - Segment focus
            • 12.5 Broadcom Inc.
              • Exhibit 135: Broadcom Inc. - Overview
              • Exhibit 136: Broadcom Inc. - Business segments
              • Exhibit 137: Broadcom Inc. - Key news
              • Exhibit 138: Broadcom Inc. - Key offerings
              • Exhibit 139: Broadcom Inc. - Segment focus
            • 12.6 Ciena Corp.
              • Exhibit 140: Ciena Corp. - Overview
              • Exhibit 141: Ciena Corp. - Business segments
              • Exhibit 142: Ciena Corp. - Key offerings
              • Exhibit 143: Ciena Corp. - Segment focus
            • 12.7 Cisco Systems Inc.
              • Exhibit 144: Cisco Systems Inc. - Overview
              • Exhibit 145: Cisco Systems Inc. - Business segments
              • Exhibit 146: Cisco Systems Inc. - Key news
              • Exhibit 147: Cisco Systems Inc. - Key offerings
              • Exhibit 148: Cisco Systems Inc. - Segment focus
            • 12.8 Dell Technologies Inc.
              • Exhibit 149: Dell Technologies Inc. - Overview
              • Exhibit 150: Dell Technologies Inc. - Business segments
              • Exhibit 151: Dell Technologies Inc. - Key news
              • Exhibit 152: Dell Technologies Inc. - Key offerings
              • Exhibit 153: Dell Technologies Inc. - Segment focus
            • 12.9 Extreme Networks Inc.
              • Exhibit 154: Extreme Networks Inc. - Overview
              • Exhibit 155: Extreme Networks Inc. - Product / Service
              • Exhibit 156: Extreme Networks Inc. - Key offerings
            • 12.10 Hamburgnet eK
              • Exhibit 157: Hamburgnet eK - Overview
              • Exhibit 158: Hamburgnet eK - Product / Service
              • Exhibit 159: Hamburgnet eK - Key offerings
            • 12.11 Hewlett Packard Enterprise Co.
              • Exhibit 160: Hewlett Packard Enterprise Co. - Overview
              • Exhibit 161: Hewlett Packard Enterprise Co. - Business segments
              • Exhibit 162: Hewlett Packard Enterprise Co. - Key news
              • Exhibit 163: Hewlett Packard Enterprise Co. - Key offerings
              • Exhibit 164: Hewlett Packard Enterprise Co. - Segment focus
            • 12.12 Huawei Technologies Co. Ltd.
              • Exhibit 165: Huawei Technologies Co. Ltd. - Overview
              • Exhibit 166: Huawei Technologies Co. Ltd. - Business segments
              • Exhibit 167: Huawei Technologies Co. Ltd. - Key news
              • Exhibit 168: Huawei Technologies Co. Ltd. - Key offerings
              • Exhibit 169: Huawei Technologies Co. Ltd. - Segment focus
            • 12.13 International Business Machines Corp.
              • Exhibit 170: International Business Machines Corp. - Overview
              • Exhibit 171: International Business Machines Corp. - Business segments
              • Exhibit 172: International Business Machines Corp. - Key news
              • Exhibit 173: International Business Machines Corp. - Key offerings
              • Exhibit 174: International Business Machines Corp. - Segment focus
            • 12.14 Juniper Networks Inc.
              • Exhibit 175: Juniper Networks Inc. - Overview
              • Exhibit 176: Juniper Networks Inc. - Product / Service
              • Exhibit 177: Juniper Networks Inc. - Key offerings
            • 12.15 Nokia Corp.
              • Exhibit 178: Nokia Corp. - Overview
              • Exhibit 179: Nokia Corp. - Business segments
              • Exhibit 180: Nokia Corp. - Key offerings
              • Exhibit 181: Nokia Corp. - Segment focus
            • 12.16 Oracle Corp.
              • Exhibit 182: Oracle Corp. - Overview
              • Exhibit 183: Oracle Corp. - Business segments
              • Exhibit 184: Oracle Corp. - Key news
              • Exhibit 185: Oracle Corp. - Key offerings
              • Exhibit 186: Oracle Corp. - Segment focus
            • 12.17 Wipro Ltd.
              • Exhibit 187: Wipro Ltd. - Overview
              • Exhibit 188: Wipro Ltd. - Business segments
              • Exhibit 189: Wipro Ltd. - Key news
              • Exhibit 190: Wipro Ltd. - Key offerings
              • Exhibit 191: Wipro Ltd. - Segment focus

            13 Appendix

            • 13.1 Scope of the report
              • 13.2 Inclusions and exclusions checklist
                • Exhibit 192: Inclusions checklist
                • Exhibit 193: Exclusions checklist
              • 13.3 Currency conversion rates for US$
                • Exhibit 194: Currency conversion rates for US$
              • 13.4 Research methodology
                • Exhibit 195: Research methodology
                • Exhibit 196: Validation techniques employed for market sizing
                • Exhibit 197: Information sources
              • 13.5 List of abbreviations
                • Exhibit 198: List of abbreviations

              Research Methodology

              Technavio presents a detailed picture of the market by way of study, synthesis, and summation of data from multiple sources. The analysts have presented the various facets of the market with a particular focus on identifying the key industry influencers. The data thus presented is comprehensive, reliable, and the result of extensive research, both primary and secondary.

              INFORMATION SOURCES

              Primary sources

              • Manufacturers and suppliers
              • Channel partners
              • Industry experts
              • Strategic decision makers

              Secondary sources

              • Industry journals and periodicals
              • Government data
              • Financial reports of key industry players
              • Historical data
              • Press releases

              DATA ANALYSIS

              Data Synthesis

              • Collation of data
              • Estimation of key figures
              • Analysis of derived insights

              Data Validation

              • Triangulation with data models
              • Reference against proprietary databases
              • Corroboration with industry experts

              REPORT WRITING

              Qualitative

              • Market drivers
              • Market challenges
              • Market trends
              • Five forces analysis

              Quantitative

              • Market size and forecast
              • Market segmentation
              • Geographical insights
              • Competitive landscape

              Interested in this report?

              Get your sample now to see our research methodology and insights!

              Download Now

              Frequently Asked Questions

              Software-Defined Networking (SDN) market growth will increase by $ 67378.74 mn during 2024-2028.

              The Software-Defined Networking (SDN) market is expected to grow at a CAGR of 29.04% during 2024-2028.

              Software-Defined Networking (SDN) market is segmented by End-user( BFSI, Healthcare, Retail, Education, Others) Component( Physical network infrastructure, SDN applications, Controller software, South America, MEA)

              Arista Networks Inc., AT and T Inc., Broadcom Inc., Ciena Corp., Cisco Systems Inc., Dell Technologies Inc., Extreme Networks Inc., Hamburgnet eK, Hewlett Packard Enterprise Co., Huawei Technologies Co. Ltd., International Business Machines Corp., Juniper Networks Inc., Kyndryl Inc., Nokia Corp., NVIDIA Corp., Oracle Corp., Schweitzer Engineering Laboratories Inc., Telefonaktiebolaget LM Ericsson, VMware Inc., Wipro Ltd. are a few of the key vendors in the Software-Defined Networking (SDN) market.

              North America will register the highest growth rate of 38% among the other regions. Therefore, the Software-Defined Networking (SDN) market in North America is expected to garner significant business opportunities for the vendors during the forecast period.

              US, Australia, China, Japan, UK

              • High demand for cloud solutions adoption by enterprisesThe global SDN market is increasingly driven by enterprises willingness to adopt cloud solutions because of benefits such as low operational expenditure and scale-up or scale-down workload facilities. In the past couple of years is the driving factor this market.
              • there has been a surge in demand for hybrid cloud solutions and multi-cloud environments from enterprises. Hybrid cloud solutions enable enterprises to leverage the benefits of both private and public clouds to scale up or scale down the resources depending on business requirements. On the other hand is the driving factor this market.
              • multi-cloud solutions enable enterprises to overcome vendor lock-in problems. Cloud data centers have been growing rapidly over the past few years to meet the rising demand from enterprises. Public cloud is the driving factor this market.
              • private cloud is the driving factor this market.
              • hybrid cloud is the driving factor this market.
              • and multi-cloud solutions have been replacing traditional on-premise data centers owing to a variety of factors is the driving factor this market.
              • such as better computation power and costs. Subsequently is the driving factor this market.
              • enterprises are now in need of better infrastructure to handle the augmenting network traffic and address the growing demand for bandwidth requirements. To meet this challenge is the driving factor this market.
              • enterprises are pioneering toward implementing SDN as a potential solution. SDN plays a crucial role in efficiently utilizing the network infrastructure by maintaining the centralized control and management of programmable network infrastructure and ensuring load balance. Vendors in the SDN market are working on cloud SDN solutions to cater to the demand from enterprises. For instance is the driving factor this market.
              • Cloud SDN from Telefonaktiebolaget LM Ericsson offers seamless inter-and intra-data center connectivity for physical is the driving factor this market.
              • virtual is the driving factor this market.
              • and container-based workloads. This solution combines the OpenDaylight controller with advanced routing capabilities. Therefore is the driving factor this market.
              • with the surge in cloud adoption is the driving factor this market.
              • the necessity for the augmented efficiency of network infrastructure is imperative. Thus is the driving factor this market.
              • SDN solutions that can offer enhanced utilization of network infrastructure will continue to witness significant demand is the driving factor this market.
              • which in turn will drive the global SDN market during the forecast period. is the driving factor this market.

              The Software-Defined Networking (SDN) market vendors should focus on grabbing business opportunities from the BFSI segment as it accounted for the largest market share in the base year.