
Soil Treatment Market Size 2025-2029
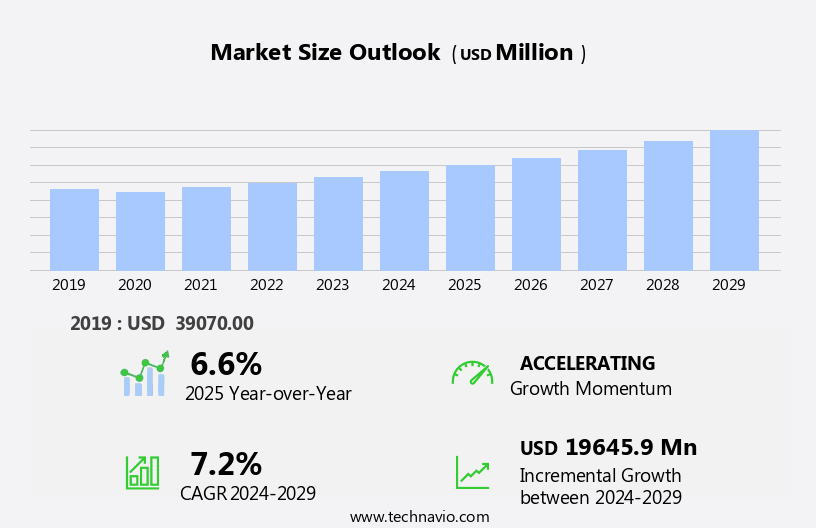
The soil treatment market size is forecast to increase by USD 19.65 billion, at a CAGR of 7.2% between 2024 and 2029.
- The market is driven by the rising demand for crops and the growing adoption of precision agriculture, which emphasizes optimizing agricultural production through targeted application of inputs, including soil treatments. This approach enhances crop yield and quality while reducing the use of resources and environmental impact. However, the market faces a significant challenge in the form of a lack of awareness regarding soil conservation. This challenge can hinder market growth as farmers may not fully understand the long-term benefits of investing in soil treatments, focusing instead on immediate crop production needs.
- To capitalize on market opportunities, companies should focus on raising awareness about the importance of soil health and the long-term benefits of soil treatments. Additionally, innovation in precision agriculture technology and development of eco-friendly soil treatments can provide competitive advantages. Companies must navigate these challenges and seize opportunities to establish a strong presence in the evolving the market.
What will be the Size of the Soil Treatment Market during the forecast period?
Explore in-depth regional segment analysis with market size data - historical 2019-2023 and forecasts 2025-2029 - in the full report.
Request Free Sample
The market continues to evolve, driven by the ongoing need to enhance soil health and productivity across various sectors. Soil treatment solutions encompass a wide range of applications, from water conservation and ph adjustment to humic acids, chemical amendments, and soil structure improvement. These interventions aim to optimize nutrient management, promote soil organic matter accumulation, and mitigate soil salinity. Moreover, the integration of advanced technologies, such as precision agriculture and soil bioremediation, offers innovative approaches to soil amendments and phosphorous availability enhancement. Soil enzymes and microbial biomass play a crucial role in soil health assessment and sustainable soil management practices, including crop rotation, drainage systems, and soil nutrient analysis.
The adoption of regenerative agriculture, conservation tillage, and no-till farming further emphasizes the importance of soil carbon sequestration and soil microbial activity. Soil sampling and fertility management remain essential components of effective soil treatment strategies, while soil moisture monitoring and irrigation management ensure optimal crop growth. The dynamic nature of the market reflects the continuous unfolding of market activities and evolving patterns. As the demand for sustainable and efficient agricultural practices grows, the market is expected to witness significant advancements in soil treatment technologies and applications.
How is this Soil Treatment Industry segmented?
The soil treatment industry research report provides comprehensive data (region-wise segment analysis), with forecasts and estimates in "USD million" for the period 2025-2029, as well as historical data from 2019-2023 for the following segments.
- Type
- Organic amendments
- pH adjusters
- Soil protection
- Technology
- Physiochemical treatment
- Biological treatment
- Thermal treatment
- Geography
- North America
- US
- Canada
- Europe
- Germany
- Spain
- UK
- APAC
- China
- India
- Japan
- South America
- Argentina
- Brazil
- Rest of World (ROW)
- North America
.
By Type Insights
The organic amendments segment is estimated to witness significant growth during the forecast period.
Organic amendments play a crucial role in soil treatment practices for agriculture and horticulture. These amendments, derived from organic materials, enhance the soil's physical properties, nutrient content, and overall health. Compost, animal manure, crop residues, and biochar are among the organic materials rich in organic matter and nutrients. When integrated into the soil, these amendments gradually release essential nutrients for plant growth. Moreover, they improve the soil's cation exchange capacity, allowing it to retain and distribute nutrients more efficiently. Beyond fertility enhancement, organic amendments contribute to soil structure improvement. They promote soil aggregation, which aids in water retention and reduces soil erosion.
Furthermore, they encourage soil microbial activity, leading to improved soil health assessment. Precision agriculture and regenerative agriculture practices employ organic amendments to optimize nutrient management and promote sustainable soil management. Organic amendments also address specific soil concerns. For instance, they help manage soil salinity by improving water conservation and reducing leaching of soluble salts. Additionally, they aid in soil ph adjustment and nitrogen fixation, ensuring optimal growing conditions for various crops. Soil testing, soil nutrient analysis, and precision soil management are essential tools in determining the appropriate organic amendments for specific soil conditions. Organic farming practices, including crop rotation and cover cropping, further enhance the benefits of organic amendments.
Integrated pest management and soil microorganisms also play a role in the effectiveness of organic amendments. Fulvic and humic acids, naturally occurring organic compounds, facilitate nutrient uptake and improve soil structure. Chemical amendments, while not organic, can be used in conjunction with organic amendments to address specific soil challenges, such as soil compaction reduction and soil carbon sequestration. In conclusion, organic amendments are a vital component of soil treatment practices, contributing to improved soil fertility, structure, and overall health. Their integration into modern agricultural and horticultural practices, such as precision agriculture and regenerative agriculture, ensures sustainable and effective soil management.
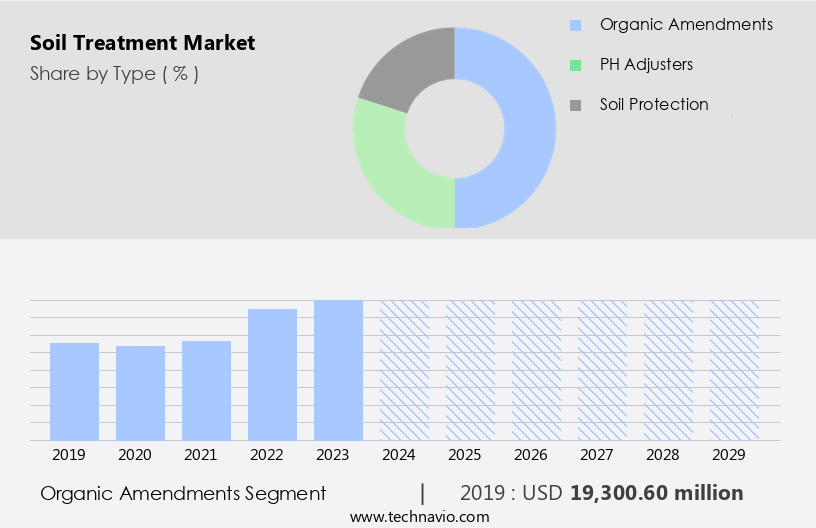
The Organic amendments segment was valued at USD 19.3 billion in 2019 and showed a gradual increase during the forecast period.
Regional Analysis
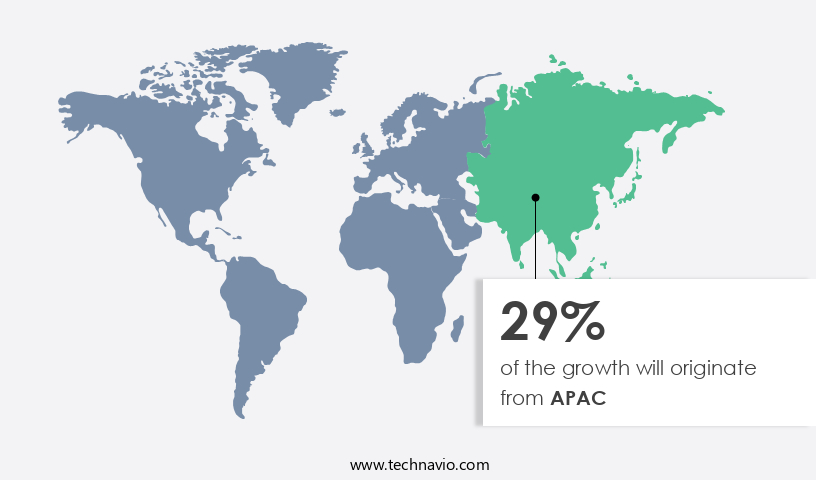
APAC is estimated to contribute 29% to the growth of the global market during the forecast period.Technavio's analysts have elaborately explained the regional trends and drivers that shape the market during the forecast period.
The North American the market is experiencing significant growth due to the region's vast agricultural sector and heightened focus on soil health and sustainability. Comprising the US, Canada, and Mexico, each country brings unique agricultural practices, soil types, and market trends. Factors driving this market include the demand for enhanced soil fertility, increasing preference for organic produce, and the integration of advanced agricultural techniques. With a decreasing percentage of arable land, the need for soil treatment to boost crop yields is increasingly important. For instance, the USDA reported that in 2024, the United States had 1.88 million farms, a decrease of 14,950 from 2023, with a total of 876.46 million acres in farms.
Soil treatment solutions encompass various approaches, including nutrient management, soil structure improvement, soil organic matter enhancement, and soil salinity management. Soil remediation technologies, soil amendments, and soil bioremediation are also gaining traction. Precision agriculture, crop rotation, drainage systems, and soil nutrient analysis are essential components of modern farming practices, driving the demand for soil treatment solutions. Sustainable soil management practices, such as no-till farming, water conservation, and soil carbon sequestration, are increasingly popular. Soil testing, soil fertility management, and soil microbial activity monitoring are crucial for maintaining optimal soil health. Organic farming, nitrogen fixation, and integrated pest management are other approaches that rely on soil treatment for success.
Soil conditioners, such as humic and fulvic acids, play a vital role in improving soil structure and enhancing nutrient availability. Phosphorous availability, soil enzymes, and soil moisture monitoring are essential aspects of soil treatment, ensuring optimal growing conditions for crops. Chemical amendments and conservation tillage are alternative methods used for soil treatment, offering benefits such as reduced soil compaction and improved soil health assessment. In conclusion, the North American the market is thriving due to the region's agricultural sector expansion, environmental concerns, and the adoption of advanced farming practices. The market is expected to continue growing, as farmers and agricultural organizations recognize the importance of maintaining healthy, productive soils.
Market Dynamics
Our researchers analyzed the data with 2024 as the base year, along with the key drivers, trends, and challenges. A holistic analysis of drivers will help companies refine their marketing strategies to gain a competitive advantage.
What are the key market drivers leading to the rise in the adoption of Soil Treatment Industry?
- Meeting the rising demand for crops is the primary market driver. This necessitates the continuous growth and development of the agricultural industry to ensure the production of sufficient quantities of crops to satisfy consumer needs.
- The market is driven by the growing demand for food products due to the increasing global population. With an estimated population of 7.9 billion in 2022, the need for sustainable and efficient crop production methods is more critical than ever. Soil conditioners, such as soil bioremediation and soil enzymes, play a crucial role in enhancing soil health and fertility, thereby improving crop yield and productivity. Modern agriculture practices, including precision soil management, soil nutrient analysis, and drainage systems, are essential for optimizing crop production. Organic farming techniques, such as crop rotation, are also gaining popularity due to their environmental benefits and long-term sustainability.
- Phosphorous availability is a significant concern for farmers, and soil treatment solutions that enhance phosphorus uptake and utilization are in high demand. The use of sustainable soil management practices, including the adoption of soil treatment technologies, can help address this challenge while reducing the environmental impact of agricultural practices. In conclusion, the market is expected to grow significantly due to the increasing demand for food products and the need for sustainable and efficient agricultural practices. The use of soil conditioners, precision farming techniques, and organic farming methods are key trends driving the market's growth. By investing in these solutions, farmers can improve soil health, increase crop yields, and reduce their environmental footprint.
What are the market trends shaping the Soil Treatment Industry?
- Precision agriculture, characterized by the growing adoption of advanced technologies for soil treatment, is currently a significant market trend. This approach enables farmers to optimize resource usage and improve crop yields through data-driven decision-making.
- The market is witnessing significant growth due to the adoption of precision agriculture, a trend that utilizes advanced technologies and data-driven approaches to optimize agricultural practices. Soil treatment is a crucial aspect of precision agriculture, allowing farmers to make informed decisions and enhance efficiency and productivity. One of the key elements in precision agriculture for soil treatment is the implementation of soil sensors and monitoring systems. These sensors collect real-time data on soil conditions, such as moisture levels, temperature, nutrient content, and pH. Farmers can access this detailed information through a central system, enabling them to assess the health of their soil and address any deficiencies effectively.
- Another essential aspect of soil treatment is the application of organic amendments, including fulvic acids, to improve soil health. Organic amendments enhance soil structure, increase water retention, and promote nitrogen fixation, benefiting both the soil and the crops. Additionally, practices like cover cropping, soil testing, and integrated pest management contribute to the overall health assessment of the soil. Soil compaction reduction and the preservation of soil microorganisms are also critical considerations in soil treatment. Overall, precision agriculture and its related technologies are transforming the market, providing farmers with valuable insights and tools to optimize their agricultural practices.
What challenges does the Soil Treatment Industry face during its growth?
- The lack of awareness and implementation of soil conservation practices poses a significant challenge to the growth and sustainability of the industry.
- Soil treatment solutions play a crucial role in sustainable agriculture, particularly in addressing the challenges of water conservation, soil ph adjustment, fertilizer and soil fertility management. These practices enhance soil carbon sequestration, soil microbial activity, and soil moisture retention. However, in regions with low literacy rates and limited awareness among farmers, the adoption of soil treatment techniques remains a challenge. Skilled labor and the high cost of chemical amendments, such as humic acids and other additives, further hinder the market's growth. Despite these challenges, the importance of soil treatment in improving crop yield and overall agricultural productivity cannot be overlooked. The integration of soil sampling, soil moisture monitoring, and conservation tillage practices into farming operations can lead to significant improvements in soil health and long-term sustainability.
- As the global focus shifts towards sustainable agriculture, the market for soil treatment solutions is expected to grow, offering opportunities for innovation and collaboration in the agricultural sector.
Exclusive Customer Landscape
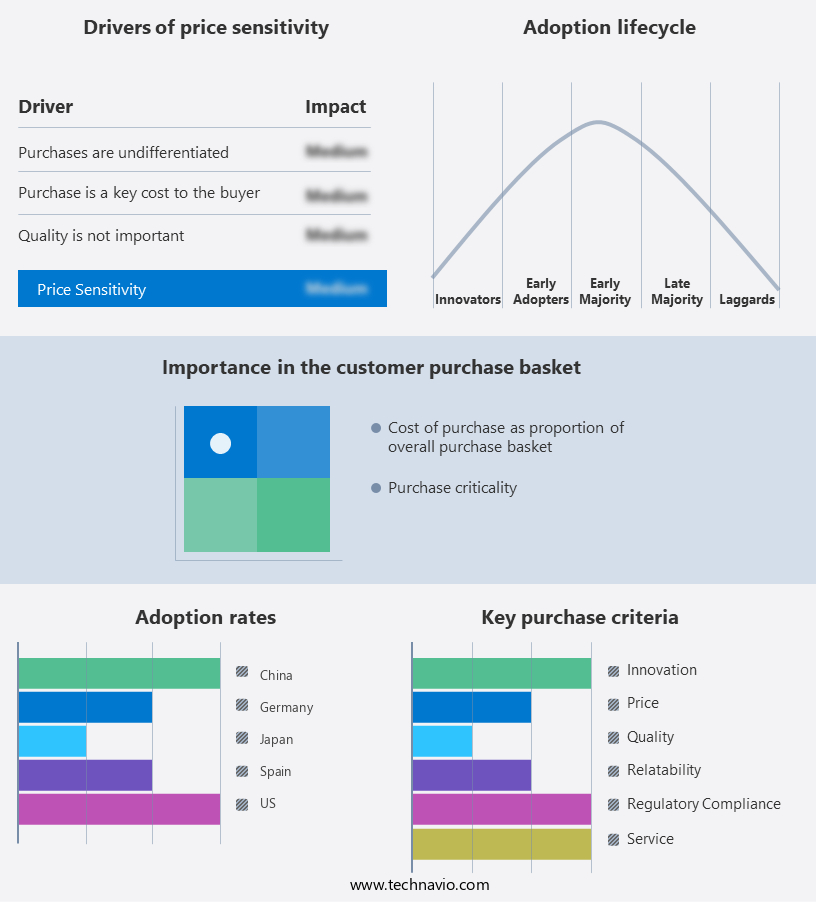
The soil treatment market forecasting report includes the adoption lifecycle of the market, covering from the innovator's stage to the laggard's stage. It focuses on adoption rates in different regions based on penetration. Furthermore, the soil treatment market report also includes key purchase criteria and drivers of price sensitivity to help companies evaluate and develop their market growth analysis strategies.
Customer Landscape
Key Companies & Market Insights
Companies are implementing various strategies, such as strategic alliances, soil treatment market forecast, partnerships, mergers and acquisitions, geographical expansion, and product/service launches, to enhance their presence in the industry.
AGRO-KANESHO CO. LTD. - The company specializes in innovative soil treatment solutions, delivering advanced technologies to enhance agricultural productivity. Two of our notable offerings include Basamid and DD90.
The industry research and growth report includes detailed analyses of the competitive landscape of the market and information about key companies, including:
- AGRO-KANESHO CO. LTD.
- American Vanguard Corp.
- Arkema
- BASF SE
- Bayer AG
- Beneficial Reuse Management
- China National Chemical Corp.
- Compagnie de Saint-Gobain SA
- Corteva Inc.
- Gowan Co.
- HERA HOLDING
- Novorem Pty Ltd.
- RAG Stiftung
- SA LIME AND GYPSUM PTY LTD.
- Soil Works LLC
- Solvay SA
- Swaroop Agrochemical Industries
- Tata Sons Pvt. Ltd.
- TerraCottem Intl. SL
- UPL Ltd.
Qualitative and quantitative analysis of companies has been conducted to help clients understand the wider business environment as well as the strengths and weaknesses of key industry players. Data is qualitatively analyzed to categorize companies as pure play, category-focused, industry-focused, and diversified; it is quantitatively analyzed to categorize companies as dominant, leading, strong, tentative, and weak.
Recent Development and News in Soil Treatment Market
- In February 2024, BASF SE, a leading chemical producer, introduced a new soil treatment product named "RhymeGreen TM," which is a bio-based and sustainable solution designed to improve soil structure and water retention. This innovation marks a significant step forward in the market, as the demand for eco-friendly and efficient agricultural practices continues to rise (BASF SE Press Release, 2024).
- In May 2024, Corteva Agriscience, the agricultural division of DowDuPont, announced a strategic partnership with Bio-Techne Corporation to develop and commercialize advanced soil health solutions. This collaboration combines Corteva's agricultural expertise with Bio-Techne's biotechnology capabilities, aiming to create innovative soil treatment products and services (Corteva Agriscience Press Release, 2024).
- In October 2024, Koppert Biological Systems, a global leader in the production of beneficial insects, secured a â¬100 million investment from the European Investment Bank to expand its production capacity and develop new soil treatment technologies. This funding will enable Koppert to meet the growing demand for sustainable agricultural practices and contribute to the European Green Deal initiative (European Investment Bank Press Release, 2024).
- In March 2025, the European Commission approved the use of bio-stimulants in organic farming, marking a major regulatory milestone for the market. This decision allows farmers to use bio-stimulants, which enhance soil fertility and crop productivity, in organic farming, providing them with more options to maintain healthy and productive soils while adhering to organic farming standards (European Commission Press Release, 2025).
Research Analyst Overview
- The market is experiencing significant activity and trends as the importance of maintaining healthy soils becomes increasingly recognized. Climate change impacts, such as soil leaching and erosion, are driving the need for innovative solutions to mitigate these effects. Soil permeability and texture are key factors in managing water infiltration and runoff, while remote sensing and GIS mapping enable accurate assessment of soil conditions. Ecological restoration and urban agriculture are gaining traction as strategies for improving soil health and food security. Soil contamination from heavy metals, pesticide residues, and other pollutants poses a major challenge, necessitating advanced technologies like biotechnology applications and precision soil testing.
- Land use change, soil salinization, and compaction are also significant issues, contributing to soil degradation and decreased soil porosity. Data analytics and green infrastructure are essential tools for addressing these challenges, enabling the optimization of soil management practices and reducing greenhouse gas emissions. Soil acidification and carbon loss further complicate soil health, highlighting the need for comprehensive approaches to soil treatment and management. Biodiversity loss and soil infiltration rate are additional concerns, emphasizing the importance of sustainable practices and the role of soil in overall ecosystem health.
Dive into Technavio's robust research methodology, blending expert interviews, extensive data synthesis, and validated models for unparalleled Soil Treatment Market insights. See full methodology.
|
Market Scope |
|
|
Report Coverage |
Details |
|
Page number |
252 |
|
Base year |
2024 |
|
Historic period |
2019-2023 |
|
Forecast period |
2025-2029 |
|
Growth momentum & CAGR |
Accelerate at a CAGR of 7.2% |
|
Market growth 2025-2029 |
USD 19645.9 million |
|
Market structure |
Fragmented |
|
YoY growth 2024-2025(%) |
6.6 |
|
Key countries |
US, China, Spain, Germany, Japan, UK, Canada, Brazil, India, and Argentina |
|
Competitive landscape |
Leading Companies, Market Positioning of Companies, Competitive Strategies, and Industry Risks |
What are the Key Data Covered in this Soil Treatment Market Research and Growth Report?
- CAGR of the Soil Treatment industry during the forecast period
- Detailed information on factors that will drive the growth and forecasting between 2025 and 2029
- Precise estimation of the size of the market and its contribution of the industry in focus to the parent market
- Accurate predictions about upcoming growth and trends and changes in consumer behaviour
- Growth of the market across North America, Europe, APAC, South America, and Middle East and Africa
- Thorough analysis of the market's competitive landscape and detailed information about companies
- Comprehensive analysis of factors that will challenge the soil treatment market growth of industry companies
We can help! Our analysts can customize this soil treatment market research report to meet your requirements.
 RIA -
RIA - 
