Sparkling Juices Market Analysis Europe, North America, APAC, South America, Middle East and Africa - US, Germany, China, India, UK - Size and Forecast 2024-2028

Sparkling Juices Market Analysis Europe, North America, APAC, South America, Middle East and Africa - US, Germany, China, India, UK - Size and Forecast 2024-2028

Published: Jul 2024 182 Pages SKU: IRTNTR75024

Market Overview at a Glance

$1.05 B
Market Opportunity
10.87%
CAGR
9.53
YoY growth 2023-2024(%)

Sparkling Juices Market Size 2024-2028

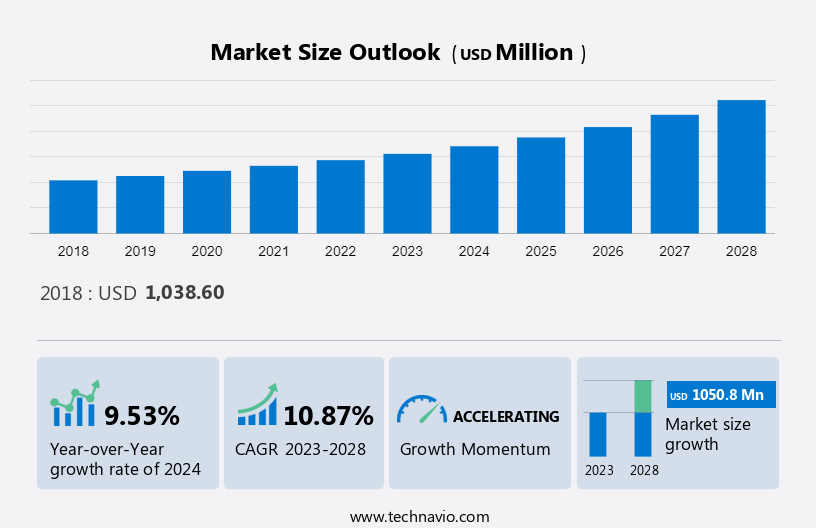
The sparkling juices market size is estimated to grow by USD 1.05 billion at a CAGR of 10.87% between 2023 and 2028. Cold-pressed sparkling juice is a modern beverage innovation that offers several advantages over traditional juices. Firstly, the cold-pressing process preserves the natural nutrients and enzymes of fruits and vegetables by avoiding the use of high temperatures and excessive processing. In contrast, traditional juicing methods can lead to nutrient loss and oxidation. Secondly, cold-pressed sparkling juice provides an added fizz due to the infusion of carbon dioxide, making it a refreshing alternative to still juices. With increasing urbanization and changing consumer lifestyles, there is a growing demand for convenient, healthy, and tasty beverage options. In response, the market has seen an influx of new cold-pressed sparkling juice brands, catering to this trend. These beverages provide the benefits of cold-pressed juice with the added excitement of carbonation, making them a popular choice among health-conscious consumers.

What will be the size of the Market During the Forecast Period?

Sparkling Juices Market Size

To learn more about this report, Download Report Sample

Market Segmentation

The market research report provides comprehensive data (region-wise segment analysis), with forecasts and estimates in "USD billion " for the period 2024-2028, as well as historical data from 2018-2022 for the following segments.
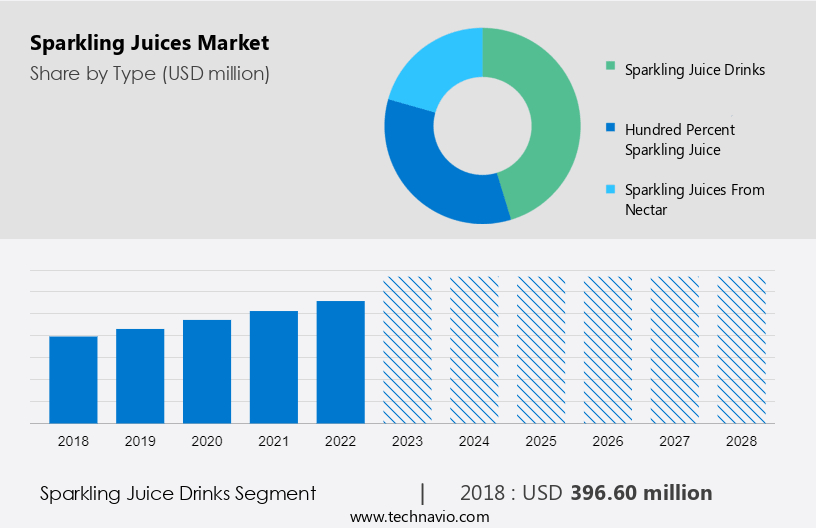
  • Type Outlook 
    • Sparkling juice drinks
    • Hundred percent sparkling juice
    • Sparkling juices from nectar
  • Distribution Channel Outlook 
    • Supermarkets and hypermarkets
    • On-trade
    • Independent retailers
    • Convenience stores
    • Others
  • Region Outlook 
    • North America
      • The U.S.
      • Canada
    • Europe
      • U.K.
      • Germany
      • France
      • Rest of Europe
    • APAC
      • China
      • India
    • Middle East & Africa
      • Saudi Arabia
      • South Africa
      • Rest of the Middle East & Africa
    • South America
      • Chile
      • Brazil
      • Argentina

By Type

The market share growth by the sparkling juice drinks segment will be significant during the forecast period. The market for sparkling juice drinks is one of the most developed businesses worldwide. Sparkling juice drinks have carbon dioxide dissolved in water. Some examples of sparkling juice drinks include May Pineapple Sparkling Juice, Fresa Fresher Sparkling Mojito Juice, and May Peach Sparkling Juice.

Sparkling Juices Market Size

Get a glance at the market contribution of various segments Request a PDF Sample

The sparkling juice drinks segment was valued at USD 396.60 million in 2018The sparkling juice drinks sector has witnessed significant changes in terms of product innovations and services during the past several years. Companies are introducing new varieties of sparkling juice drinks while keeping consumers' health and wellness concerns in mind in order to meet expanding market difficulties. For instance, The Coca-Cola Co., in an effort to attract new consumers to the packaged sparkling juice market and strengthen its product range, introduced Minute Maid Apple Sparkle, an apple juice-based sparkling beverage containing 25% apple juice. Moreover, long-term growth is anticipated for the global market as a result of increased product advertising, a preference for portable, on-the-go meals, and busy lifestyles. Thus, owing to such factors the segment is expected to grow during the forecast period.

By Region

Sparkling Juices Market Share by Geography

For more insights on the market share of various regions Request PDF Sample now!

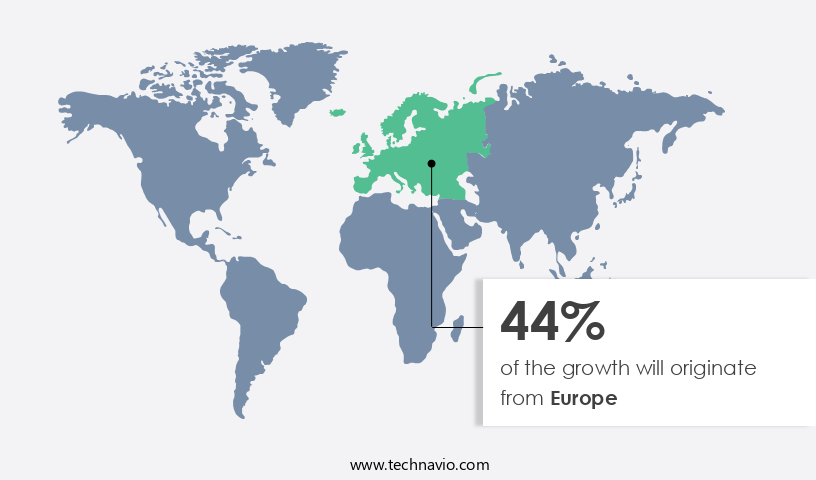
Europe is estimated to contribute 44% to the growth of the global market during the forecast period. Technavio's analysts have elaborately explained the regional trends and drivers that shape the market during the forecast period.

Owing to the rising health concerns connected with the high sugar content of many juices, the market for sparkling juice in Europe is anticipated to expand at a moderate rate over the forecast period.  In Europe, customers prefer to pair their breakfast and snacks with sparkling juices and smoothies rather than junk food. In addition, vendors are concentrating on supplying novel goods, such as cold-pressed and high-pressure processed sparkling juices that are priced higher than conventional juices, which will boost their profit margin during the forecast period. To cater to the needs of health-conscious consumers, vendors are also developing low-calorie and sugar-free products. Thus, the mentioned factors are projected to drive the expansion of the European market over the forecast period.

Market Dynamics and Customer Landscape

Sparkling juices, also known as sparkling juice beverages, have been gaining popularity in the non-alcoholic beverage and alcoholic-infused sparkling market due to their unique blend of fruit juice, carbonated water and sparkling water. These refreshing beverages come in various natural flavors and are widely consumed in both developed and emerging economies. The packaging of sparkling juices is an essential factor that influences consumer preference, with trends leaning towards eco-friendly and sustainable options. Various factors, including product approvals, geographic expansions, and technological innovations drive the development of this market. Advertisements and partnerships with distributors and suppliers play a significant role in expanding the reach of these beverages. The supply chain for sparkling juices involves the sourcing of fresh fruit juice, carbonated water, and artificial sweeteners. The use of natural flavors and reduced added sugars is a trend that is expected to continue in the coming years, making the market for sparkling juice beverages an exciting and dynamic one. Leveraging social media platforms and digital marketing, companies are enhancing brand awareness and consumer engagement by promoting products enriched with functional ingredients like vitamins, minerals, probiotics, and adaptogens that offer energy, gut health, and stress relief. These products highlight their wellness benefits and unique food flavors, appealing to consumers seeking health benefits and innovative solutions for their personal wellness. Our researchers analyzed the data with 2023 as the base year, along with the key drivers, trends, and challenges. A holistic analysis of drivers will help companies refine their marketing strategies to gain a competitive advantage.

Key Market Driver

Increasing urbanization and changing consumer lifestyles are notably driving the market growth. The expansion in the urban population, the rising need for on-the-go meals, and the rising purchasing power parity of the people in emerging nations are some of the major growth drivers for the market. A significant shift in the lifestyle and dietary preferences of consumers over the past two decades has also contributed to global market expansion.

The working population looks out for healthful on-the-go/convenience beverages like sparkling juices. Nibbling between meals has also become increasingly popular globally. Owing to the shifting preferences of the working-class customer sector, the demand for on-the-go foods and beverages at local fast-food chains and smoothie shops has increased dramatically in major urban areas. Therefore, all these factors will drive the demand for the global sparkling juices market during the forecast period.

Significant Market Trends

The increasing prominence of private-label brands is an emerging trend in the market. Different shops are offering various types of sparkling juices under their private-label brands to boost their profitability, so contributing to the expansion of the global market for sparkling juices. Internationally, prominent retailers are creating their own brands of sparkling juices, such as organic sparkling fruit juices and functional sparkling juices, as well as 100% sparkling juices and sparkling juices made from nectar, to capitalize on the growing customer demand for sparkling drinks.

Furthermore, private-label goods are priced less than brand-name goods. So, price-conscious consumers are more likely to acquire certain products, especially carbonated juices. In addition to devoting more shelf space to their private-label products, supermarket chains have been engaging in various in-house marketing and promotional efforts. As the demand for private-label brands is anticipated to increase, the global market for sparkling juices is also expected to grow during the forecast period.

Major Market Challenge

The fluctuating prices of raw materials are major challenges impeding the market growth. Sparkling Juices are primarily composed of fruits, carbonated water, sugar, and other components. The increase in the cost of raw materials raises the cost of producing sparkling juices. Thus, manufacturers of sparkling juices pay considerable expenditures while acquiring raw materials. In addition, bad weather conditions, national emergencies, natural catastrophes, supply shortages, and other unanticipated events also impact the availability of raw materials. 

The increase in product costs impacts consumer purchasing decisions, which impacts the manufacturer's market performance. Fruits and sugar used in the production of sparkling juices, as well as packaging materials such as plastic, aluminum, and paper, have prices that fluctuate based on their availability. Therefore, the volatility in the prices of raw materials may hinder the growth of the global market during the forecast period.

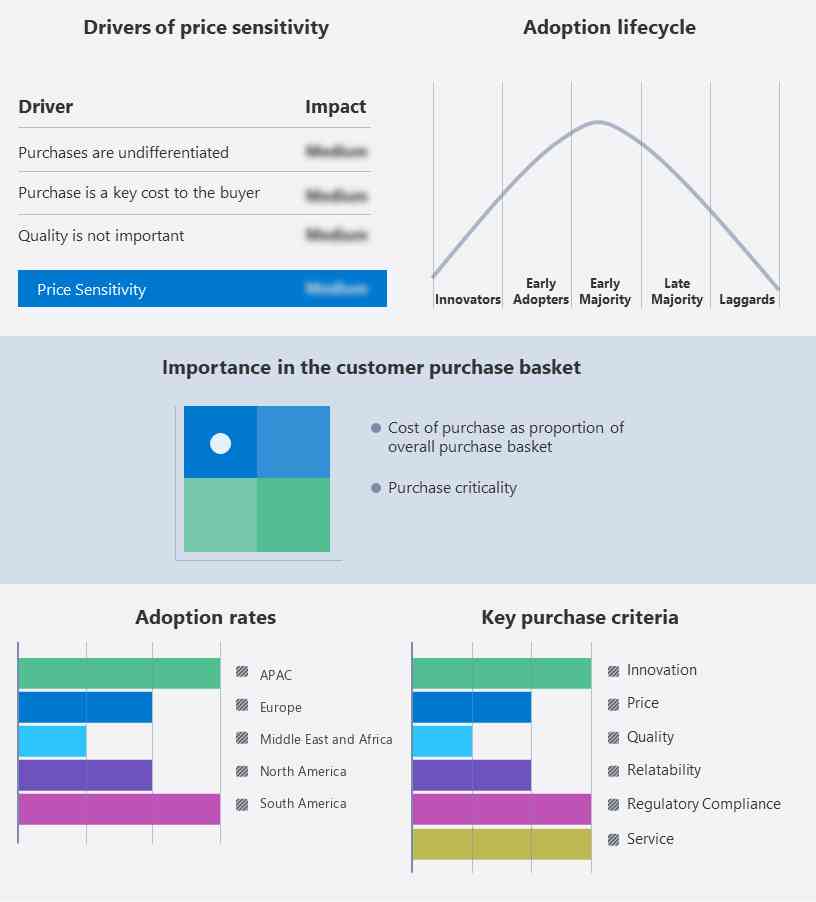
Key Market Customer Landscape

The report includes the adoption lifecycle of the market, covering from the innovator's stage to the laggard's stage. It focuses on adoption rates in different regions based on penetration. Furthermore, the report also includes key purchase criteria and drivers of price sensitivity to help companies evaluate and develop their growth strategies.

Sparkling Juices Market Share by Geography

Global Market Customer Landscape

Who are the Major Market Companies?

Companies are implementing various strategies, such as strategic alliances, partnerships, mergers and acquisitions, geographical expansion, and product/service launches, to enhance their presence in the market.

AriZona Beverages USA LLC - The company offers a wide range of beverages such as black tea, green tea, cocktails, coconut water, juices, and powdered mix. The key offerings of the company include sparkling juices such as Arnold Palmer, Fruit Punch, Watermelon, and Mucho Mango.

The report also includes detailed analyses of the competitive landscape of the market and information about 15 market vendors, including:

  • Apple and Eve LLC
  • Campbell Soup Co.
  • Cawston Press Ltd.
  • ENVASADOS EVA SA
  • Good Juicery
  • Juice and World
  • Keurig Dr Pepper Inc.
  • Kristian Regale Inc.
  • National Beverage Corp.
  • Nestle SA
  • Ocean Spray Cranberries Inc.
  • Parle Agro Pvt Ltd.
  • PepsiCo Inc.
  • Shloer
  • The J.M Smucker Co.

Qualitative and quantitative analysis of vendors has been conducted to help clients understand the wider business environment as well as the strengths and weaknesses of key market players. Data is qualitatively analyzed to categorize vendors as pure play, category-focused, industry-focused, and diversified; it is quantitatively analyzed to categorize vendors as dominant, leading, strong, tentative, and weak.

Market Analyst Overview

Sparkling juices, also known as sparkling juice beverages, have been gaining popularity among health-conscious consumers in both developed and emerging economies. These beverages offer a unique blend of fruit juice and carbonated water, creating a refreshing and bubbly drink. The market for juice beverages is developing rapidly, with natural flavors being a key trend. Packaging plays a crucial role in the market. Innovative designs and eco-friendly materials are being used to attract consumers. Advertisements and partnerships with distributors and partners are essential for companies to expand their reach in the supply chain. The non-alcoholic beverage market, which includes sparkling juices, is expected to grow significantly in the coming years. Fruit juice, carbonated water, sweeteners, and soda are the main components of these beverages.

However, concerns over added sugars, soft drinks, artificial flavors, preservatives, and other additives have led consumers to seek healthier alternatives. Technological innovations, such as product approvals and geographic expansions, are strategic moves for domestic market players to tap into revenue pockets and application niches. Trade regulations and import-export analysis are also important factors in the production analysis and value chain optimization of the sparkling juices industry. Champagne and soda are traditional competitors in the carbonated beverage market, but sparkling juices offer unique advantages, such as nutritional benefits, essential vitamins, and antioxidants. The market for juice beverages is expanding as consumers increasingly seek out products with natural flavors, while also showing interest in carbonated beverages for a refreshing alternative. The market for these beverages is expected to continue growing, driven by consumer demand for healthier, more natural options. The price range for sparkling juices varies, with some premium brands offering a more luxurious experience, reminiscent of champagne.

Market Scope

Report Coverage

Details

Page number

182

Base year

2023

Historic period

2018- 2022

Forecast period

2024-2028

Growth momentum & CAGR

Accelerate at a CAGR of 10.87%

Market growth 2024-2028

USD 1.05 billion

Market structure

Fragmented

YoY growth 2023-2024(%)

9.53

Regional analysis

Europe, North America, APAC, South America, and Middle East and Africa

Performing market contribution

Europe at 44%

Key countries

US, Germany, China, India, and UK

Competitive landscape

Leading Companies, Market Positioning of Companies, Competitive Strategies, and Industry Risks

Key companies profiled

Apple and Eve LLC, AriZona Beverages USA LLC, Campbell Soup Co., Cawston Press Ltd., ENVASADOS EVA SA, Good Juicery, Juice and World, Keurig Dr Pepper Inc., Kristian Regale Inc., National Beverage Corp., Nestle SA, Ocean Spray Cranberries Inc., Parle Agro Pvt Ltd., PepsiCo Inc., Shloer, The Coca Cola Co., The J.M Smucker Co., The S. Martinelli and Company, and Welch Foods Inc.

Market dynamics

Parent market analysis, Market Forecasting, Market growth inducers and obstacles, Fast-growing and slow-growing segment analysis, Market growth and Forecasting, COVID 19 impact and recovery analysis and future consumer dynamics, Market condition analysis for market forecast period

Customization purview

If our report has not included the data that you are looking for, you can reach out to our analysts and get segments customized.

Request PDF sample

What are the Key Data Covered in this Market Report?

  • CAGR of the market during the forecast period
  • Detailed information on factors that will drive the market growth and forecasting of the market between 2024 and 2028
  • Precise estimation of the size of the market size and its contribution to the parent market
  • Accurate predictions about upcoming market trends and analysis and changes in consumer behavior
  • Growth of the market industry across Europe, North America, APAC, South America, and Middle East and Africa
  • Thorough market growth analysis of the market's competitive landscape and detailed information about companies
  • Comprehensive market analysis and report on the factors that will challenge the market research and growth of market companies

We can help! Our analysts can customize this report to meet your requirements. Get in touch

1 Executive Summary

  • 1.1 Market overview
    • Executive Summary - Chart on Market Overview
    • Executive Summary - Data Table on Market Overview
    • Executive Summary - Chart on Global Market Characteristics
    • Executive Summary - Chart on Market by Geography
    • Executive Summary - Chart on Market Segmentation by Type
    • Executive Summary - Chart on Market Segmentation by Distribution Channel
    • Executive Summary - Chart on Incremental Growth
    • Executive Summary - Data Table on Incremental Growth
    • Executive Summary - Chart on Company Market Positioning

2 Market Landscape

  • 2.1 Market ecosystem
    • Parent Market
    • Data Table on - Parent Market
  • 2.2 Market characteristics
    • Market characteristics analysis
  • 2.3 Value chain analysis
    • Value Chain Analysis

3 Market Sizing

  • 3.1 Market definition
    • Offerings of companies included in the market definition
  • 3.2 Market segment analysis
    • Market segments
  • 3.3 Market size 2023
    • 3.4 Market outlook: Forecast for 2023-2028
      • Chart on Global - Market size and forecast 2023-2028 ($ million)
      • Data Table on Global - Market size and forecast 2023-2028 ($ million)
      • Chart on Global Market: Year-over-year growth 2023-2028 (%)
      • Data Table on Global Market: Year-over-year growth 2023-2028 (%)

    4 Historic Market Size

    • 4.1 Global Sparkling Juices Market 2018 - 2022
      • Historic Market Size - Data Table on Global Sparkling Juices Market 2018 - 2022 ($ million)
    • 4.2 Type segment analysis 2018 - 2022
      • Historic Market Size - Type Segment 2018 - 2022 ($ million)
    • 4.3 Distribution Channel segment analysis 2018 - 2022
      • Historic Market Size - Distribution Channel Segment 2018 - 2022 ($ million)
    • 4.4 Geography segment analysis 2018 - 2022
      • Historic Market Size - Geography Segment 2018 - 2022 ($ million)
    • 4.5 Country segment analysis 2018 - 2022
      • Historic Market Size - Country Segment 2018 - 2022 ($ million)

    5 Five Forces Analysis

    • 5.1 Five forces summary
      • Five forces analysis - Comparison between 2023 and 2028
    • 5.2 Bargaining power of buyers
      • Bargaining power of buyers - Impact of key factors 2023 and 2028
    • 5.3 Bargaining power of suppliers
      • Bargaining power of suppliers - Impact of key factors in 2023 and 2028
    • 5.4 Threat of new entrants
      • Threat of new entrants - Impact of key factors in 2023 and 2028
    • 5.5 Threat of substitutes
      • Threat of substitutes - Impact of key factors in 2023 and 2028
    • 5.6 Threat of rivalry
      • Threat of rivalry - Impact of key factors in 2023 and 2028
    • 5.7 Market condition
      • Chart on Market condition - Five forces 2023 and 2028

    6 Market Segmentation by Type

    • 6.1 Market segments
      • Chart on Type - Market share 2023-2028 (%)
      • Data Table on Type - Market share 2023-2028 (%)
    • 6.2 Comparison by Type
      • Chart on Comparison by Type
      • Data Table on Comparison by Type
    • 6.3 Sparkling juice drinks - Market size and forecast 2023-2028
      • Chart on Sparkling juice drinks - Market size and forecast 2023-2028 ($ million)
      • Data Table on Sparkling juice drinks - Market size and forecast 2023-2028 ($ million)
      • Chart on Sparkling juice drinks - Year-over-year growth 2023-2028 (%)
      • Data Table on Sparkling juice drinks - Year-over-year growth 2023-2028 (%)
    • 6.4 Hundred percent sparkling juice - Market size and forecast 2023-2028
      • Chart on Hundred percent sparkling juice - Market size and forecast 2023-2028 ($ million)
      • Data Table on Hundred percent sparkling juice - Market size and forecast 2023-2028 ($ million)
      • Chart on Hundred percent sparkling juice - Year-over-year growth 2023-2028 (%)
      • Data Table on Hundred percent sparkling juice - Year-over-year growth 2023-2028 (%)
    • 6.5 Sparkling juices from nectar - Market size and forecast 2023-2028
      • Chart on Sparkling juices from nectar - Market size and forecast 2023-2028 ($ million)
      • Data Table on Sparkling juices from nectar - Market size and forecast 2023-2028 ($ million)
      • Chart on Sparkling juices from nectar - Year-over-year growth 2023-2028 (%)
      • Data Table on Sparkling juices from nectar - Year-over-year growth 2023-2028 (%)
    • 6.6 Market opportunity by Type
      • Market opportunity by Type ($ million)
      • Data Table on Market opportunity by Type ($ million)

    7 Market Segmentation by Distribution Channel

    • 7.1 Market segments
      • Chart on Distribution Channel - Market share 2023-2028 (%)
      • Data Table on Distribution Channel - Market share 2023-2028 (%)
    • 7.2 Comparison by Distribution Channel
      • Chart on Comparison by Distribution Channel
      • Data Table on Comparison by Distribution Channel
    • 7.3 Supermarkets and hypermarkets - Market size and forecast 2023-2028
      • Chart on Supermarkets and hypermarkets - Market size and forecast 2023-2028 ($ million)
      • Data Table on Supermarkets and hypermarkets - Market size and forecast 2023-2028 ($ million)
      • Chart on Supermarkets and hypermarkets - Year-over-year growth 2023-2028 (%)
      • Data Table on Supermarkets and hypermarkets - Year-over-year growth 2023-2028 (%)
    • 7.4 On-trade - Market size and forecast 2023-2028
      • Chart on On-trade - Market size and forecast 2023-2028 ($ million)
      • Data Table on On-trade - Market size and forecast 2023-2028 ($ million)
      • Chart on On-trade - Year-over-year growth 2023-2028 (%)
      • Data Table on On-trade - Year-over-year growth 2023-2028 (%)
    • 7.5 Independent retailers - Market size and forecast 2023-2028
      • Chart on Independent retailers - Market size and forecast 2023-2028 ($ million)
      • Data Table on Independent retailers - Market size and forecast 2023-2028 ($ million)
      • Chart on Independent retailers - Year-over-year growth 2023-2028 (%)
      • Data Table on Independent retailers - Year-over-year growth 2023-2028 (%)
    • 7.6 Convenience stores - Market size and forecast 2023-2028
      • Chart on Convenience stores - Market size and forecast 2023-2028 ($ million)
      • Data Table on Convenience stores - Market size and forecast 2023-2028 ($ million)
      • Chart on Convenience stores - Year-over-year growth 2023-2028 (%)
      • Data Table on Convenience stores - Year-over-year growth 2023-2028 (%)
    • 7.7 Others - Market size and forecast 2023-2028
      • Chart on Others - Market size and forecast 2023-2028 ($ million)
      • Data Table on Others - Market size and forecast 2023-2028 ($ million)
      • Chart on Others - Year-over-year growth 2023-2028 (%)
      • Data Table on Others - Year-over-year growth 2023-2028 (%)
    • 7.8 Market opportunity by Distribution Channel
      • Market opportunity by Distribution Channel ($ million)
      • Data Table on Market opportunity by Distribution Channel ($ million)

    8 Customer Landscape

    • 8.1 Customer landscape overview
      • Analysis of price sensitivity, lifecycle, customer purchase basket, adoption rates, and purchase criteria

    9 Geographic Landscape

    • 9.1 Geographic segmentation
      • Chart on Market share by geography 2023-2028 (%)
      • Data Table on Market share by geography 2023-2028 (%)
    • 9.2 Geographic comparison
      • Chart on Geographic comparison
      • Data Table on Geographic comparison
    • 9.3 Europe - Market size and forecast 2023-2028
      • Chart on Europe - Market size and forecast 2023-2028 ($ million)
      • Data Table on Europe - Market size and forecast 2023-2028 ($ million)
      • Chart on Europe - Year-over-year growth 2023-2028 (%)
      • Data Table on Europe - Year-over-year growth 2023-2028 (%)
    • 9.4 North America - Market size and forecast 2023-2028
      • Chart on North America - Market size and forecast 2023-2028 ($ million)
      • Data Table on North America - Market size and forecast 2023-2028 ($ million)
      • Chart on North America - Year-over-year growth 2023-2028 (%)
      • Data Table on North America - Year-over-year growth 2023-2028 (%)
    • 9.5 APAC - Market size and forecast 2023-2028
      • Chart on APAC - Market size and forecast 2023-2028 ($ million)
      • Data Table on APAC - Market size and forecast 2023-2028 ($ million)
      • Chart on APAC - Year-over-year growth 2023-2028 (%)
      • Data Table on APAC - Year-over-year growth 2023-2028 (%)
    • 9.6 South America - Market size and forecast 2023-2028
      • Chart on South America - Market size and forecast 2023-2028 ($ million)
      • Data Table on South America - Market size and forecast 2023-2028 ($ million)
      • Chart on South America - Year-over-year growth 2023-2028 (%)
      • Data Table on South America - Year-over-year growth 2023-2028 (%)
    • 9.7 Middle East and Africa - Market size and forecast 2023-2028
      • Chart on Middle East and Africa - Market size and forecast 2023-2028 ($ million)
      • Data Table on Middle East and Africa - Market size and forecast 2023-2028 ($ million)
      • Chart on Middle East and Africa - Year-over-year growth 2023-2028 (%)
      • Data Table on Middle East and Africa - Year-over-year growth 2023-2028 (%)
    • 9.8 US - Market size and forecast 2023-2028
      • Chart on US - Market size and forecast 2023-2028 ($ million)
      • Data Table on US - Market size and forecast 2023-2028 ($ million)
      • Chart on US - Year-over-year growth 2023-2028 (%)
      • Data Table on US - Year-over-year growth 2023-2028 (%)
    • 9.9 China - Market size and forecast 2023-2028
      • Chart on China - Market size and forecast 2023-2028 ($ million)
      • Data Table on China - Market size and forecast 2023-2028 ($ million)
      • Chart on China - Year-over-year growth 2023-2028 (%)
      • Data Table on China - Year-over-year growth 2023-2028 (%)
    • 9.10 Germany - Market size and forecast 2023-2028
      • Chart on Germany - Market size and forecast 2023-2028 ($ million)
      • Data Table on Germany - Market size and forecast 2023-2028 ($ million)
      • Chart on Germany - Year-over-year growth 2023-2028 (%)
      • Data Table on Germany - Year-over-year growth 2023-2028 (%)
    • 9.11 India - Market size and forecast 2023-2028
      • Chart on India - Market size and forecast 2023-2028 ($ million)
      • Data Table on India - Market size and forecast 2023-2028 ($ million)
      • Chart on India - Year-over-year growth 2023-2028 (%)
      • Data Table on India - Year-over-year growth 2023-2028 (%)
    • 9.12 UK - Market size and forecast 2023-2028
      • Chart on UK - Market size and forecast 2023-2028 ($ million)
      • Data Table on UK - Market size and forecast 2023-2028 ($ million)
      • Chart on UK - Year-over-year growth 2023-2028 (%)
      • Data Table on UK - Year-over-year growth 2023-2028 (%)
    • 9.13 Market opportunity by geography
      • Market opportunity by geography ($ million)
      • Data Tables on Market opportunity by geography ($ million)

    10 Drivers, Challenges, and Opportunity/Restraints

    • 10.1 Market drivers
      • 10.2 Market challenges
        • 10.3 Impact of drivers and challenges
          • Impact of drivers and challenges in 2023 and 2028
        • 10.4 Market opportunities/restraints

          11 Competitive Landscape

          • 11.1 Overview
            • 11.2 Competitive Landscape
              • Overview on criticality of inputs and factors of differentiation
            • 11.3 Landscape disruption
              • Overview on factors of disruption
            • 11.4 Industry risks
              • Impact of key risks on business

            12 Competitive Analysis

            • 12.1 Companies profiled
              • Companies covered
            • 12.2 Market positioning of companies
              • Matrix on companies position and classification
            • 12.3 Apple and Eve LLC
              • Apple and Eve LLC - Overview
              • Apple and Eve LLC - Product / Service
              • Apple and Eve LLC - Key offerings
            • 12.4 AriZona Beverages USA LLC
              • AriZona Beverages USA LLC - Overview
              • AriZona Beverages USA LLC - Product / Service
              • AriZona Beverages USA LLC - Key offerings
            • 12.5 Campbell Soup Co.
              • Campbell Soup Co. - Overview
              • Campbell Soup Co. - Business segments
              • Campbell Soup Co. - Key news
              • Campbell Soup Co. - Key offerings
              • Campbell Soup Co. - Segment focus
            • 12.6 Cawston Press Ltd.
              • Cawston Press Ltd. - Overview
              • Cawston Press Ltd. - Product / Service
              • Cawston Press Ltd. - Key offerings
            • 12.7 ENVASADOS EVA SA
              • ENVASADOS EVA SA - Overview
              • ENVASADOS EVA SA - Product / Service
              • ENVASADOS EVA SA - Key offerings
            • 12.8 Juice and World
              • Juice and World - Overview
              • Juice and World - Product / Service
              • Juice and World - Key offerings
            • 12.9 Keurig Dr Pepper Inc.
              • Keurig Dr Pepper Inc. - Overview
              • Keurig Dr Pepper Inc. - Business segments
              • Keurig Dr Pepper Inc. - Key news
              • Keurig Dr Pepper Inc. - Key offerings
              • Keurig Dr Pepper Inc. - Segment focus
            • 12.10 Kristian Regale Inc.
              • Kristian Regale Inc. - Overview
              • Kristian Regale Inc. - Product / Service
              • Kristian Regale Inc. - Key offerings
            • 12.11 Nestle SA
              • Nestle SA - Overview
              • Nestle SA - Business segments
              • Nestle SA - Key news
              • Nestle SA - Key offerings
              • Nestle SA - Segment focus
            • 12.12 Ocean Spray Cranberries Inc.
              • Ocean Spray Cranberries Inc. - Overview
              • Ocean Spray Cranberries Inc. - Product / Service
              • Ocean Spray Cranberries Inc. - Key news
              • Ocean Spray Cranberries Inc. - Key offerings
            • 12.13 PepsiCo Inc.
              • PepsiCo Inc. - Overview
              • PepsiCo Inc. - Business segments
              • PepsiCo Inc. - Key news
              • PepsiCo Inc. - Key offerings
              • PepsiCo Inc. - Segment focus
            • 12.14 The Coca Cola Co.
              • The Coca Cola Co. - Overview
              • The Coca Cola Co. - Business segments
              • The Coca Cola Co. - Key news
              • The Coca Cola Co. - Key offerings
              • The Coca Cola Co. - Segment focus
            • 12.15 The J.M Smucker Co.
              • The J.M Smucker Co. - Overview
              • The J.M Smucker Co. - Business segments
              • The J.M Smucker Co. - Key news
              • The J.M Smucker Co. - Key offerings
              • The J.M Smucker Co. - Segment focus
            • 12.16 The S. Martinelli and Company
              • The S. Martinelli and Company - Overview
              • The S. Martinelli and Company - Product / Service
              • The S. Martinelli and Company - Key offerings
            • 12.17 Welch Foods Inc.
              • Welch Foods Inc. - Overview
              • Welch Foods Inc. - Product / Service
              • Welch Foods Inc. - Key offerings

            13 Appendix

            • 13.1 Scope of the report
              • 13.2 Inclusions and exclusions checklist
                • Inclusions checklist
                • Exclusions checklist
              • 13.3 Currency conversion rates for US$
                • Currency conversion rates for US$
              • 13.4 Research methodology
                • Research methodology
              • 13.5 Data procurement
                • Information sources
              • 13.6 Data validation
                • Data validation
              • 13.7 Validation techniques employed for market sizing
                • Validation techniques employed for market sizing
              • 13.8 Data synthesis
                • Data synthesis
              • 13.9 360 degree market analysis
                • 360 degree market analysis
              • 13.10 List of abbreviations
                • List of abbreviations

              Research Methodology

              Technavio presents a detailed picture of the market by way of study, synthesis, and summation of data from multiple sources. The analysts have presented the various facets of the market with a particular focus on identifying the key industry influencers. The data thus presented is comprehensive, reliable, and the result of extensive research, both primary and secondary.

              INFORMATION SOURCES

              Primary sources

              • Manufacturers and suppliers
              • Channel partners
              • Industry experts
              • Strategic decision makers

              Secondary sources

              • Industry journals and periodicals
              • Government data
              • Financial reports of key industry players
              • Historical data
              • Press releases

              DATA ANALYSIS

              Data Synthesis

              • Collation of data
              • Estimation of key figures
              • Analysis of derived insights

              Data Validation

              • Triangulation with data models
              • Reference against proprietary databases
              • Corroboration with industry experts

              REPORT WRITING

              Qualitative

              • Market drivers
              • Market challenges
              • Market trends
              • Five forces analysis

              Quantitative

              • Market size and forecast
              • Market segmentation
              • Geographical insights
              • Competitive landscape

              Interested in this report?

              Get your sample now to see our research methodology and insights!

              Download Now

              Frequently Asked Questions

              Sparkling Juices market growth will increase by $ 1050.8 mn during 2024-2028.

              The Sparkling Juices market is expected to grow at a CAGR of 10.87% during 2024-2028.

              Sparkling Juices market is segmented by Type( Sparkling juice drinks, Hundred percent sparkling juice, Sparkling juices from nectar) Distribution Channel( Supermarkets and hypermarkets, On-trade, Independent retailers, Convenience stores, Others)

              Apple and Eve LLC, AriZona Beverages USA LLC, Campbell Soup Co., Cawston Press Ltd., ENVASADOS EVA SA, Good Juicery, Juice and World, Keurig Dr Pepper Inc., Kristian Regale Inc., National Beverage Corp., Nestle SA, Ocean Spray Cranberries Inc., Parle Agro Pvt Ltd., PepsiCo Inc., Shloer, The Coca Cola Co., The J.M Smucker Co., The S. Martinelli and Company, Welch Foods Inc. are a few of the key vendors in the Sparkling Juices market.

              Europe will register the highest growth rate of 44% among the other regions. Therefore, the Sparkling Juices market in Europe is expected to garner significant business opportunities for the vendors during the forecast period.

              US, Germany, China, India, UK

              • Benefits of cold-pressed sparkling juice when compared with traditional juiceCold-pressed sparkling juices are those that are extracted from fruits using a hydraulic press is the driving factor this market.
              • as opposed to other processes such as centrifugation or a single auger. Cold-pressed sparkling juices provide nutrients that combat pollutants is the driving factor this market.
              • detoxify the body is the driving factor this market.
              • and improve health and immunity. They are a great source of vitamins is the driving factor this market.
              • minerals is the driving factor this market.
              • and other nutrients because their preparation does not need heat. Traditional juices are heated throughout the preparation process is the driving factor this market.
              • which might contribute to nutritional loss in the final product. Cold-pressed sparkling juices are also useful for detoxifying the body because they minimize the amount of energy required for meal digestion. This is because liquid nutrients from raw substances are absorbed faster by the body cells. PepsiCo Inc. is the driving factor this market.
              • for instance is the driving factor this market.
              • distributes cold-pressed effervescent fruit juices under the Tropicana brand on the global market. The increase in the number of cold-pressed sparkling juice bars worldwide that provide cold-pressed sparkling juices is another aspect that can help the market growth. In nations such as the United States is the driving factor this market.
              • the United Kingdom is the driving factor this market.
              • China is the driving factor this market.
              • and India is the driving factor this market.
              • the number of cold-pressed sparkling juice bars is rising rapidly. Consequently is the driving factor this market.
              • the numerous health benefits of cold-pressed sparkling juices over traditionally-pressed juices and the rise in the number of cold-pressed sparkling juice bars will contribute to an increase in their sales in the sparkling juices market during the forecast period. is the driving factor this market.

              The Sparkling Juices market vendors should focus on grabbing business opportunities from the Sparkling juice drinks segment as it accounted for the largest market share in the base year.