
Special Purpose Machines Market Size 2025-2029
The special purpose machines market size is valued to increase by USD 2.55 billion, at a CAGR of 6.5% from 2024 to 2029. Increasing demand for fabricated metal products will drive the special purpose machines market.
Major Market Trends & Insights
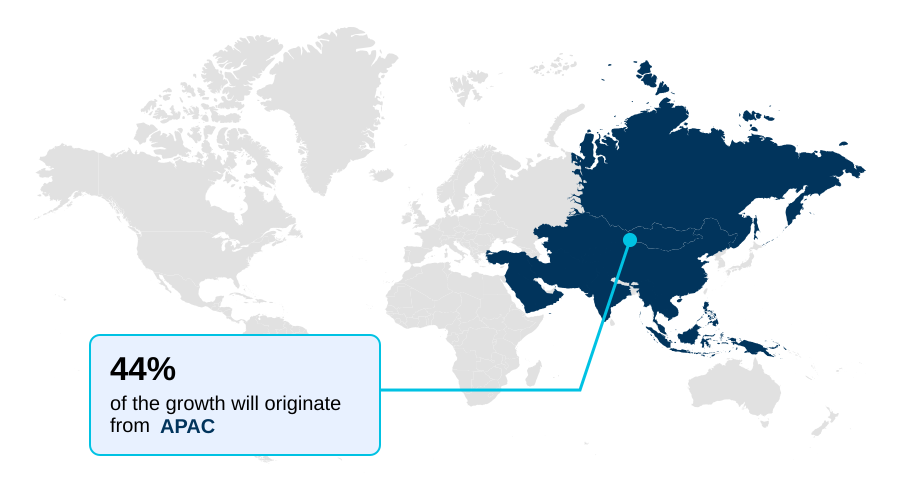
- APAC dominated the market and accounted for a 43.7% growth during the forecast period.
- By End-user - OEMs segment was valued at USD 4.45 billion in 2023
- By Type - Metal working machines segment accounted for the largest market revenue share in 2023
Market Size & Forecast
- Market Opportunities: USD 3.59 billion
- Market Future Opportunities: USD 2.55 billion
- CAGR from 2024 to 2029 : 6.5%
Market Summary
- The Special Purpose Machines Market is undergoing a significant transformation, driven by the industrial imperative for higher efficiency, precision, and automation. Demand is escalating for solutions that move beyond conventional capabilities, integrating technologies like the industrial internet of things (IIoT) and advanced robotics.
- In a typical scenario, an aerospace components manufacturer must produce complex parts from exotic alloys with zero defects. Here, reliance shifts from manual processes to a fully automated cell featuring 5-axis cnc milling and a cnc waterjet cutter. This setup uses predictive maintenance sensors to anticipate tool wear, while automated job clamping and robotic handling systems ensure a seamless workflow.
- The process is designed and verified using digital twin simulation to optimize the entire sequence, from the cold cutting process to final inspection, minimizing material waste and cycle times.
- This adoption of multi-axis machining centers, programmable logic controllers (plcs), and custom tooling and fixtures is no longer a luxury but a competitive necessity, pushing the boundaries of manufacturing excellence and operational intelligence across high-stakes industries.
What will be the Size of the Special Purpose Machines Market during the forecast period?

Get Key Insights on Market Forecast (PDF) Get Free Sample
How is the Special Purpose Machines Market Segmented?
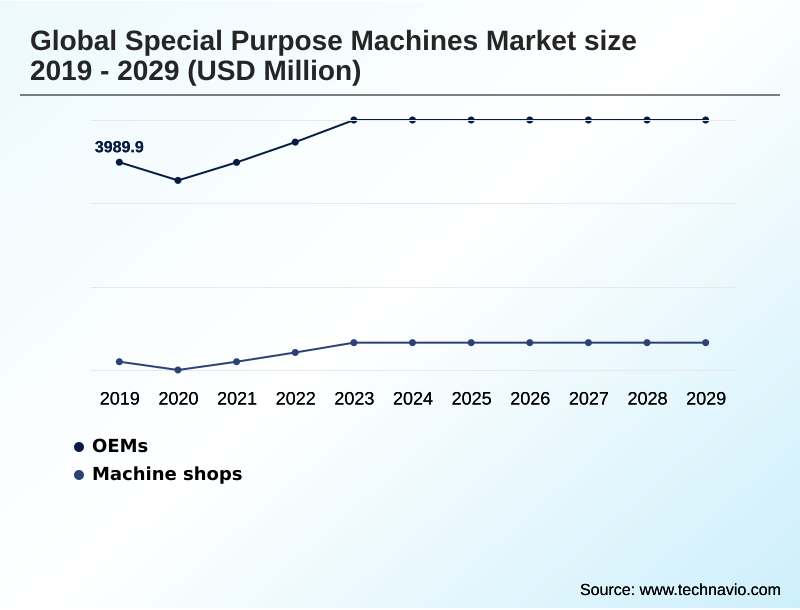
The special purpose machines industry research report provides comprehensive data (region-wise segment analysis), with forecasts and estimates in "USD million" for the period 2025-2029, as well as historical data from 2019-2023 for the following segments.
- End-user
- OEMs
- Machine shops
- Type
- Metal working machines
- Parts and accessories
- Installation
- Repair and maintenance
- Application
- Automotive
- Fabrication and industrial machinery
- Marine aerospace and defense
- Precision engineering
- Geography
- APAC
- China
- Japan
- India
- Europe
- Germany
- France
- UK
- North America
- US
- Canada
- Mexico
- South America
- Brazil
- Argentina
- Colombia
- Middle East and Africa
- Saudi Arabia
- UAE
- South Africa
- Rest of World (ROW)
- APAC
By End-user Insights
The oems segment is estimated to witness significant growth during the forecast period.
The Original Equipment Manufacturers (OEMs) segment is pivotal, driven by the necessity for in-house control over critical manufacturing processes. By leveraging customized automation systems and purpose-built industrial machines, OEMs in sectors such as automotive and aerospace maintain stringent quality standards.
This strategic choice involves significant investment in precision engineering equipment, including specialized production equipment and high-speed inspection systems, to produce complex, high-value components.
The adoption of tailored manufacturing solutions and aseptic filling and packaging machinery in relevant industries allows for the direct oversight of the entire production cycle.
This hands-on approach is fundamental to innovation and ensures finished product defect rates are consistently minimized by over 15%, solidifying their competitive advantage through superior product integrity and performance.
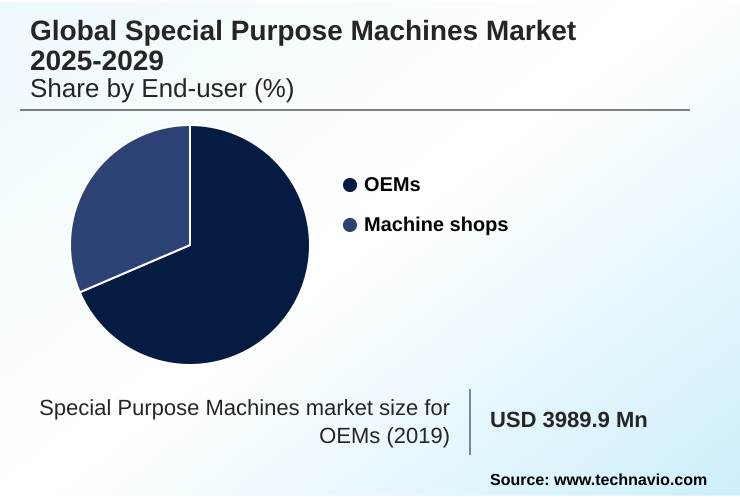
The OEMs segment was valued at USD 4.45 billion in 2023 and showed a gradual increase during the forecast period.
Regional Analysis
APAC is estimated to contribute 43.7% to the growth of the global market during the forecast period.Technavio’s analysts have elaborately explained the regional trends and drivers that shape the market during the forecast period.
See How Special Purpose Machines Market Demand is Rising in APAC Get Free Sample
The global geographic landscape is dominated by the APAC region, which is set to contribute approximately 43% of the market's incremental growth.
This expansion, growing at a rate nearly 2% higher than that of Europe, is fueled by robust manufacturing sectors in China, Japan, and India.
These economies are heavily investing in specialized industrial machines and bespoke automation equipment to meet the demands of the automotive and electronics industries.
The proliferation of electric vehicle production, for instance, requires sophisticated electric motor winding machinery and specialized medical device machinery. This demand for advanced mechatronic system integration and real-time system monitoring is transforming regional factories.
Consequently, the adoption of technologies like the vertical turning lathe is accelerating, cementing APAC's role as both the largest and fastest-growing market for application-specific machinery and smart factory automation.
Market Dynamics
Our researchers analyzed the data with 2024 as the base year, along with the key drivers, trends, and challenges. A holistic analysis of drivers will help companies refine their marketing strategies to gain a competitive advantage.
- Strategic decision-making in the special purpose machines market is increasingly complex, shaped by a confluence of technological capabilities and economic pressures. For instance, selecting the right cnc machine for exotic materials requires evaluating not just cutting performance but also the total cost of 5-axis cnc ownership.
- The waterjet vs laser cutting process debate continues, with the former favored for heat-sensitive applications. Simultaneously, the industry 4.0 impact on machinery is compelling businesses to consider retrofitting machinery with iot sensors for predictive maintenance on industrial machines, a move that promises greater uptime.
- Economically, the choice between leasing versus buying cnc machinery is critical, with rental models for industrial machines offering flexibility amid raw material volatility production impact. This is particularly relevant as oem in-house machining advantages are weighed against outsourcing.
- Application-specific demands are also creating new frontiers, from special purpose machines for ev batteries and renewable energy component manufacturing machines to high-precision semiconductor manufacturing machines and automated pharmaceutical packaging machinery.
- In aerospace and defense, custom robotic aerospace assembly cells and special purpose defense manufacturing machines are becoming standard, while the healthcare sector drives demand for special purpose machines for medical devices and precision engineering automation solutions. Even food processing is evolving with ultrasonic machines, showcasing the market's vast and specialized trajectory.
What are the key market drivers leading to the rise in the adoption of Special Purpose Machines Industry?
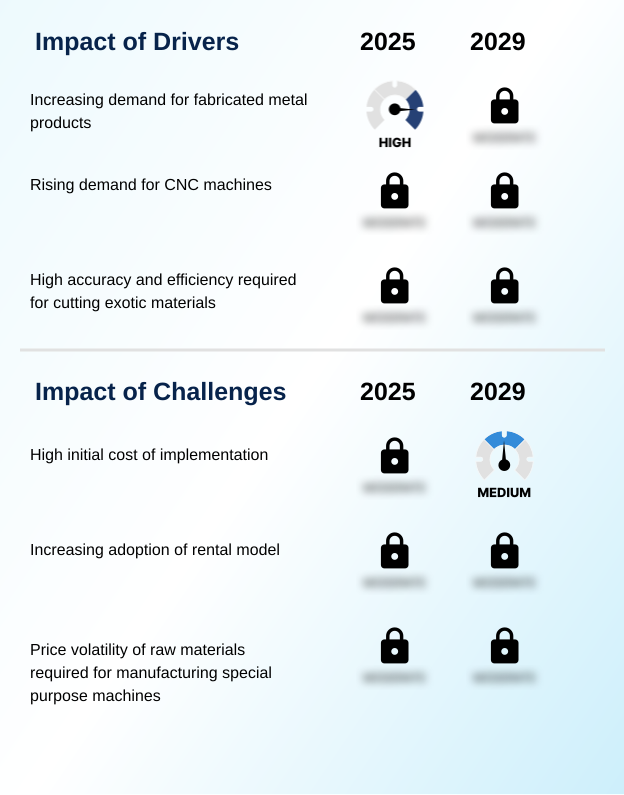
- The growing global requirement for fabricated metal products serves as a primary market driver.
- Market growth is fundamentally driven by the manufacturing sector's relentless pursuit of greater precision, efficiency, and automation.
- The widespread adoption of the cnc milling machine and similar computer-aided manufacturing (cam) technologies has become a baseline requirement, with such systems reducing manual labor costs by over 30% in typical metalworking environments.
- Demand is also high for advanced cutting methods; the cold cutting process, powered by high-pressure pump systems, is critical for processing heat-sensitive alloys without creating a heat-affected zone, which can reduce secondary finishing costs by as much as 20%.
- This is particularly vital in the special purpose machine for automotive sector.
- As industries demand higher throughput, a focus on machine tools for metal fabrication and high-volume production machinery with superior accuracy and reliability continues to fuel investment in next-generation equipment.
What are the market trends shaping the Special Purpose Machines Industry?
- The advent of 3D printing represents an emerging market trend. This technology is poised to redefine manufacturing processes by offering new investment opportunities.
- Key market trends are centered on the integration of intelligent technologies to boost efficiency and create new manufacturing paradigms. The adoption of digital twin simulation, for instance, allows companies to model and de-risk complex production lines before physical implementation, accelerating project timelines by up to 25%.
- Concurrently, ultrasonic cutting technology is gaining traction in the food processing industry, where its frictionless, high-frequency vibratory blade technology reduces machine cleaning downtime by over 30% while maintaining product integrity. This move toward smarter, application-specific solutions is further exemplified by the development of modular machine design and custom machine design services.
- These trends enable the creation of turnkey automation solutions and smart factory automation, allowing manufacturers to rapidly deploy and scale production capabilities in response to dynamic market demands.
What challenges does the Special Purpose Machines Industry face during its growth?
- The substantial initial cost of implementation presents a significant challenge to market growth.
- Key challenges center on the economic and operational complexities of deploying and maintaining advanced machinery. The high capital investment for equipment such as a 5-axis cnc milling machine remains a significant barrier, with total lifecycle costs often exceeding the initial purchase price by 200% due to maintenance and consumables.
- This financial pressure is encouraging the adoption of leasing special purpose machines, altering traditional sales models. Furthermore, the price volatility of raw materials can impact production costs by as much as 15% in a single quarter, creating significant uncertainty for builders of made-to-order industrial machinery.
- These financial hurdles, combined with the technical demands of integrating application-specific machinery like gantry robotic drilling systems, require robust strategic planning to ensure a positive return on investment.
Exclusive Technavio Analysis on Customer Landscape
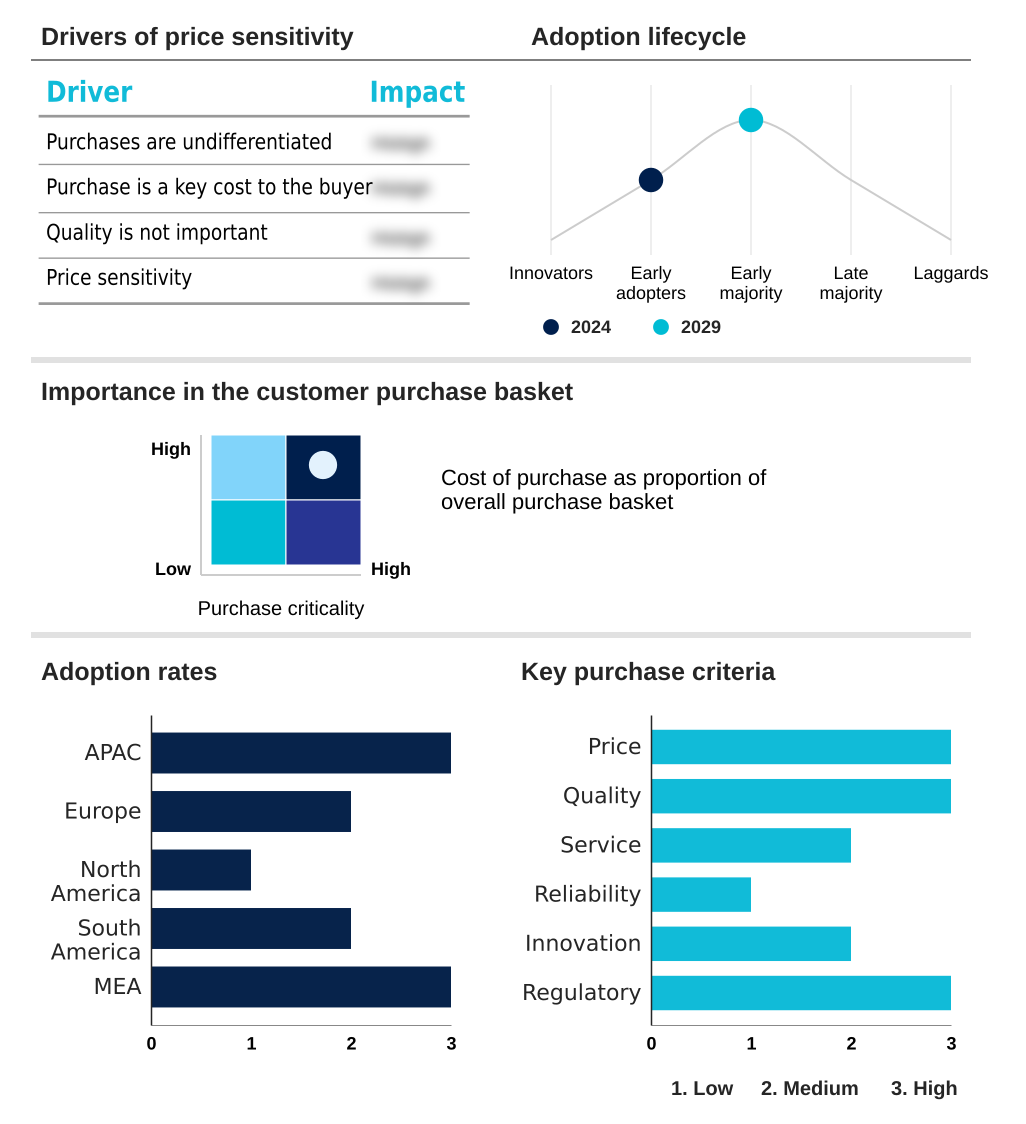
The special purpose machines market forecasting report includes the adoption lifecycle of the market, covering from the innovator’s stage to the laggard’s stage. It focuses on adoption rates in different regions based on penetration. Furthermore, the special purpose machines market report also includes key purchase criteria and drivers of price sensitivity to help companies evaluate and develop their market growth analysis strategies.
Customer Landscape of Special Purpose Machines Industry
Competitive Landscape
Companies are implementing various strategies, such as strategic alliances, special purpose machines market forecast, partnerships, mergers and acquisitions, geographical expansion, and product/service launches, to enhance their presence in the industry.
Balief Corp. - The landscape is characterized by a fragmented array of global and regional firms providing specialized machine tools and tailored automation for various industrial needs.
The industry research and growth report includes detailed analyses of the competitive landscape of the market and information about key companies, including:
- Balief Corp.
- Batliboi Ltd.
- DMG MORI Co. Ltd.
- Electronica India Ltd.
- EMAG GmbH and Co. KG
- ETA Technology Pvt. Ltd.
- FIVES SAS
- Garud Automation
- Genertec Dalian Machine Tool
- Global CNC Pvt. Ltd.
- Hann Kuen Machinery and Hardware Co. Ltd.
- HMT Ltd.
- Invensys Engineers
- Krishna Engineering
- Mitsubishi Heavy Ltd.
- Neumatica Technologies Pvt Ltd.
- Shenoy Engineering Pvt. Ltd.
- Vee Technologies Pvt. Ltd.
- Yamazaki Mazak Corp.
Qualitative and quantitative analysis of companies has been conducted to help clients understand the wider business environment as well as the strengths and weaknesses of key industry players. Data is qualitatively analyzed to categorize companies as pure play, category-focused, industry-focused, and diversified; it is quantitatively analyzed to categorize companies as dominant, leading, strong, tentative, and weak.
Recent Development and News in Special purpose machines market
- In November, 2024, DMG MORI Co. Ltd. announced a strategic partnership with a leading cloud provider to integrate advanced IIoT and predictive maintenance analytics into its entire line of 5-axis CNC machines, enhancing operational uptime for customers.
- In January, 2025, Yamazaki Mazak Corp. launched a new series of ultra-precision machining centers specifically designed for the semiconductor industry, capable of achieving sub-micron tolerances required for next-generation wafer fabrication equipment.
- In March, 2025, FIVES SAS completed the acquisition of a robotics integration firm, expanding its capabilities in automated battery module assembly lines to meet surging demand from the electric vehicle sector.
- In May, 2025, EMAG GmbH and Co. KG inaugurated a new Additive Manufacturing Center of Excellence, focused on developing hybrid special purpose machines that combine traditional subtractive cutting with industrial 3D printing for complex component production.
Dive into Technavio’s robust research methodology, blending expert interviews, extensive data synthesis, and validated models for unparalleled Special Purpose Machines Market insights. See full methodology.
| Market Scope | |
|---|---|
| Page number | 298 |
| Base year | 2024 |
| Historic period | 2019-2023 |
| Forecast period | 2025-2029 |
| Growth momentum & CAGR | Accelerate at a CAGR of 6.5% |
| Market growth 2025-2029 | USD 2546.5 million |
| Market structure | Fragmented |
| YoY growth 2024-2025(%) | 6.0% |
| Key countries | China, Japan, India, South Korea, Australia, Indonesia, Germany, France, UK, Italy, The Netherlands, Spain, US, Canada, Mexico, Brazil, Argentina, Colombia, Saudi Arabia, UAE, South Africa, Israel and Turkey |
| Competitive landscape | Leading Companies, Market Positioning of Companies, Competitive Strategies, and Industry Risks |
Research Analyst Overview
- The market is defined by a decisive shift from standalone equipment to deeply integrated, intelligent systems. The core of this evolution lies in mechatronic system integration, where technologies such as 5-axis cnc milling, cnc waterjet cutters, and vertical turning lathes are enhanced with programmable logic controllers (plcs) and servo-driven motion control.
- This is particularly evident in the use of abrasive waterjet cutting and other cold cutting process techniques that ensure heat-affected zone elimination, a critical requirement in precision-driven sectors. For boardroom consideration, the decision is no longer about purchasing a single machine but investing in an entire ecosystem supported by digital twin simulation.
- Firms leveraging predictive maintenance sensors within these systems report a 35% reduction in critical component failures. This trend extends to specialized applications, including automated fiber placement, gantry robotic drilling, and precision welding systems for aerospace. Furthermore, the push towards advanced manufacturing is driving adoption of additive manufacturing integration, custom automated inspection, and robotic handling systems.
- We are also seeing growth in hydroforming press technology, laser welding systems, and specialized machinery for semiconductor packaging equipment, electric motor winding machinery, and high-speed inspection systems, all pointing to a future of highly automated and data-driven production environments.
What are the Key Data Covered in this Special Purpose Machines Market Research and Growth Report?
-
What is the expected growth of the Special Purpose Machines Market between 2025 and 2029?
-
USD 2.55 billion, at a CAGR of 6.5%
-
-
What segmentation does the market report cover?
-
The report is segmented by End-user (OEMs, Machine shops), Type (Metal working machines, parts and accessories, installation, Repair and maintenance), Application (Automotive, fabrication and industrial machinery, Marine aerospace and defense, Precision engineering) and Geography (APAC, Europe, North America, South America, Middle East and Africa)
-
-
Which regions are analyzed in the report?
-
APAC, Europe, North America, South America and Middle East and Africa
-
-
What are the key growth drivers and market challenges?
-
Increasing demand for fabricated metal products, High initial cost of implementation
-
-
Who are the major players in the Special Purpose Machines Market?
-
Balief Corp., Batliboi Ltd., DMG MORI Co. Ltd., Electronica India Ltd., EMAG GmbH and Co. KG, ETA Technology Pvt. Ltd., FIVES SAS, Garud Automation, Genertec Dalian Machine Tool, Global CNC Pvt. Ltd., Hann Kuen Machinery and Hardware Co. Ltd., HMT Ltd., Invensys Engineers, Krishna Engineering, Mitsubishi Heavy Ltd., Neumatica Technologies Pvt Ltd., Shenoy Engineering Pvt. Ltd., Vee Technologies Pvt. Ltd. and Yamazaki Mazak Corp.
-
Market Research Insights
- The market's momentum is increasingly defined by the strategic adoption of bespoke manufacturing machinery and turnkey automation solutions to achieve specific operational goals. For instance, manufacturers implementing automated assembly line solutions report productivity gains exceeding 20% compared to legacy systems.
- The deployment of custom machinery for aerospace applications, integrated with advanced sensors, has been shown to reduce inspection times by up to 30%. Furthermore, the shift toward flexible manufacturing systems enables businesses to adapt to changing product specifications with minimal downtime.
- This focus on specialized production equipment and tailored manufacturing solutions is critical, as enterprises seek not just automation, but intelligent, purpose-built systems that deliver a clear and measurable return on investment through enhanced efficiency and quality control.
We can help! Our analysts can customize this special purpose machines market research report to meet your requirements.
 RIA -
RIA - 
