Specialty Silica Market Analysis, Size, and Forecast 2024-2028: North America (US), Europe (Germany), APAC (China and India), South America (Brazil), and Rest of World (ROW)

Specialty Silica Market Analysis, Size, and Forecast 2024-2028:
North America (US), Europe (Germany), APAC (China and India), South America (Brazil), and Rest of World (ROW)

Published: Jul 2024 187 Pages SKU: IRTNTR43228

Market Overview at a Glance

$5.37 B
Market Opportunity
8.22%
CAGR
7.43
YoY growth 2023-2024(%)

Specialty Silica Market Size 2024-2028 

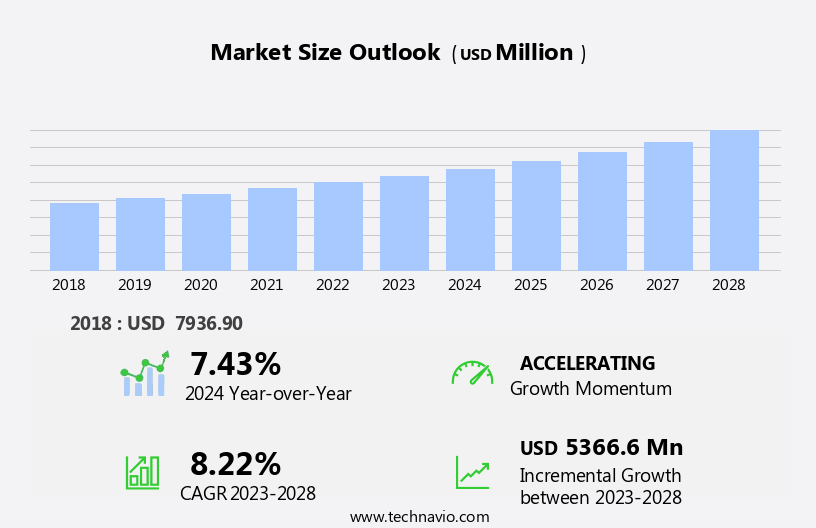
The specialty silica market size is forecast to increase by USD 5.37 billion at a CAGR of 8.22% between 2023 and 2028. The market is experiencing significant growth due to the increasing demand for silica-based products in various industries. Precipitated silica, a key type of specialty silica, is gaining popularity in the food industry due to its functional properties. Additionally, the development of eco-friendly silica gel products is a notable trend in the market, as there is a growing emphasis on sustainability. However, the market faces challenges, including the need to comply with stringent government regulations. Silica gel finds extensive use as desiccants, while colloidal silica is increasingly used in agrochemicals and oral care applications. The rise of electric vehicles is also expected to boost the demand for specialty silica in the automotive industry. Overall, the market is poised for steady growth, driven by its diverse applications and the continuous innovation in silica-based products.

Specialty Silica Market Size

 Request Free Sample

The market is witnessing significant growth due to its diverse applications across industries. Companies like Lion Electric are exploring fuel-saving tires made with advanced silica, enhancing vehicle efficiency and reducing emissions. Imerys, a key player in the production of industrial rubber, supplies high-quality silica to improve the performance of tires, footwear, and other rubber products. In addition, silica's use in the production of substitute products is gaining traction, as it can reduce the reliance on traditional materials. Amid the rise of global health concerns, such as the recent virus outbreaks, specialty silica is also being explored for use in products with antimicrobial properties. This innovation enhances consumer demand, making silica essential in the modern industrial landscape.

Market Segmentation

The market research report provides comprehensive data (region-wise segment analysis), with forecasts and estimates in "USD million" for the period 2024-2028, as well as historical data from 2018-2022 for the following segments.
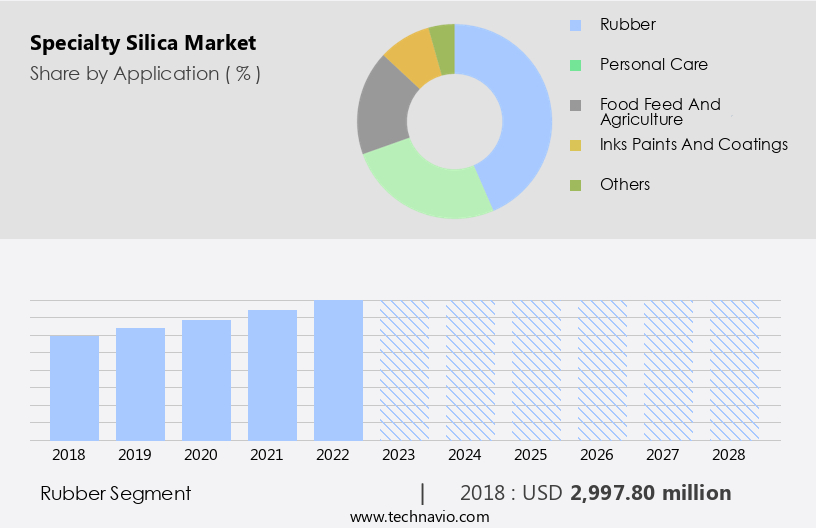
  • Application
    • Rubber
    • Personal care
    • Food feed and agriculture
    • Inks paints and coatings
    • Others
  • Type
    • Precipitated silica
    • Fumed silica
    • Colloidal silica
    • Silica gel
    • Fused silica
  • Geography
    • APAC
      • China
      • India
    • Europe
      • Germany
    • North America
      • US
    • South America
      • Brazil
    • Middle East and Africa

By Application Insights

The rubber segment is estimated to witness significant growth during the forecast period. Silica plays a significant role in various industries, including the manufacturing of PVC sheets, optical parts, semiconductors, desiccants, pharmaceuticals, and packaged food. In the realm of PVC sheets, silica acts as a reinforcing filler, enhancing their durability and strength. This property is particularly valuable in the production of optical parts, where precision and durability are paramount. In the semiconductor industry, silica is utilized as a crucial component in the production of photovoltaic cells and integrated circuits. Its unique properties, such as high thermal stability and excellent insulating properties, make it an indispensable ingredient in these advanced technologies.

Moreover, in the pharmaceutical sector, silica is employed as a desiccant to maintain the dryness of medications, ensuring their efficacy and longevity. In the food industry, packaged food benefits from the use of silica as an anti-caking agent, preventing clumping and improving the flowability of food products. The increasing demand for these industries, driven by population growth and urbanization, is expected to fuel the growth of the market in the United States. Silica's versatility and essential role in various applications make it a valuable commodity in the US industrial landscape.

Specialty Silica Market Size

Get a glance at the market share of various segments Request Free Sample

The rubber segment accounted for USD 3.00 billion in 2018 and showed a gradual increase during the forecast period.

Regional Insights

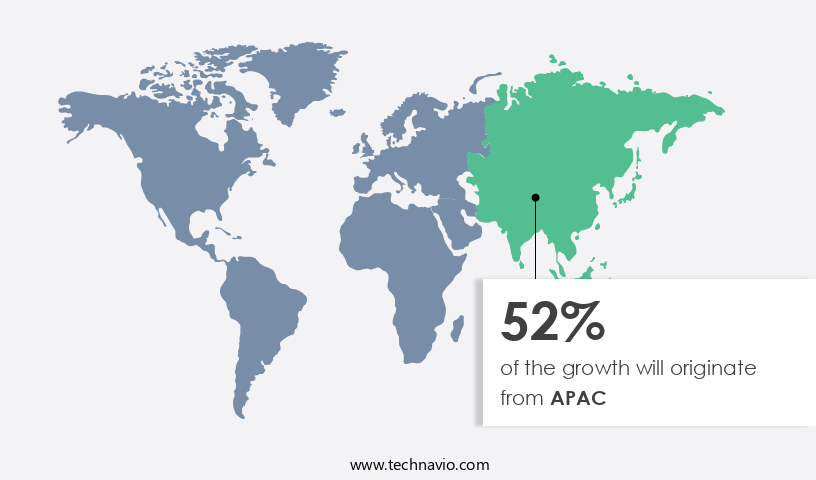
APAC is estimated to contribute 52% to the growth of the global market during the forecast period. Technavio's analysts have elaborately explained the regional trends and drivers that shape the market during the forecast period.

Specialty Silica Market Share by Geography

For more insights on the market share of various regions Request Free Sample

Specialty silica is in high demand across various industries in Asia Pacific (APAC), particularly in the production of rubber products, paints, coatings, construction, and electric automobiles. India, China, Japan, and Australia are the major contributors to the market in APAC due to their large-scale production and consumption. The burgeoning automotive industry, driven by the increasing demand for tires, is a significant factor fueling the growth of the market in the region. Furthermore, the wide application of specialty silica in personal care products, food, feed, and agricultural industries, as well as in ink, paints, and coatings, is expected to boost market growth during the forecast period. The increasing popularity of electric vehicles (EVs) in APAC, particularly in China, is also expected to provide significant opportunities for market expansion.

Our researchers analyzed the data with 2023 as the base year, along with the key drivers, trends, and challenges. A holistic analysis of drivers will help companies refine their marketing strategies to gain a competitive advantage.

Market Driver

Growing applications of precipitated silica in food industry is the key driver of the market. In the specialized market, silica and silica-based products play a pivotal role, particularly in the tire sector and the emerging electric vehicle industry. These innovative materials offer significant benefits, including acting as effective anti-caking and free-flowing agents. By coating host powders, they minimize inter-particle interactions and prevent the binding of powder elements when excess liquids, oils, or fats are absorbed.

Furthermore, silica carrier agents can absorb substantial liquid quantities while retaining their powdery characteristics, making the handling of viscous or reactive products more manageable. In the realm of affordable housing, silica is also employed as a crucial component in construction materials, enhancing their durability and strength.

The development of environment-friendly silica gel products is the upcoming trend in the market. The market is witnessing significant advancements due to the growing demand for eco-friendly silica gel products. This trend is driven by increasing global concerns for environmental protection. One notable development is the introduction of Eco Blue Silica Gel by Nantong OhE Chemicals, which does not contain cobalt dichloride or cobalt chloride, known pollutants in traditional allochroic silica gel products. These chemicals contribute to water pollution and pose harm to aquatic life. As more manufacturers introduce silica gel products with reduced percentages of these chemicals, the market for specialty silica is poised for growth.

Similarly, key applications of specialty silica include agrochemicals, oral care, desiccants, and electric vehicles. In the US market, this trend is expected to continue, with an emphasis on sustainable and eco-friendly manufacturing processes. 

Market Challenge

The need to comply with stringent government regulations is a key challenge affecting the market growth. Silica, a potentially harmful substance, is linked to lung and throat cancer, as well as other health issues such as silicosis, kidney diseases, and chronic obstructive pulmonary disease. OSHA, the US regulatory body responsible for worker safety and health, has implemented stringent guidelines to minimize silica exposure. These regulations include limiting the permissible exposure limit to 50 micrograms per cubic meter of air for workers with extended shifts, the use of engineering controls like water and ventilation, provision of respirators, and written exposure control plans.

OSHA also mandates medical exams for highly exposed workers, training for all employees regarding silica risks, and offers flexibility for small businesses to protect their workforce. Manufacturers in the silica industry are required to educate their employees about the health hazards of silica, implement preventive measures, provide protective equipment, and maintain emergency response protocols.

Exclusive Customer Landscape

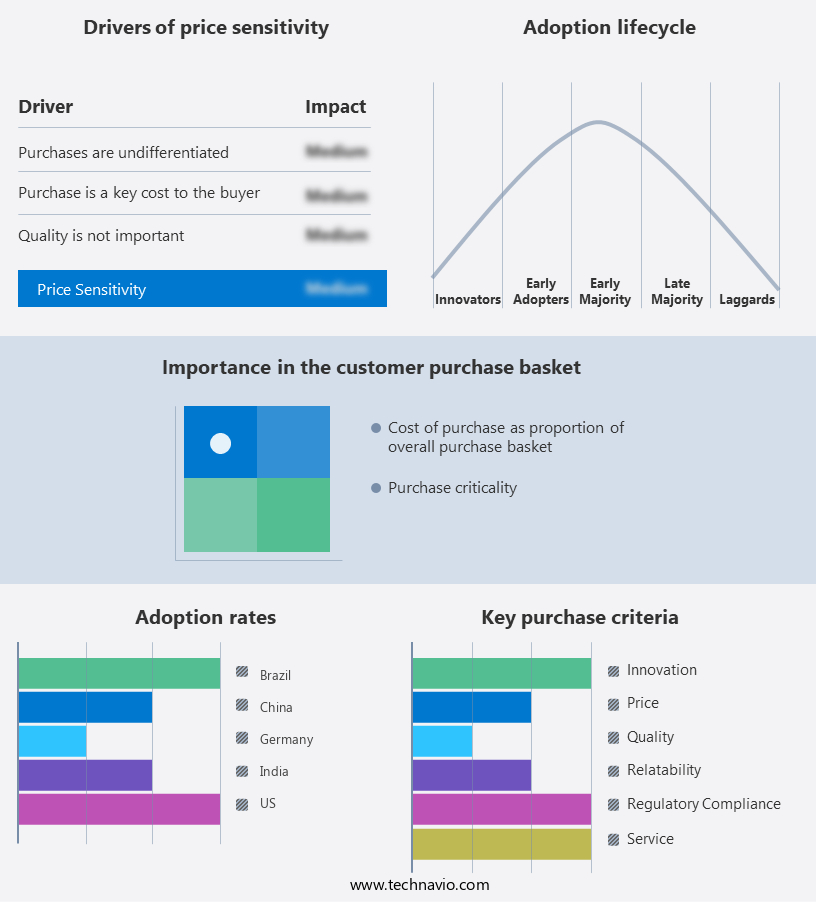
The market forecasting report includes the adoption lifecycle of the market, covering from the innovator's stage to the laggard's stage. It focuses on adoption rates in different regions based on penetration. Furthermore, the report also includes key purchase criteria and drivers of price sensitivity to help companies evaluate and develop their market growth analysis strategies.

Specialty Silica Market Share by Geography

 Customer Landscape

Key Companies & Market Insights

Companies are implementing various strategies, such as strategic alliances, partnerships, mergers and acquisitions, geographical expansion, and product/service launches, to enhance their presence in the market.

Antenchem - The company offers synthetic sodium silicate, specialized zeolite powder, and other performance materials for the chemical, petroleum, catalysts, and adsorbents markets.

The market research and growth report includes detailed analyses of the competitive landscape of the market and information about key companies, including:

  • Cabot Corp.
  • Denka Co. Ltd.
  • Ecolab Inc.
  • Elkem ASA
  • Evonik Industries AG
  • Fuji Silysia Chemical Ltd.
  • Fuso Chemical Co. Ltd.
  • Glassven C.A.
  • Gujarat Multi Gas Base Chemicals Pvt. Ltd.
  • Madhu Silica Pvt. Ltd.
  • Nouryon
  • Oriental Silicas Corp.
  • PPG Industries Inc.
  • Q Group Holdings Inc.
  • Sinosi Group Corp.
  • Solvay SA
  • Tosoh Silica Corp.
  • W. R. Grace and Co.
  • Wacker Chemie AG

Qualitative and quantitative analysis of companies has been conducted to help clients understand the wider business environment as well as the strengths and weaknesses of key market players. Data is qualitatively analyzed to categorize companies as pure play, category-focused, industry-focused, and diversified; it is quantitatively analyzed to categorize companies as dominant, leading, strong, tentative, and weak.

Research Analyst Overview

The market is witnessing significant growth due to its extensive applications in various industries. Silica, in its different forms such as precipitated, fused, silica gel, and colloidal silica, plays a crucial role in enhancing the performance and functionality of products in multiple sectors. In the rubber industry, silica is used as a reinforcing filler, improving the durability and strength of tires for automotive vehicles, as well as in the tire sector for fuel-saving and green tires. In the paints and coatings industry, silica acts as a rheology modifier, providing excellent dispersion and suspension properties, resulting in superior paint and coating performance. The construction sector also utilizes silica in the production of PVC sheets and optical parts, contributing to the growth of the market.

Moreover, the electric vehicle (EV) production sector is experiencing a wave, leading to increased demand for silica in the manufacturing of batteries and semiconductors. Silica's use in agrochemicals, oral care, desiccants, and pharmaceuticals further broadens its application base. Despite the challenges posed by factory closures and the expensive nature of some silica products, innovative substitutes and the push for sustainability are driving the market forward. The House Democratic initiative, "Build Back Better," highlights the importance of affordable housing and infrastructure development, which could potentially increase the demand for silica in these sectors.

Market Scope

Report Coverage

Details

Page number

187

Base year

2023

Historic period

2018-2022

Forecast period

2024-2028

Growth momentum & CAGR

Accelerate at a CAGR of 8.22%

Market growth 2024-2028

USD 5.37 billion

Market structure

Fragmented

YoY growth 2023-2024(%)

7.43

Regional analysis

APAC, Europe, North America, South America, and Middle East and Africa

Performing market contribution

APAC at 52%

Key countries

China, US, India, Germany, and Brazil

Competitive landscape

Leading Companies, Market Positioning of Companies, Competitive Strategies, and Industry Risks

Key companies profiled

Antenchem, Cabot Corp., Denka Co. Ltd., Ecolab Inc., Elkem ASA, Evonik Industries AG, Fuji Silysia Chemical Ltd., Fuso Chemical Co. Ltd., Glassven C.A., Gujarat Multi Gas Base Chemicals Pvt. Ltd., Madhu Silica Pvt. Ltd., Nouryon, Oriental Silicas Corp., PPG Industries Inc., Q Group Holdings Inc., Sinosi Group Corp., Solvay SA, Tosoh Silica Corp., W. R. Grace and Co., and Wacker Chemie AG

Market dynamics

Parent market analysis, market growth inducers and obstacles, market forecast, fast-growing and slow-growing segment analysis, COVID-19 impact and recovery analysis and future consumer dynamics, market condition analysis for the forecast period

Customization purview

If our market report has not included the data that you are looking for, you can reach out to our analysts and get segments customized.

Request Free Sample

What are the Key Data Covered in this Market Research and Growth Report?

  • CAGR of the market during the forecast period
  • Detailed information on factors that will drive the market growth and forecasting between 2024 and 2028
  • Precise estimation of the size of the market  and its contribution of the market in focus to the parent market
  • Accurate predictions about upcoming market growth and trends and changes in consumer behaviour
  • Growth of the market across APAC, Europe, North America, South America, and Middle East and Africa
  • Thorough analysis of the market's competitive landscape and detailed information about companies
  • Comprehensive analysis of factors that will challenge the growth of market companies

We can help! Our analysts can customize this market research report to meet your requirements. Get in touch

1 Executive Summary

  • 1.1 Market overview
    • Executive Summary - Chart on Market Overview
    • Executive Summary - Data Table on Market Overview
    • Executive Summary - Chart on Global Market Characteristics
    • Executive Summary - Chart on Market by Geography
    • Executive Summary - Chart on Market Segmentation by Application
    • Executive Summary - Chart on Market Segmentation by Type
    • Executive Summary - Chart on Incremental Growth
    • Executive Summary - Data Table on Incremental Growth
    • Executive Summary - Chart on Company Market Positioning

2 Market Landscape

  • 2.1 Market ecosystem
    • Parent Market
    • Data Table on - Parent Market
  • 2.2 Market characteristics
    • Market characteristics analysis
  • 2.3 Value chain analysis
    • Value Chain Analysis

3 Market Sizing

  • 3.1 Market definition
    • Offerings of companies included in the market definition
  • 3.2 Market segment analysis
    • Market segments
  • 3.3 Market size 2023
    • 3.4 Market outlook: Forecast for 2023-2028
      • Chart on Global - Market size and forecast 2023-2028 ($ million)
      • Data Table on Global - Market size and forecast 2023-2028 ($ million)
      • Chart on Global Market: Year-over-year growth 2023-2028 (%)
      • Data Table on Global Market: Year-over-year growth 2023-2028 (%)

    4 Historic Market Size

    • 4.1 Global Specialty Silica Market 2018 - 2022
      • Historic Market Size - Data Table on Global Specialty Silica Market 2018 - 2022 ($ million)
    • 4.2 Application segment analysis 2018 - 2022
      • Historic Market Size - Application Segment 2018 - 2022 ($ million)
    • 4.3 Type segment analysis 2018 - 2022
      • Historic Market Size - Type Segment 2018 - 2022 ($ million)
    • 4.4 Geography segment analysis 2018 - 2022
      • Historic Market Size - Geography Segment 2018 - 2022 ($ million)
    • 4.5 Country segment analysis 2018 - 2022
      • Historic Market Size - Country Segment 2018 - 2022 ($ million)

    5 Five Forces Analysis

    • 5.1 Five forces summary
      • Five forces analysis - Comparison between 2023 and 2028
    • 5.2 Bargaining power of buyers
      • Bargaining power of buyers - Impact of key factors 2023 and 2028
    • 5.3 Bargaining power of suppliers
      • Bargaining power of suppliers - Impact of key factors in 2023 and 2028
    • 5.4 Threat of new entrants
      • Threat of new entrants - Impact of key factors in 2023 and 2028
    • 5.5 Threat of substitutes
      • Threat of substitutes - Impact of key factors in 2023 and 2028
    • 5.6 Threat of rivalry
      • Threat of rivalry - Impact of key factors in 2023 and 2028
    • 5.7 Market condition
      • Chart on Market condition - Five forces 2023 and 2028

    6 Market Segmentation by Application

    • 6.1 Market segments
      • Chart on Application - Market share 2023-2028 (%)
      • Data Table on Application - Market share 2023-2028 (%)
    • 6.2 Comparison by Application
      • Chart on Comparison by Application
      • Data Table on Comparison by Application
    • 6.3 Rubber - Market size and forecast 2023-2028
      • Chart on Rubber - Market size and forecast 2023-2028 ($ million)
      • Data Table on Rubber - Market size and forecast 2023-2028 ($ million)
      • Chart on Rubber - Year-over-year growth 2023-2028 (%)
      • Data Table on Rubber - Year-over-year growth 2023-2028 (%)
    • 6.4 Personal care - Market size and forecast 2023-2028
      • Chart on Personal care - Market size and forecast 2023-2028 ($ million)
      • Data Table on Personal care - Market size and forecast 2023-2028 ($ million)
      • Chart on Personal care - Year-over-year growth 2023-2028 (%)
      • Data Table on Personal care - Year-over-year growth 2023-2028 (%)
    • 6.5 Food feed and agriculture - Market size and forecast 2023-2028
      • Chart on Food feed and agriculture - Market size and forecast 2023-2028 ($ million)
      • Data Table on Food feed and agriculture - Market size and forecast 2023-2028 ($ million)
      • Chart on Food feed and agriculture - Year-over-year growth 2023-2028 (%)
      • Data Table on Food feed and agriculture - Year-over-year growth 2023-2028 (%)
    • 6.6 Inks paints and coatings - Market size and forecast 2023-2028
      • Chart on Inks paints and coatings - Market size and forecast 2023-2028 ($ million)
      • Data Table on Inks paints and coatings - Market size and forecast 2023-2028 ($ million)
      • Chart on Inks paints and coatings - Year-over-year growth 2023-2028 (%)
      • Data Table on Inks paints and coatings - Year-over-year growth 2023-2028 (%)
    • 6.7 Others - Market size and forecast 2023-2028
      • Chart on Others - Market size and forecast 2023-2028 ($ million)
      • Data Table on Others - Market size and forecast 2023-2028 ($ million)
      • Chart on Others - Year-over-year growth 2023-2028 (%)
      • Data Table on Others - Year-over-year growth 2023-2028 (%)
    • 6.8 Market opportunity by Application
      • Market opportunity by Application ($ million)
      • Data Table on Market opportunity by Application ($ million)

    7 Market Segmentation by Type

    • 7.1 Market segments
      • Chart on Type - Market share 2023-2028 (%)
      • Data Table on Type - Market share 2023-2028 (%)
    • 7.2 Comparison by Type
      • Chart on Comparison by Type
      • Data Table on Comparison by Type
    • 7.3 Precipitated silica - Market size and forecast 2023-2028
      • Chart on Precipitated silica - Market size and forecast 2023-2028 ($ million)
      • Data Table on Precipitated silica - Market size and forecast 2023-2028 ($ million)
      • Chart on Precipitated silica - Year-over-year growth 2023-2028 (%)
      • Data Table on Precipitated silica - Year-over-year growth 2023-2028 (%)
    • 7.4 Fumed silica - Market size and forecast 2023-2028
      • Chart on Fumed silica - Market size and forecast 2023-2028 ($ million)
      • Data Table on Fumed silica - Market size and forecast 2023-2028 ($ million)
      • Chart on Fumed silica - Year-over-year growth 2023-2028 (%)
      • Data Table on Fumed silica - Year-over-year growth 2023-2028 (%)
    • 7.5 Colloidal silica - Market size and forecast 2023-2028
      • Chart on Colloidal silica - Market size and forecast 2023-2028 ($ million)
      • Data Table on Colloidal silica - Market size and forecast 2023-2028 ($ million)
      • Chart on Colloidal silica - Year-over-year growth 2023-2028 (%)
      • Data Table on Colloidal silica - Year-over-year growth 2023-2028 (%)
    • 7.6 Silica gel - Market size and forecast 2023-2028
      • Chart on Silica gel - Market size and forecast 2023-2028 ($ million)
      • Data Table on Silica gel - Market size and forecast 2023-2028 ($ million)
      • Chart on Silica gel - Year-over-year growth 2023-2028 (%)
      • Data Table on Silica gel - Year-over-year growth 2023-2028 (%)
    • 7.7 Fused silica - Market size and forecast 2023-2028
      • Chart on Fused silica - Market size and forecast 2023-2028 ($ million)
      • Data Table on Fused silica - Market size and forecast 2023-2028 ($ million)
      • Chart on Fused silica - Year-over-year growth 2023-2028 (%)
      • Data Table on Fused silica - Year-over-year growth 2023-2028 (%)
    • 7.8 Market opportunity by Type
      • Market opportunity by Type ($ million)
      • Data Table on Market opportunity by Type ($ million)

    8 Customer Landscape

    • 8.1 Customer landscape overview
      • Analysis of price sensitivity, lifecycle, customer purchase basket, adoption rates, and purchase criteria

    9 Geographic Landscape

    • 9.1 Geographic segmentation
      • Chart on Market share by geography 2023-2028 (%)
      • Data Table on Market share by geography 2023-2028 (%)
    • 9.2 Geographic comparison
      • Chart on Geographic comparison
      • Data Table on Geographic comparison
    • 9.3 APAC - Market size and forecast 2023-2028
      • Chart on APAC - Market size and forecast 2023-2028 ($ million)
      • Data Table on APAC - Market size and forecast 2023-2028 ($ million)
      • Chart on APAC - Year-over-year growth 2023-2028 (%)
      • Data Table on APAC - Year-over-year growth 2023-2028 (%)
    • 9.4 Europe - Market size and forecast 2023-2028
      • Chart on Europe - Market size and forecast 2023-2028 ($ million)
      • Data Table on Europe - Market size and forecast 2023-2028 ($ million)
      • Chart on Europe - Year-over-year growth 2023-2028 (%)
      • Data Table on Europe - Year-over-year growth 2023-2028 (%)
    • 9.5 North America - Market size and forecast 2023-2028
      • Chart on North America - Market size and forecast 2023-2028 ($ million)
      • Data Table on North America - Market size and forecast 2023-2028 ($ million)
      • Chart on North America - Year-over-year growth 2023-2028 (%)
      • Data Table on North America - Year-over-year growth 2023-2028 (%)
    • 9.6 South America - Market size and forecast 2023-2028
      • Chart on South America - Market size and forecast 2023-2028 ($ million)
      • Data Table on South America - Market size and forecast 2023-2028 ($ million)
      • Chart on South America - Year-over-year growth 2023-2028 (%)
      • Data Table on South America - Year-over-year growth 2023-2028 (%)
    • 9.7 Middle East and Africa - Market size and forecast 2023-2028
      • Chart on Middle East and Africa - Market size and forecast 2023-2028 ($ million)
      • Data Table on Middle East and Africa - Market size and forecast 2023-2028 ($ million)
      • Chart on Middle East and Africa - Year-over-year growth 2023-2028 (%)
      • Data Table on Middle East and Africa - Year-over-year growth 2023-2028 (%)
    • 9.8 China - Market size and forecast 2023-2028
      • Chart on China - Market size and forecast 2023-2028 ($ million)
      • Data Table on China - Market size and forecast 2023-2028 ($ million)
      • Chart on China - Year-over-year growth 2023-2028 (%)
      • Data Table on China - Year-over-year growth 2023-2028 (%)
    • 9.9 US - Market size and forecast 2023-2028
      • Chart on US - Market size and forecast 2023-2028 ($ million)
      • Data Table on US - Market size and forecast 2023-2028 ($ million)
      • Chart on US - Year-over-year growth 2023-2028 (%)
      • Data Table on US - Year-over-year growth 2023-2028 (%)
    • 9.10 India - Market size and forecast 2023-2028
      • Chart on India - Market size and forecast 2023-2028 ($ million)
      • Data Table on India - Market size and forecast 2023-2028 ($ million)
      • Chart on India - Year-over-year growth 2023-2028 (%)
      • Data Table on India - Year-over-year growth 2023-2028 (%)
    • 9.11 Germany - Market size and forecast 2023-2028
      • Chart on Germany - Market size and forecast 2023-2028 ($ million)
      • Data Table on Germany - Market size and forecast 2023-2028 ($ million)
      • Chart on Germany - Year-over-year growth 2023-2028 (%)
      • Data Table on Germany - Year-over-year growth 2023-2028 (%)
    • 9.12 Brazil - Market size and forecast 2023-2028
      • Chart on Brazil - Market size and forecast 2023-2028 ($ million)
      • Data Table on Brazil - Market size and forecast 2023-2028 ($ million)
      • Chart on Brazil - Year-over-year growth 2023-2028 (%)
      • Data Table on Brazil - Year-over-year growth 2023-2028 (%)
    • 9.13 Market opportunity by geography
      • Market opportunity by geography ($ million)
      • Data Tables on Market opportunity by geography ($ million)

    10 Drivers, Challenges, and Opportunity/Restraints

    • 10.1 Market drivers
      • 10.2 Market challenges
        • 10.3 Impact of drivers and challenges
          • Impact of drivers and challenges in 2023 and 2028
        • 10.4 Market opportunities/restraints

          11 Competitive Landscape

          • 11.1 Overview
            • 11.2 Competitive Landscape
              • Overview on criticality of inputs and factors of differentiation
            • 11.3 Landscape disruption
              • Overview on factors of disruption
            • 11.4 Industry risks
              • Impact of key risks on business

            12 Competitive Analysis

            • 12.1 Companies profiled
              • Companies covered
            • 12.2 Market positioning of companies
              • Matrix on companies position and classification
            • 12.3 Antenchem
              • Antenchem - Overview
              • Antenchem - Product / Service
              • Antenchem - Key offerings
            • 12.4 Cabot Corp.
              • Cabot Corp. - Overview
              • Cabot Corp. - Business segments
              • Cabot Corp. - Key news
              • Cabot Corp. - Key offerings
              • Cabot Corp. - Segment focus
            • 12.5 Evonik Industries AG
              • Evonik Industries AG - Overview
              • Evonik Industries AG - Business segments
              • Evonik Industries AG - Key news
              • Evonik Industries AG - Key offerings
              • Evonik Industries AG - Segment focus
            • 12.6 Fuji Silysia Chemical Ltd.
              • Fuji Silysia Chemical Ltd. - Overview
              • Fuji Silysia Chemical Ltd. - Product / Service
              • Fuji Silysia Chemical Ltd. - Key offerings
            • 12.7 Gujarat Multi Gas Base Chemicals Pvt. Ltd.
              • Gujarat Multi Gas Base Chemicals Pvt. Ltd. - Overview
              • Gujarat Multi Gas Base Chemicals Pvt. Ltd. - Product / Service
              • Gujarat Multi Gas Base Chemicals Pvt. Ltd. - Key offerings
            • 12.8 Madhu Silica Pvt. Ltd.
              • Madhu Silica Pvt. Ltd. - Overview
              • Madhu Silica Pvt. Ltd. - Product / Service
              • Madhu Silica Pvt. Ltd. - Key offerings
            • 12.9 Nouryon
              • Nouryon - Overview
              • Nouryon - Product / Service
              • Nouryon - Key offerings
            • 12.10 Oriental Silicas Corp.
              • Oriental Silicas Corp. - Overview
              • Oriental Silicas Corp. - Product / Service
              • Oriental Silicas Corp. - Key offerings
            • 12.11 PPG Industries Inc.
              • PPG Industries Inc. - Overview
              • PPG Industries Inc. - Business segments
              • PPG Industries Inc. - Key news
              • PPG Industries Inc. - Key offerings
              • PPG Industries Inc. - Segment focus
            • 12.12 Q Group Holdings Inc.
              • Q Group Holdings Inc. - Overview
              • Q Group Holdings Inc. - Product / Service
              • Q Group Holdings Inc. - Key news
              • Q Group Holdings Inc. - Key offerings
            • 12.13 Sinosi Group Corp.
              • Sinosi Group Corp. - Overview
              • Sinosi Group Corp. - Product / Service
              • Sinosi Group Corp. - Key offerings
            • 12.14 Solvay SA
              • Solvay SA - Overview
              • Solvay SA - Business segments
              • Solvay SA - Key news
              • Solvay SA - Key offerings
              • Solvay SA - Segment focus
            • 12.15 Tosoh Silica Corp.
              • Tosoh Silica Corp. - Overview
              • Tosoh Silica Corp. - Product / Service
              • Tosoh Silica Corp. - Key offerings
            • 12.16 W. R. Grace and Co.
              • W. R. Grace and Co. - Overview
              • W. R. Grace and Co. - Product / Service
              • W. R. Grace and Co. - Key offerings
            • 12.17 Wacker Chemie AG
              • Wacker Chemie AG - Overview
              • Wacker Chemie AG - Business segments
              • Wacker Chemie AG - Key news
              • Wacker Chemie AG - Key offerings
              • Wacker Chemie AG - Segment focus

            13 Appendix

            • 13.1 Scope of the report
              • 13.2 Inclusions and exclusions checklist
                • Inclusions checklist
                • Exclusions checklist
              • 13.3 Currency conversion rates for US$
                • Currency conversion rates for US$
              • 13.4 Research methodology
                • Research methodology
              • 13.5 Data procurement
                • Information sources
              • 13.6 Data validation
                • Data validation
              • 13.7 Validation techniques employed for market sizing
                • Validation techniques employed for market sizing
              • 13.8 Data synthesis
                • Data synthesis
              • 360 degree market analysis
                • 360 degree market analysis
              • 13.10 List of abbreviations
                • List of abbreviations

              Research Methodology

              Technavio presents a detailed picture of the market by way of study, synthesis, and summation of data from multiple sources. The analysts have presented the various facets of the market with a particular focus on identifying the key industry influencers. The data thus presented is comprehensive, reliable, and the result of extensive research, both primary and secondary.

              INFORMATION SOURCES

              Primary sources

              • Manufacturers and suppliers
              • Channel partners
              • Industry experts
              • Strategic decision makers

              Secondary sources

              • Industry journals and periodicals
              • Government data
              • Financial reports of key industry players
              • Historical data
              • Press releases

              DATA ANALYSIS

              Data Synthesis

              • Collation of data
              • Estimation of key figures
              • Analysis of derived insights

              Data Validation

              • Triangulation with data models
              • Reference against proprietary databases
              • Corroboration with industry experts

              REPORT WRITING

              Qualitative

              • Market drivers
              • Market challenges
              • Market trends
              • Five forces analysis

              Quantitative

              • Market size and forecast
              • Market segmentation
              • Geographical insights
              • Competitive landscape

              Interested in this report?

              Get your sample now to see our research methodology and insights!

              Download Now

              Frequently Asked Questions

              Specialty Silica market growth will increase by $ 5366.6 mn during 2024-2028.

              The Specialty Silica market is expected to grow at a CAGR of 8.22% during 2024-2028.

              Specialty Silica market is segmented by Application( Rubber, Personal care, Food feed and agriculture, Inks paints and coatings, Others) Type( Precipitated silica, Fumed silica, Colloidal silica, Silica gel, Fused silica)

              Antenchem, Cabot Corp., Denka Co. Ltd., Ecolab Inc., Elkem ASA, Evonik Industries AG, Fuji Silysia Chemical Ltd., Fuso Chemical Co. Ltd., Glassven C.A., Gujarat Multi Gas Base Chemicals Pvt. Ltd., Madhu Silica Pvt. Ltd., Nouryon, Oriental Silicas Corp., PPG Industries Inc., Q Group Holdings Inc., Sinosi Group Corp., Solvay SA, Tosoh Silica Corp., W. R. Grace and Co., Wacker Chemie AG are a few of the key vendors in the Specialty Silica market.

              APAC will register the highest growth rate of 52% among the other regions. Therefore, the Specialty Silica market in APAC is expected to garner significant business opportunities for the vendors during the forecast period.

              China, US, India, Germany, Brazil

              • Growing applications of precipitated silica in food industrySilica and silica-based products are widely used in food products. Its main applications in this field include the following: Anti-caking and free-flowing agents: Silica products act as anti-caking and free-flowing agents is the driving factor this market.
              • which are used to coat the host powder to reduce inter-particle interactions. When the excess liquids is the driving factor this market.
              • oils is the driving factor this market.
              • and fats are absorbed is the driving factor this market.
              • the non-aqueous binding of powder elements is prevented. Liquid absorption (carriers): Silica carrier agents can absorb considerable amounts of liquid while being free-flowing with their powder-like features. Handling highly viscous or highly reactive products can be made easy with these agents. The silica carrier product first absorbs the liquid into the carrier. After that is the driving factor this market.
              • when the product is put in an aqueous system is the driving factor this market.
              • the liquid that was carried out is let out and can be activated. Process made easier: The use of specialty silica in food applications helps make the manufacturing process easier and enhances the speed of the entire procedure by preventing powders from sticking and accumulating. Specialty silica also ensures smooth flow. is the driving factor this market.

              The Specialty Silica market vendors should focus on grabbing business opportunities from the Rubber segment as it accounted for the largest market share in the base year.