
Spinal Trauma Devices Market Size and Growth Forecast 2026-2030
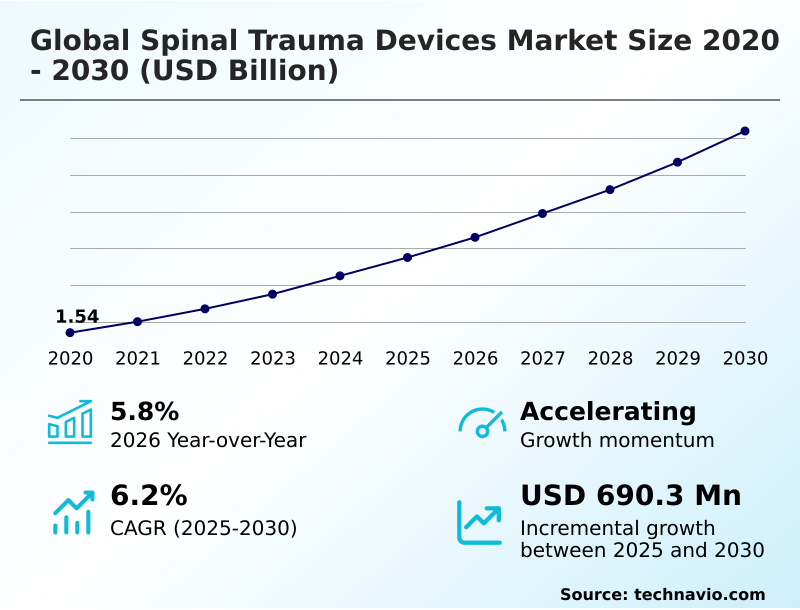
The Spinal Trauma Devices Market size was valued at USD 1.95 billion in 2025 growing at a CAGR of 6.2% during the forecast period 2026-2030.
North America accounts for 40.7% of incremental growth during the forecast period. The Internal fixation devices segment by Product was valued at USD 1.28 billion in 2024, while the Hospitals segment holds the largest revenue share by End-user.
The market is projected to grow by USD 1.10 billion from 2020 to 2030, with USD 690.3 million of the growth expected during the forecast period of 2025 to 2030.
Get Key Insights on Market Forecast (PDF) Request Free Sample
Spinal Trauma Devices Market Overview
The spinal trauma devices market is defined by a consistent demand for mechanically robust and biocompatible solutions to manage acute vertebral injuries. Growth is driven by the expanding adoption of minimally invasive surgery and technological innovation in implants, while high procedural costs and stringent regulatory approvals present challenges. In a typical scenario, a level 1 trauma center implements a new robotic-assisted surgery platform for complex thoracolumbar stabilization. This integration with spinal navigation systems allows surgeons to perform percutaneous spinal fixation with greater accuracy, reducing operative time and minimizing neurological risk. The adoption of such platforms, which leverage advanced biomaterials for spine, supports the market's year-over-year growth of 5.8%. This shift toward technology-driven precision, including the use of polyetheretherketone (PEEK) and porous titanium implants, underscores the industry's focus on improving clinical outcome analysis and patient safety in spinal trauma management.
Drivers, Trends, and Challenges in the Spinal Trauma Devices Market
The evolution of the spinal trauma devices market is increasingly shaped by the pursuit of personalized and efficient surgical solutions. The benefits of 3D-printed patient-specific spinal implants are a clear example, as they offer anatomical conformity that traditional implants cannot match, a factor driving their adoption in complex reconstructive surgeries.
An operational scenario within a specialized orthopedic hospital involves using AI-driven software for integration of AI in pre-operative surgical planning for spine, which allows surgeons to simulate procedures and select optimal implants, thereby improving the long-term durability of carbon-fiber spinal implants.
This level of customization is mirrored in material science, where the impact of PEEK-OPTIMA polymers on implant design has enabled radiolucent devices with modulus closer to bone. Concurrently, the clinical outcomes of bioabsorbable materials in spinal fixation are being closely evaluated under frameworks like the EU's Medical Device Regulation (MDR), addressing the need to eliminate secondary removal surgeries.
The cost-effectiveness of robotic-assisted pedicle screw placement, which can be more than 10% more accurate than freehand techniques, is a key consideration for hospital procurement teams balancing capital expenditure with improved patient safety and reduced revision rates.
These advancements, however, face challenges in regulatory approval for novel spinal devices, a process that can delay market entry but is essential for ensuring patient safety.
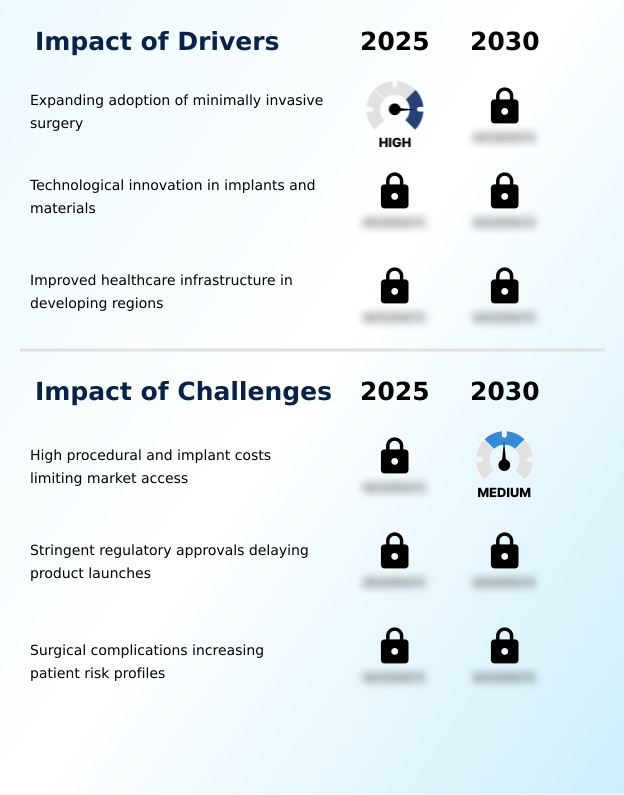
Primary Growth Driver: The expanding adoption of minimally invasive surgery is a key driver, reflecting a paradigm shift toward techniques that reduce patient trauma and improve recovery outcomes.
Growth in the spinal trauma devices market is primarily propelled by the widespread adoption of minimally invasive spinal surgery (MISS).
This approach significantly reduces patient recovery time and hospital stays, aligning with healthcare system goals for cost efficiency and improved patient outcomes.
The efficacy of MISS is enhanced by enabling technologies such as robotic-assisted surgery and advanced spinal navigation systems, which improve the precision of implant placement.
Innovations in material science are also a key driver, with new biomaterials promoting better osseointegration enhancement and long-term implant stability. The shift of procedures to outpatient settings is boosting ambulatory surgery center (ASC) adoption.
This expansion is supported by targeted surgeon training and simulation, ensuring safe and effective implementation of new techniques. North America remains a significant driver, contributing to 40.7% of the market's incremental growth.
Emerging Market Trend: A prominent market trend involves the surge in minimally invasive spinal procedures. This shift is reshaping treatment paradigms and influencing device demand.
Innovation in spinal trauma devices is rapidly advancing beyond traditional mechanical fixation. The adoption of 3D-printed spinal implants enables patient-specific implant design, offering superior anatomical fit and improved stability, particularly in complex trauma cases. This trend is complemented by the development of expandable cage technology, which allows surgeons to restore vertebral height through minimally invasive corridors.
Furthermore, there is a significant shift toward next-generation materials, including bioresorbable polymers, which eliminate the need for secondary removal surgeries. The integration of smart implant sensors is on the horizon, promising real-time data on fusion progress and mechanical load, enabling personalized post-operative care.
This focus on intelligent and customized solutions, including new motion preservation technology, is redefining the standards of care and driving market growth, with the internal fixation devices segment accounting for over 69% of the market in 2024.
Key Industry Challenge: A primary challenge affecting industry growth is the high procedural and implant costs, which limit market access and affordability for patients and healthcare providers.
Significant hurdles restrain the spinal trauma devices market, led by the rigorous and lengthy process of securing regulatory approvals. Gaining FDA 510(k) clearance in the US or conforming to the EU's Medical Device Regulation (MDR) requires extensive clinical data and significant investment, delaying the launch of innovative products.
The implementation of the Unique Device Identification (UDI) system, while beneficial for traceability, adds another layer of complexity to manufacturing and hospital procurement logistics. Furthermore, the high cost of advanced implants and associated surgical procedures creates access barriers, particularly in markets with limited reimbursement.
Payers and providers increasingly demand robust clinical outcome analysis to justify these costs, placing pressure on manufacturers to demonstrate clear value propositions beyond incremental technological improvements. These financial and regulatory pressures temper the market's growth potential.
Explore Full Market Dynamics Analysis Request Free Sample
Spinal Trauma Devices Market Segmentation
The spinal trauma devices industry research report provides comprehensive data including region-wise segment analysis, with forecasts and analysis for the period 2026-2030, as well as historical data from 2020-2024 for the following segments.
Product Segment Analysis
The internal fixation devices segment is estimated to witness significant growth during the forecast period.
The internal fixation devices segment commands the largest share of the spinal trauma devices market, driven by the clinical necessity for permanent stabilization following high-impact injuries.
These systems, including pedicle screw fixation, posterior fixation systems, and interbody fusion devices, are crucial for restoring vertebral alignment and promoting bone fusion. The segment's growth is tied to advancements in material science and surgical techniques, facilitating earlier patient mobilization.
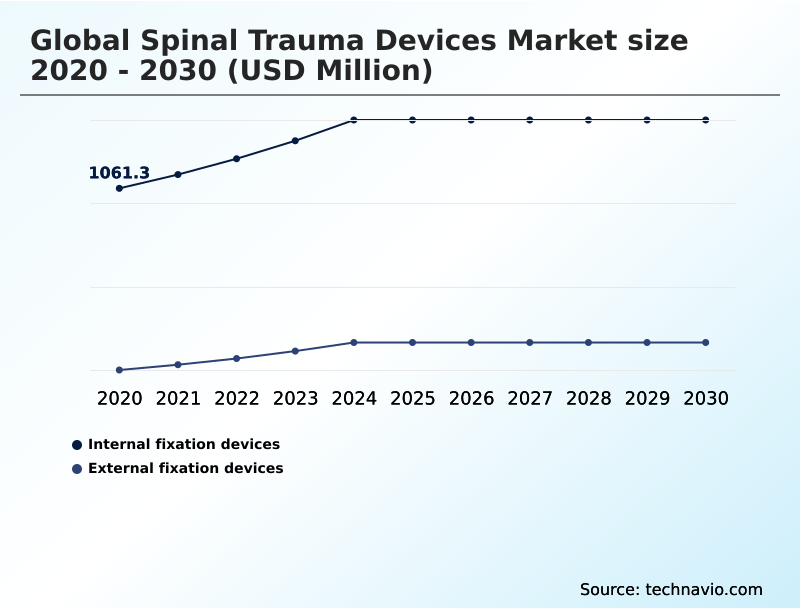
With a market size of USD 1,281.00 million in 2024, the demand for devices like spinal fusion cages for thoracolumbar stabilization and vertebral body replacement continues to expand.
The increasing adoption of minimally invasive approaches further propels innovation in specialized internal fixation hardware designed to reduce tissue damage and improve recovery outcomes.
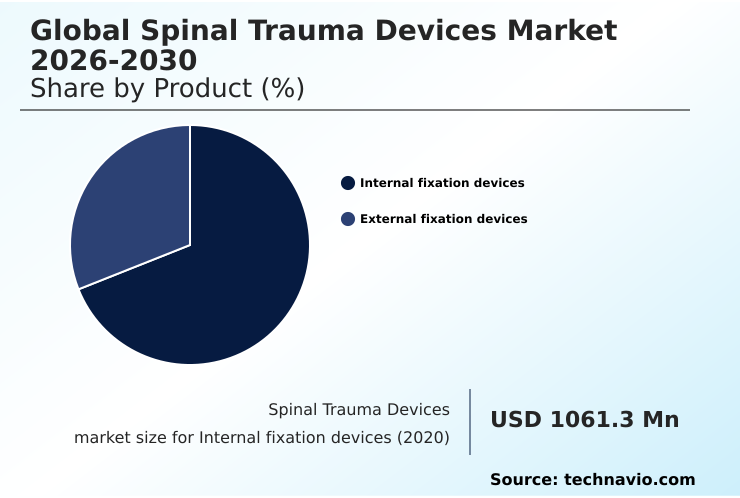
The Internal fixation devices segment was valued at USD 1.28 billion in 2024 and showed a gradual increase during the forecast period.
Spinal Trauma Devices Market by Region: North America Leads with 40.7% Growth Share
North America is estimated to contribute 40.7% to the growth of the global market during the forecast period.
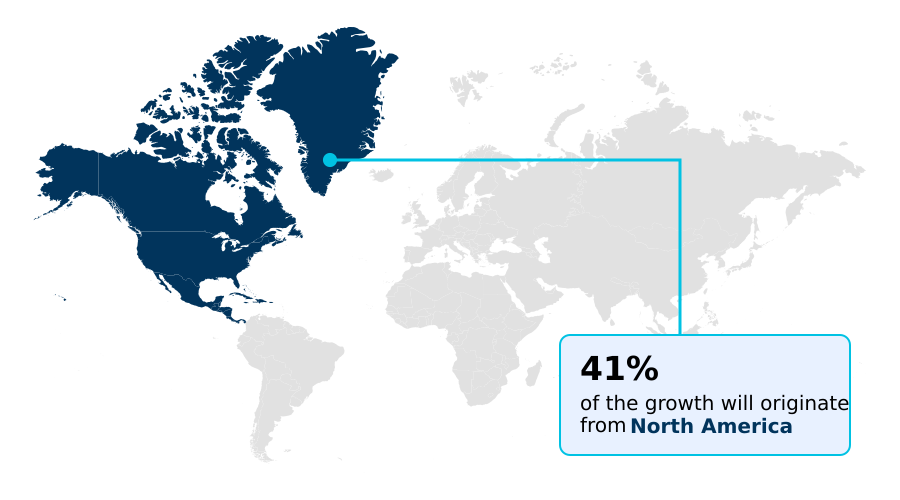
North America leads the spinal trauma devices market, contributing over 40% of the incremental growth, driven by advanced healthcare infrastructure and high adoption of sophisticated technologies.
The region's focus on traumatic spinal cord injury (tSCI) management in specialized centers, coupled with favorable reimbursement policies, supports the use of premium devices.
In contrast, Asia is the fastest-growing region, with improving healthcare access in countries like China and India fueling demand. The rising prevalence of osteoporotic fracture treatment and the adoption of procedures like kyphoplasty systems are common across developed markets.
Adherence to stringent standards, such as FDA 510(k) clearance in the US and the Medical Device Regulation (MDR) in Europe, governs market access, influencing pre-operative surgical planning and device selection worldwide.
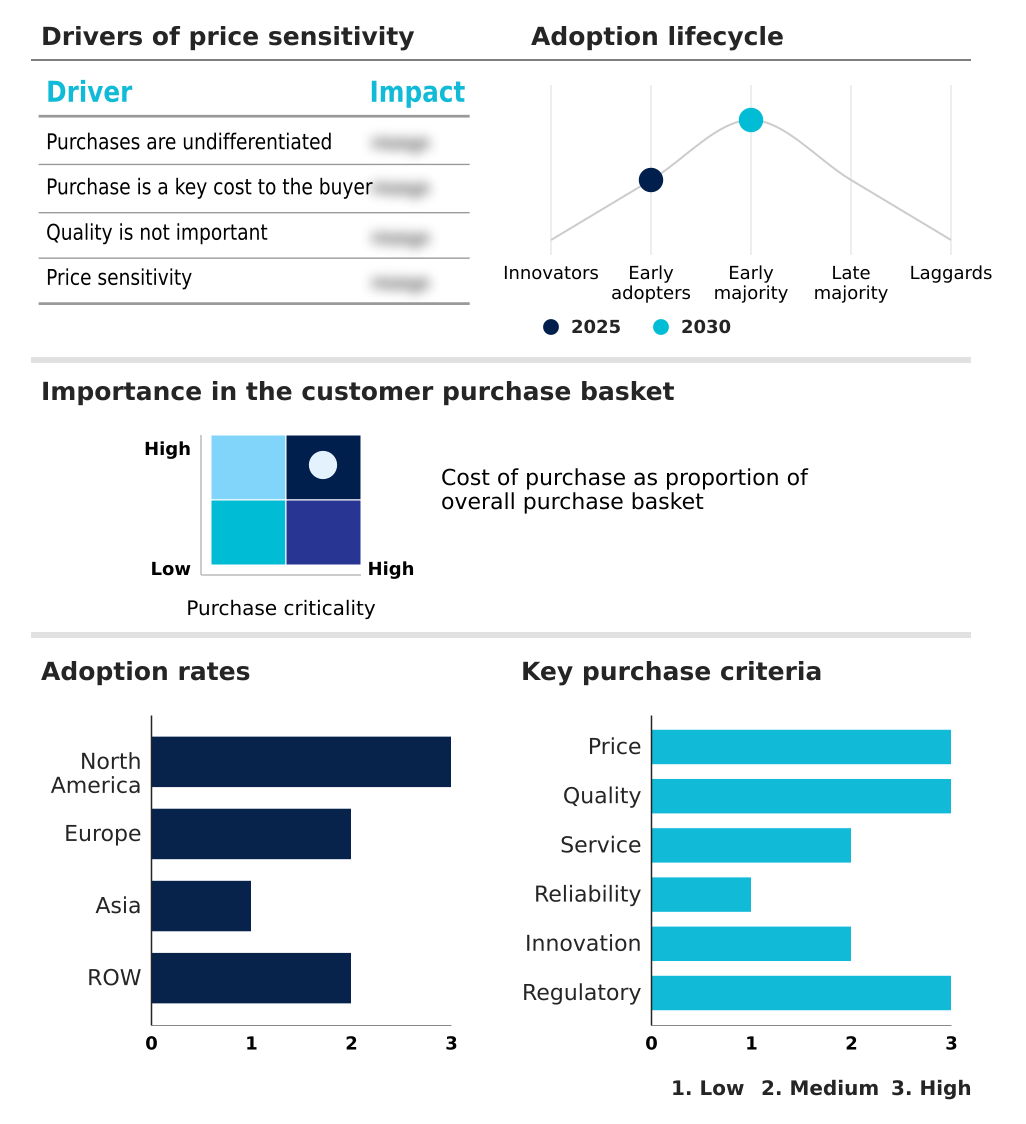
Customer Landscape Analysis for the Spinal Trauma Devices Market
The spinal trauma devices market forecasting report includes the adoption lifecycle of the market, covering from the innovator’s stage to the laggard’s stage. It focuses on adoption rates in different regions based on penetration. Furthermore, the spinal trauma devices market report also includes key purchase criteria and drivers of price sensitivity to help companies evaluate and develop their market growth analysis strategies.
Competitive Landscape of the Spinal Trauma Devices Market
Companies are implementing various strategies, such as strategic alliances, partnerships, mergers and acquisitions, geographical expansion, and product/service launches, to enhance their presence in the spinal trauma devices market industry.
Alphatec Holdings Inc. - Offers a portfolio of spinal trauma devices, including technology platforms and products addressing degenerative and deformity spine pathologies across major market segments.
The industry research and growth report includes detailed analyses of the competitive landscape of the market and information about key companies, including:
- Alphatec Holdings Inc.
- ChoiceSpine LLC
- Genesys Orthopedic Systems LLC
- Globus Medical Inc.
- GS Solutions Inc.
- Medtronic Plc
- MicroPort Scientific Corp.
- NuVasive Inc.
- Orthofix Medical Inc.
- ReWalk Robotics Ltd.
- Smith and Nephew plc
- Spinal Technology Inc.
- Spineart SA
- Stryker Corp.
- Victrex Plc
- Xtant Medical Holdings Inc.
Qualitative and quantitative analysis of companies has been conducted to help clients understand the wider business environment as well as the strengths and weaknesses of key industry players. Data is qualitatively analyzed to categorize companies as pure play, category-focused, industry-focused, and diversified; it is quantitatively analyzed to categorize companies as dominant, leading, strong, tentative, and weak.
Recent Developments in the Spinal Trauma Devices Market
- In February 2025, Medtronic launched an enhanced posterior fixation system featuring bioactive coatings to improve outcomes for elderly patients with compromised bone density.
- In March 2025, NVIDIA and GE HealthCare formed a partnership to develop AI-driven autonomous imaging systems, aiming to improve access and efficiency in X-ray and ultrasound technologies for healthcare.
- In April 2025, Medivis Inc. secured FDA 510(k) clearance for its Spine Navigation platform, which uses augmented reality and AI to provide holographic guidance during surgical procedures.
- In April 2025, Medtronic Plc rolled out an advanced digital ecosystem that employs machine learning algorithms to optimize the placement of screws in unstable spinal fractures.
Research Analyst Overview: Spinal Trauma Devices Market
The spinal trauma devices market is undergoing a critical transition from standardized hardware to integrated procedural ecosystems. A key boardroom decision now revolves around capital investment in robotic-assisted surgery platforms, which create vendor lock-in but offer quantifiable improvements in surgical precision and clinical outcome analysis.
This shift is driven by the proven efficacy of percutaneous spinal fixation in reducing recovery times. Innovations in material science, such as the use of bioactive glass coatings and polyetheretherketone (PEEK), are enhancing osseointegration enhancement and implant longevity. For instance, the use of expandable cage technology allows for customized vertebral body support through minimal incisions.
Compliance with standards like the FDA's Unique Device Identification (UDI) system adds complexity to hospital procurement logistics but is essential for post-market surveillance. As the market exhibits a 5.8% year-over-year growth, the focus remains on technologies like 3D-printed spinal implants and spinal navigation systems that promise better patient outcomes and ultimately control long-term healthcare costs.
Dive into Technavio’s robust research methodology, blending expert interviews, extensive data synthesis, and validated models for unparalleled Spinal Trauma Devices Market insights. See full methodology.
| Market Scope | |
|---|---|
| Page number | 284 |
| Base year | 2025 |
| Historic period | 2020-2024 |
| Forecast period | 2026-2030 |
| Growth momentum & CAGR | Accelerate at a CAGR of 6.2% |
| Market growth 2026-2030 | USD 690.3 million |
| Market structure | Fragmented |
| YoY growth 2025-2026(%) | 5.8% |
| Key countries | US, Canada, Mexico, Germany, UK, France, Italy, Spain, The Netherlands, China, Japan, India, South Korea, Singapore, Malaysia, Brazil, UAE, Saudi Arabia, South Africa, Argentina, Nigeria, Colombia and Turkey |
| Competitive landscape | Leading Companies, Market Positioning of Companies, Competitive Strategies, and Industry Risks |
Spinal Trauma Devices Market: Key Questions Answered in This Report
-
What is the expected growth of the Spinal Trauma Devices Market between 2026 and 2030?
-
The Spinal Trauma Devices Market is expected to grow by USD 690.3 million during 2026-2030, registering a CAGR of 6.2%. Year-over-year growth in 2026 is estimated at 5.8%%. This acceleration is shaped by expanding adoption of minimally invasive surgery, which is intensifying demand across multiple end-use verticals covered in the report.
-
-
What segmentation does the market report cover?
-
The report is segmented by Product (Internal fixation devices, and External fixation devices), End-user (Hospitals, Ambulatory surgery centers, and Clinics), Type (Minimally invasive surgery, and Open surgery) and Geography (North America, Europe, Asia, Rest of World (ROW)). Among these, the Internal fixation devices segment is estimated to witness significant growth during the forecast period, driven by rising adoption across key application areas. Each segment includes detailed qualitative and quantitative analysis, along with historical data from 2020-2024 and forecasts through 2030 with year-over-year growth rates.
-
-
Which regions are analyzed in the report?
-
The report covers North America, Europe, Asia and Rest of World (ROW). North America is estimated to contribute 40.7% to market growth during the forecast period. Country-level analysis includes US, Canada, Mexico, Germany, UK, France, Italy, Spain, The Netherlands, China, Japan, India, South Korea, Singapore, Malaysia, Brazil, UAE, Saudi Arabia, South Africa, Argentina, Nigeria, Colombia and Turkey, with dedicated market size tables and year-over-year growth for each.
-
-
What are the key growth drivers and market challenges?
-
The primary driver is expanding adoption of minimally invasive surgery, which is accelerating investment and industry demand. The main challenge is high procedural and implant costs limiting market access, creating operational barriers for key market participants. The report quantifies the impact of each driver and challenge across 2026 and 2030 with comparative analysis.
-
-
Who are the major players in the Spinal Trauma Devices Market?
-
Key vendors include Alphatec Holdings Inc., ChoiceSpine LLC, Genesys Orthopedic Systems LLC, Globus Medical Inc., GS Solutions Inc., Medtronic Plc, MicroPort Scientific Corp., NuVasive Inc., Orthofix Medical Inc., ReWalk Robotics Ltd., Smith and Nephew plc, Spinal Technology Inc., Spineart SA, Stryker Corp., Victrex Plc and Xtant Medical Holdings Inc.. The report provides qualitative and quantitative analysis categorizing companies as dominant, leading, strong, tentative, and weak based on their market positioning. Company profiles include business segment analysis, SWOT assessment, key offerings, and recent strategic developments.
-
Spinal Trauma Devices Market Research Insights
Market dynamics are heavily influenced by the shift toward value-based healthcare, compelling providers to adopt more efficient and effective technologies. The preference for minimally invasive spinal surgery (MISS) is a direct result, driving demand for specialized instrumentation and implants that facilitate ambulatory surgery center (ASC) adoption.
This trend is supported by robust surgeon training and simulation programs, which accelerate the learning curve for complex procedures. Concurrently, advancements in advanced biomaterials for spine, including bioresorbable polymers, are addressing long-term complications associated with permanent hardware. Compliance with comprehensive regulations, such as the EU's Medical Device Regulation (MDR), ensures high standards of safety and efficacy across all product categories.
The internal fixation devices segment continues to dominate, representing over twice the market value of the external fixation devices segment in 2024, highlighting its central role in definitive trauma care.
We can help! Our analysts can customize this spinal trauma devices market research report to meet your requirements.
 RIA -
RIA - 
