Sporting Events Market Analysis, Size, and Forecast 2026-2030: Europe (Germany, UK, and France), APAC (China, Japan, and India), North America (US, Canada, and Mexico), Middle East and Africa (Saudi Arabia, UAE, and South Africa), South America (Brazil and Argentina), and Rest of World (ROW)

Sporting Events Market Analysis, Size, and Forecast 2026-2030:
Europe (Germany, UK, and France), APAC (China, Japan, and India), North America (US, Canada, and Mexico), Middle East and Africa (Saudi Arabia, UAE, and South Africa), South America (Brazil and Argentina), and Rest of World (ROW)

Published: May 2026 306 Pages SKU: IRTNTR74689

Market Overview at a Glance

$140.43 B
Market Opportunity
9.4%
CAGR 2025 - 2030
34.2%
Europe Growth
$75.96 B
Sponsorships segment 2024

Sporting Events Market Size 2026-2030

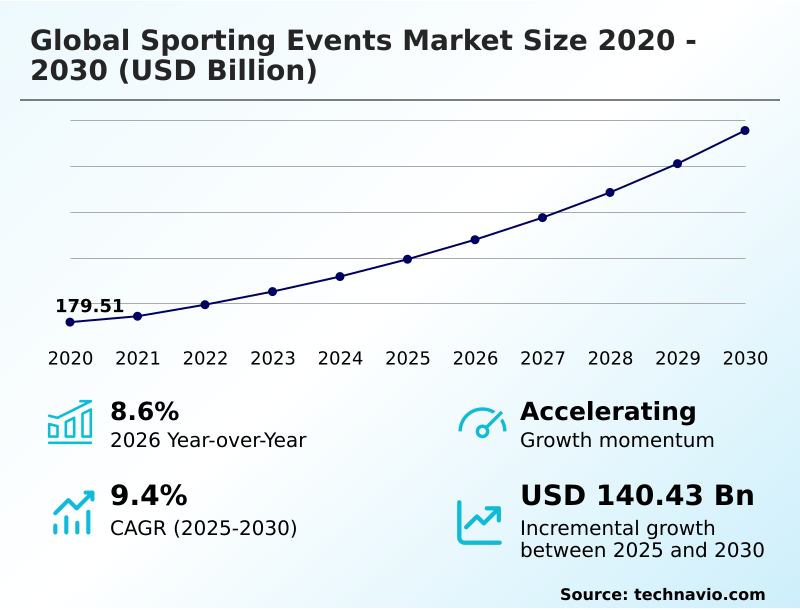
The sporting events market size is valued to increase by USD 140.43 billion, at a CAGR of 9.4% from 2025 to 2030. Increasing sports sponsorship spending will drive the sporting events market.

Major Market Trends & Insights

  • Europe dominated the market and accounted for a 34.2% growth during the forecast period.
  • By Revenue Stream - Sponsorships segment was valued at USD 75.96 billion in 2024
  • By Event Type - Soccer segment accounted for the largest market revenue share in 2024

Market Size & Forecast

  • Market Opportunities: USD 209.03 billion
  • Market Future Opportunities: USD 140.43 billion
  • CAGR from 2025 to 2030 : 9.4%

Market Summary

  • The sporting events market is undergoing a significant transformation, driven by digital innovation and evolving consumer expectations. Revenue generation is increasingly diversified beyond traditional ticket sales, with media rights negotiation and strategic sponsorship activation platforms becoming central to financial success.
  • The integration of advanced technologies like high-definition live streaming, mobile entry systems, and contactless payment systems is enhancing the spectator experience and improving operational efficiency. A key trend is the use of fan data analytics to inform personalized marketing campaigns and dynamic pricing models, maximizing attendance and engagement.
  • For instance, a major league can leverage real-time crowd analytics to optimize venue operations, managing staffing and inventory to reduce wait times and increase per-capita spending. However, the industry faces challenges, including the need for robust venue security systems and the constant battle against fraudulent ticket resale markets.
  • Success in this competitive landscape requires a focus on immersive viewing experiences and building direct-to-consumer relationships through fan loyalty programs and interactive content creation.

What will be the Size of the Sporting Events Market during the forecast period?

Get Key Insights on Market Forecast (PDF) Get Free Sample

How is the Sporting Events Market Segmented?

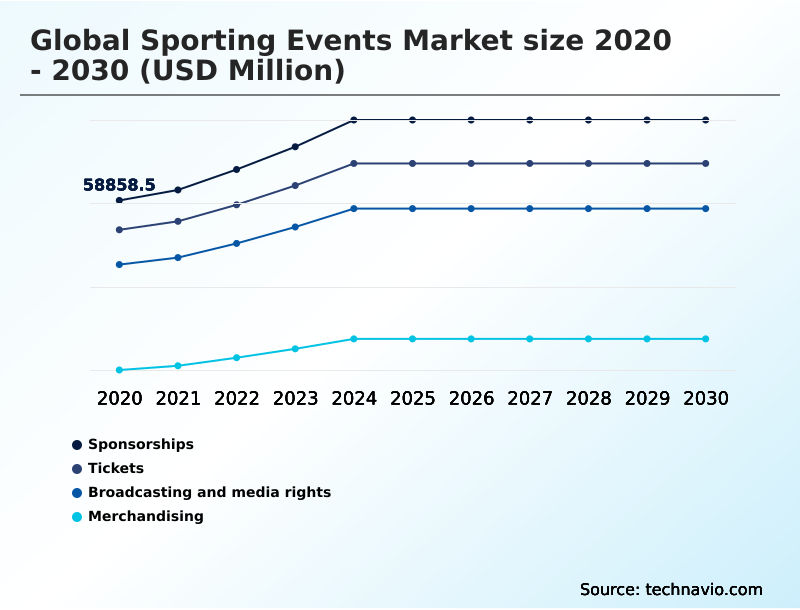
The sporting events industry research report provides comprehensive data (region-wise segment analysis), with forecasts and estimates in "USD million" for the period 2026-2030, as well as historical data from 2020-2024 for the following segments.

  • Revenue stream
    • Sponsorships
    • Tickets
    • Broadcasting and media rights
    • Merchandising
  • Event type
    • Soccer
    • Cricket
    • Tennis
    • Others
  • Type
    • Digital ticket
    • Online printable tickets
    • Paper tickets
  • Geography
    • Europe
      • Germany
      • UK
      • France
    • APAC
      • China
      • Japan
      • India
    • North America
      • US
      • Canada
      • Mexico
    • Middle East and Africa
      • Saudi Arabia
      • UAE
      • South Africa
    • South America
      • Brazil
      • Argentina
    • Rest of World (ROW)

By Revenue Stream Insights

The sponsorships segment is estimated to witness significant growth during the forecast period.

The sponsorships segment is fundamental to the financial architecture of the sporting events market. Businesses leverage partnerships with professional esports leagues and traditional sports properties to achieve brand visibility and customer engagement on a massive scale.

The evolution from static advertising to dynamic sponsorship activation platforms allows for deeper integration of marketing messages. Modern strategies include influencer marketing partnerships, interactive content creation, and digital advertising models to connect with global audiences.

Organizations utilizing data-driven sports analytics platforms to measure campaign effectiveness report up to a 15% greater ROI on sponsorship.

This shift is driven by the need for measurable outcomes, leveraging fan data analytics and personalized marketing campaigns to maximize commercial value and strengthen brand loyalty.

Get Free Sample

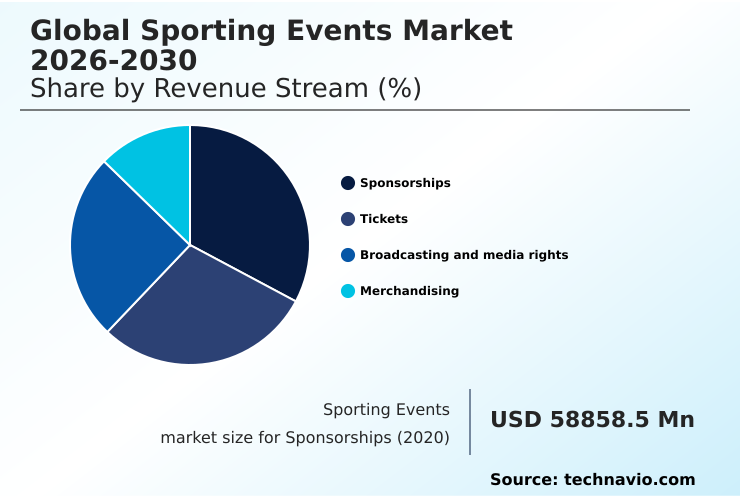
The Sponsorships segment was valued at USD 75.96 billion in 2024 and showed a gradual increase during the forecast period.

Get Free Sample

Regional Analysis

Europe is estimated to contribute 34.2% to the growth of the global market during the forecast period.Technavio’s analysts have elaborately explained the regional trends and drivers that shape the market during the forecast period.

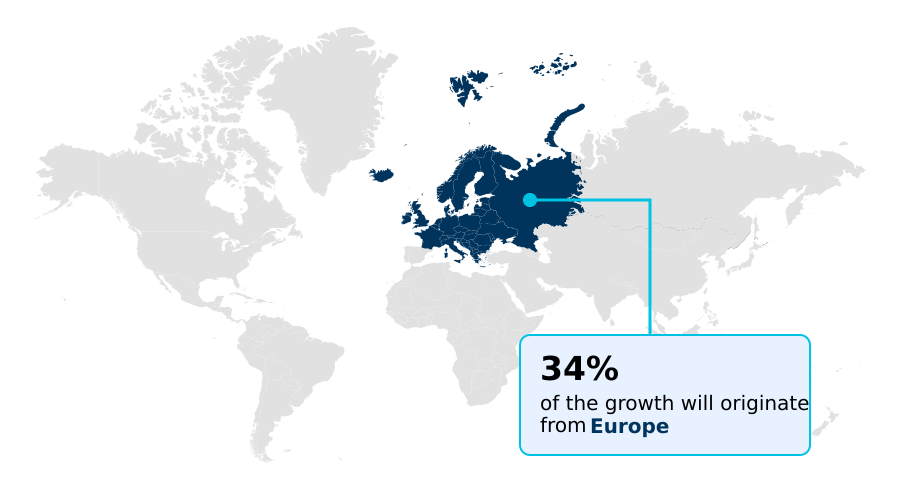
See How Sporting Events Market Demand is Rising in Europe Get Free Sample

The geographic landscape of the sporting events market is characterized by mature, high-revenue regions and rapidly emerging growth centers.

Europe remains a dominant force, contributing over 34% of the market's incremental growth, driven by its established professional leagues and sophisticated smart stadium infrastructure.

In contrast, the APAC region is expanding quickly, fueled by rising disposable incomes and government investment in sports development programs. North America maintains a strong position with its highly commercialized leagues that excel in e-commerce merchandising and sports event management.

Across all regions, the adoption of digital ticketing platforms has streamlined operations, with some venues reporting a 20% increase in entry processing speed.

This digital shift, supported by tailored sports marketing agencies, is crucial for engaging diverse global fan bases through professional athlete contracts and monetizing sports content effectively.

Market Dynamics

Our researchers analyzed the data with 2025 as the base year, along with the key drivers, trends, and challenges. A holistic analysis of drivers will help companies refine their marketing strategies to gain a competitive advantage.

  • The modern sporting events market is defined by a complex interplay of digital innovation and evolving consumer behaviors. Strategic success now hinges on mastering a diverse set of operational and technological domains. A key focus is leveraging AI for fan engagement and personalizing the fan journey digitally, which are crucial for retention in a crowded entertainment market.
  • Concurrently, organizations are optimizing stadium revenue with analytics and improving venue operations with IoT to enhance efficiency and profitability. The impact of 5G on live sports broadcasting is unlocking new immersive possibilities, while blockchain for secure sports ticketing addresses long-standing fraud issues.
  • The role of social media in sports marketing cannot be overstated, serving as a primary channel for marketing strategies for sporting events and fan communication. Effective strategies for monetizing sports content are essential, as is navigating sports media rights landscape for long-term financial health.
  • Furthermore, organizations must focus on managing cybersecurity risks in sports events to protect data and maintain trust. The industry is also shaped by macro trends such as the significant growth of women's professional sports, the meteoric rise of esports and virtual sports, and the increasing importance of sustainability practices in sporting events.
  • From data analytics for athlete performance to digital transformation of sports merchandising, the entire value chain is being re-imagined. The effective use of a mobile application for fan interaction is a clear differentiator, with some leagues seeing engagement rates more than double compared to traditional web portals.
  • Mastering these elements, including AR applications in fan experience, integrating sports betting into media, building direct-to-consumer sports platforms, understanding the commercial value of sports sponsorships, and enhancing sports tourism experiences, is paramount for market leadership.

What are the key market drivers leading to the rise in the adoption of Sporting Events Industry?

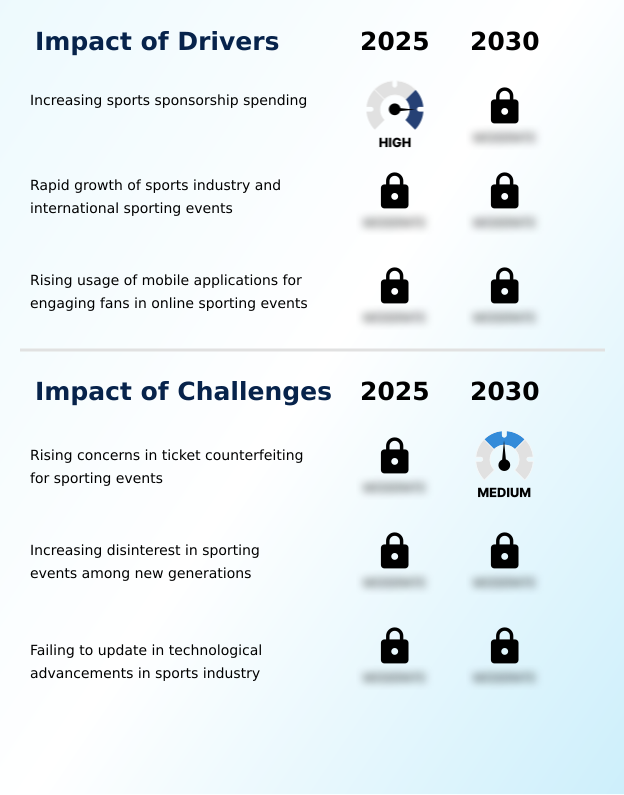
  • Increasing sports sponsorship spending is a key driver propelling the growth of the global sporting events market.

  • The sporting events market's growth is propelled by increasing commercialization and digital fan engagement. A primary driver is the rapid expansion of sports sponsorship activation platforms and media rights negotiation, which provide essential funding for event organizers.
  • The growth of the sports industry, with a notable increase in international tournaments and the rise of esports and virtual sports, broadens the audience base.
  • Concurrently, the rising usage of mobile applications for fan interaction, incorporating features like high-definition live streaming and interactive content creation, is deepening engagement.
  • Leagues that have successfully deployed personalized marketing campaigns via mobile apps report a 30% higher rate of regular interaction compared to those relying on traditional media.
  • This digital-first approach, supported by robust broadcasting technology solutions and sports data providers, is creating a more interactive and monetizable ecosystem.

What are the market trends shaping the Sporting Events Industry?

  • The high utilization of social media for branding and collaborative marketing initiatives is a prominent trend shaping the market. It is transforming fan engagement and creating new revenue streams for event organizers.

  • Key trends reshaping the sporting events market center on digital engagement and operational intelligence. The high utilization of social media engagement tools and event security services has become standard, with targeted campaigns improving fan acquisition by over 20%. The integration of analytics with online ticketing platforms, including daily fantasy sports and dynamic pricing models, is optimizing revenue streams.
  • Event organizers using such systems have seen a 10-15% increase in yield from ticket sales. Furthermore, the increasing number of low-cost airlines is fueling sports tourism management and sports content monetization, making international events more accessible.
  • This convergence of digital interaction, data-driven decision-making, and enhanced accessibility through sports analytics platforms is setting a new competitive benchmark for over-the-top (OTT) streaming and fan loyalty programs across the industry.

What challenges does the Sporting Events Industry face during its growth?

  • Rising concerns over ticket counterfeiting for sporting events represent a significant challenge that could impede industry growth and consumer trust.

  • The sporting events market faces significant challenges related to security, audience retention, and technological adaptation. The rising concern of ticket counterfeiting necessitates the adoption of secure technologies like blockchain ticket verification and biometric fan identification, as current systems see fraud rates as high as 5% for major events.
  • A critical challenge is the increasing disinterest among younger generations, who often prefer automated highlights generation over passive viewing. This requires a strategic shift towards interactive streaming features and social media integration, along with influencer marketing partnerships, to capture their attention.
  • Furthermore, failing to update technological infrastructure, such as broadcasting infrastructure and smart stadium infrastructure, poses a risk of becoming obsolete. Organizations that lag in technology adoption report a 10% lower fan satisfaction score, underscoring the importance of continuous innovation and sustainable event management to remain competitive.

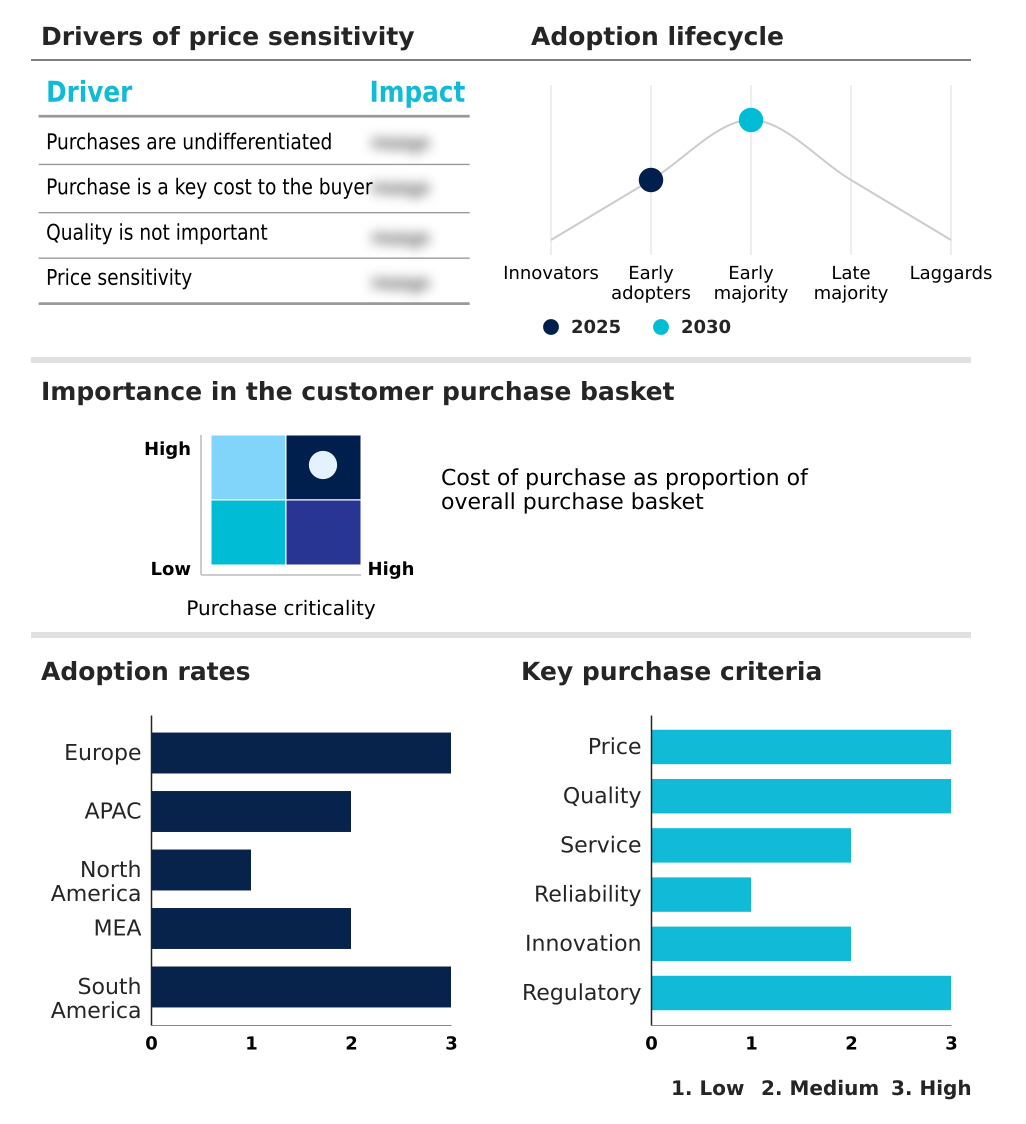
Exclusive Technavio Analysis on Customer Landscape

The sporting events market forecasting report includes the adoption lifecycle of the market, covering from the innovator’s stage to the laggard’s stage. It focuses on adoption rates in different regions based on penetration. Furthermore, the sporting events market report also includes key purchase criteria and drivers of price sensitivity to help companies evaluate and develop their market growth analysis strategies.

Customer Landscape of Sporting Events Industry

Competitive Landscape

Companies are implementing various strategies, such as strategic alliances, sporting events market forecast, partnerships, mergers and acquisitions, geographical expansion, and product/service launches, to enhance their presence in the industry.

AEG Worldwide - Analysis reveals a focus on integrated live entertainment, including event promotion, sports event hosting, and management of premier global venues.

The industry research and growth report includes detailed analyses of the competitive landscape of the market and information about key companies, including:

  • AEG Worldwide
  • ATP Tour Inc
  • Bellator MMA
  • E1 Series Ltd
  • Extreme E Ltd
  • GLORY Sports International
  • IMG Worldwide LLC
  • IndyCar Series LLC
  • Infront Sports and Media AG
  • Lagardere SA
  • LIV Golf Investments
  • Live Nation Entertainment Inc.
  • Major League Baseball
  • NASCAR Inc
  • Octagon Inc
  • Tough Mudder Inc
  • UFC LLC
  • Wasserman Media Group LLC
  • World Surf League
  • WTA TOUR INC.

Qualitative and quantitative analysis of companies has been conducted to help clients understand the wider business environment as well as the strengths and weaknesses of key industry players. Data is qualitatively analyzed to categorize companies as pure play, category-focused, industry-focused, and diversified; it is quantitatively analyzed to categorize companies as dominant, leading, strong, tentative, and weak.

Recent Development and News in Sporting events market

  • In September 2024, IMG Worldwide LLC announced a strategic partnership with a major technology firm to co-develop an AI-powered fan engagement platform, aiming to personalize content delivery for over 50 million users across its event portfolio.
  • In November 2024, Live Nation Entertainment Inc. completed the acquisition of a regional ticketing and event management company in Southeast Asia for an estimated $150 million, expanding its footprint in the rapidly growing APAC market.
  • In January 2025, Extreme E Ltd launched its new hydro-powered off-road racing series, featuring a five-race global calendar focused on promoting sustainability and highlighting climate change-impacted locations.
  • In April 2025, the World Surf League implemented a blockchain-based verification system for its judging and scoring, a first for a major global sports league, to enhance transparency and integrity in its competitions.

Dive into Technavio’s robust research methodology, blending expert interviews, extensive data synthesis, and validated models for unparalleled Sporting Events Market insights. See full methodology.

Market Scope
Page number 306
Base year 2025
Historic period 2020-2024
Forecast period 2026-2030
Growth momentum & CAGR Accelerate at a CAGR of 9.4%
Market growth 2026-2030 USD 140427.0 million
Market structure Fragmented
YoY growth 2025-2026(%) 8.6%
Key countries Germany, UK, France, Italy, Spain, The Netherlands, China, Japan, India, South Korea, Australia, Indonesia, US, Canada, Mexico, Saudi Arabia, UAE, South Africa, Israel, Turkey, Brazil, Argentina and Chile
Competitive landscape Leading Companies, Market Positioning of Companies, Competitive Strategies, and Industry Risks

Request Free Sample

Research Analyst Overview

  • The sporting events market is navigating a paradigm shift, moving beyond traditional event promotion to a highly integrated digital ecosystem. Success is now defined by the seamless execution of digital ticketing platforms, secure mobile ticketing, and frictionless cashless payment integration.
  • The fan experience is being reimagined through virtual reality viewing, augmented reality fan apps, and high-definition live streaming, all personalized via AI-powered content personalization. Boardroom decisions increasingly center on investments in smart stadium infrastructure and real-time crowd analytics to enhance safety and optimize operations.
  • The adoption of blockchain ticket verification and biometric fan identification is becoming a critical component of risk management. Behind the scenes, the industry relies on sophisticated venue security systems, athlete performance tracking, and comprehensive talent representation services. Revenue models are evolving with dynamic pricing models, e-commerce merchandising, and interactive streaming features, supported by robust fan data analytics.
  • The rise of professional esports leagues and daily fantasy sports, coupled with multi-camera angle broadcasting, illustrates the diversification of content. Organizations that master personalized fan communication and automated content generation see a significant competitive advantage, with some achieving a 10% uplift in fan loyalty program retention.
  • This complex environment demands expertise in league governance models, sports development programs, and effective behind-the-scenes content delivery. The use of online printable tickets is fading in favor of more advanced mobile entry systems and contactless payment systems.

What are the Key Data Covered in this Sporting Events Market Research and Growth Report?

  • What is the expected growth of the Sporting Events Market between 2026 and 2030?

    • USD 140.43 billion, at a CAGR of 9.4%

  • What segmentation does the market report cover?

    • The report is segmented by Revenue Stream (Sponsorships, Tickets, Broadcasting and media rights, and Merchandising), Event Type (Soccer, Cricket, Tennis, and Others), Type (Digital ticket, Online printable tickets, and Paper tickets) and Geography (Europe, APAC, North America, Middle East and Africa, South America)

  • Which regions are analyzed in the report?

    • Europe, APAC, North America, Middle East and Africa and South America

  • What are the key growth drivers and market challenges?

    • Increasing sports sponsorship spending, Rising concerns in ticket counterfeiting for sporting events

  • Who are the major players in the Sporting Events Market?

    • AEG Worldwide, ATP Tour Inc, Bellator MMA, E1 Series Ltd, Extreme E Ltd, GLORY Sports International, IMG Worldwide LLC, IndyCar Series LLC, Infront Sports and Media AG, Lagardere SA, LIV Golf Investments, Live Nation Entertainment Inc., Major League Baseball, NASCAR Inc, Octagon Inc, Tough Mudder Inc, UFC LLC, Wasserman Media Group LLC, World Surf League and WTA TOUR INC.

Market Research Insights

  • The dynamics of the sporting events market are increasingly shaped by digital transformation and data-driven strategies. Effective sports event management now relies heavily on sports analytics platforms to inform decisions, with organizations that leverage fan data reporting a 15% higher engagement rate on their digital media distribution channels.
  • The commercial landscape is bolstered by robust sports marketing agencies that secure high-value brand licensing agreements and athlete endorsement deals. As the industry pivots, there is a notable shift toward subscription-based streaming, which offers a more predictable revenue stream compared to traditional advertising.
  • Moreover, the integration of sports betting has proven to increase viewership by up to 25% for certain broadcasts, creating a new layer of fan interaction and monetization through influencer marketing partnerships and specialized fan community platforms.

We can help! Our analysts can customize this sporting events market research report to meet your requirements.

Get in touch

1. Executive Summary

1.1 Market overview

Executive Summary - Chart on Market Overview
Executive Summary - Data Table on Market Overview
Executive Summary - Chart on Global Market Characteristics
Executive Summary - Chart on Market by Geography
Executive Summary - Chart on Market Segmentation by Revenue Stream
Executive Summary - Chart on Market Segmentation by Event Type
Executive Summary - Chart on Market Segmentation by Type
Executive Summary - Chart on Incremental Growth
Executive Summary - Data Table on Incremental Growth
Executive Summary - Chart on Company Market Positioning

2. Technavio Analysis

2.1 Analysis of price sensitivity, lifecycle, customer purchase basket, adoption rates, and purchase criteria

2.2 Criticality of inputs and Factors of differentiation

Chart on Overview on criticality of inputs and factors of differentiation

2.3 Factors of disruption

Chart on Overview on factors of disruption

2.4 Impact of drivers and challenges

Chart on Impact of drivers and challenges in 2025 and 2030

3. Market Landscape

3.1 Market ecosystem

Chart on Parent Market
Data Table on - Parent Market

3.2 Market characteristics

Chart on Market characteristics analysis

3.3 Value chain analysis

Chart on Value chain analysis

4. Market Sizing

4.1 Market definition

Data Table on Offerings of companies included in the market definition

4.2 Market segment analysis

Market segments

4.3 Market size 2025

4.4 Market outlook: Forecast for 2025-2030

Chart on Global - Market size and forecast 2025-2030 ($ million)
Data Table on Global - Market size and forecast 2025-2030 ($ million)
Chart on Global Market: Year-over-year growth 2025-2030 (%)
Data Table on Global Market: Year-over-year growth 2025-2030 (%)

5. Historic Market Size

5.1 Global Sporting Events Market 2020 - 2024

Historic Market Size - Data Table on Global Sporting Events Market 2020 - 2024 ($ million)

5.2 Revenue Stream segment analysis 2020 - 2024

Historic Market Size - Revenue Stream Segment 2020 - 2024 ($ million)

5.3 Event Type segment analysis 2020 - 2024

Historic Market Size - Event Type Segment 2020 - 2024 ($ million)

5.4 Type segment analysis 2020 - 2024

Historic Market Size - Type Segment 2020 - 2024 ($ million)

5.5 Geography segment analysis 2020 - 2024

Historic Market Size - Geography Segment 2020 - 2024 ($ million)

5.6 Country segment analysis 2020 - 2024

Historic Market Size - Country Segment 2020 - 2024 ($ million)

6. Qualitative Analysis

6.1 Impact of AI on Global Sporting Events Market

6.2 Impact of Geopolitical Conflicts on Global Sporting Events Market

7. Five Forces Analysis

7.1 Five forces summary

Five forces analysis - Comparison between 2025 and 2030

7.2 Bargaining power of buyers

Bargaining power of buyers - Impact of key factors 2025 and 2030

7.3 Bargaining power of suppliers

Bargaining power of suppliers - Impact of key factors in 2025 and 2030

7.4 Threat of new entrants

Threat of new entrants - Impact of key factors in 2025 and 2030

7.5 Threat of substitutes

Threat of substitutes - Impact of key factors in 2025 and 2030

7.6 Threat of rivalry

Threat of rivalry - Impact of key factors in 2025 and 2030

7.7 Market condition

Chart on Market condition - Five forces 2025 and 2030

8. Market Segmentation by Revenue Stream

8.1 Market segments

Chart on Revenue Stream - Market share 2025-2030 (%)
Data Table on Revenue Stream - Market share 2025-2030 (%)

8.2 Comparison by Revenue Stream

Chart on Comparison by Revenue Stream
Data Table on Comparison by Revenue Stream

8.3 Sponsorships - Market size and forecast 2025-2030

Chart on Sponsorships - Market size and forecast 2025-2030 ($ million)
Data Table on Sponsorships - Market size and forecast 2025-2030 ($ million)
Chart on Sponsorships - Year-over-year growth 2025-2030 (%)
Data Table on Sponsorships - Year-over-year growth 2025-2030 (%)

8.4 Tickets - Market size and forecast 2025-2030

Chart on Tickets - Market size and forecast 2025-2030 ($ million)
Data Table on Tickets - Market size and forecast 2025-2030 ($ million)
Chart on Tickets - Year-over-year growth 2025-2030 (%)
Data Table on Tickets - Year-over-year growth 2025-2030 (%)

8.5 Broadcasting and media rights - Market size and forecast 2025-2030

Chart on Broadcasting and media rights - Market size and forecast 2025-2030 ($ million)
Data Table on Broadcasting and media rights - Market size and forecast 2025-2030 ($ million)
Chart on Broadcasting and media rights - Year-over-year growth 2025-2030 (%)
Data Table on Broadcasting and media rights - Year-over-year growth 2025-2030 (%)

8.6 Merchandising - Market size and forecast 2025-2030

Chart on Merchandising - Market size and forecast 2025-2030 ($ million)
Data Table on Merchandising - Market size and forecast 2025-2030 ($ million)
Chart on Merchandising - Year-over-year growth 2025-2030 (%)
Data Table on Merchandising - Year-over-year growth 2025-2030 (%)

8.7 Market opportunity by Revenue Stream

Market opportunity by Revenue Stream ($ million)
Data Table on Market opportunity by Revenue Stream ($ million)

9. Market Segmentation by Event Type

9.1 Market segments

Chart on Event Type - Market share 2025-2030 (%)
Data Table on Event Type - Market share 2025-2030 (%)

9.2 Comparison by Event Type

Chart on Comparison by Event Type
Data Table on Comparison by Event Type

9.3 Soccer - Market size and forecast 2025-2030

Chart on Soccer - Market size and forecast 2025-2030 ($ million)
Data Table on Soccer - Market size and forecast 2025-2030 ($ million)
Chart on Soccer - Year-over-year growth 2025-2030 (%)
Data Table on Soccer - Year-over-year growth 2025-2030 (%)

9.4 Cricket - Market size and forecast 2025-2030

Chart on Cricket - Market size and forecast 2025-2030 ($ million)
Data Table on Cricket - Market size and forecast 2025-2030 ($ million)
Chart on Cricket - Year-over-year growth 2025-2030 (%)
Data Table on Cricket - Year-over-year growth 2025-2030 (%)

9.5 Tennis - Market size and forecast 2025-2030

Chart on Tennis - Market size and forecast 2025-2030 ($ million)
Data Table on Tennis - Market size and forecast 2025-2030 ($ million)
Chart on Tennis - Year-over-year growth 2025-2030 (%)
Data Table on Tennis - Year-over-year growth 2025-2030 (%)

9.6 Others - Market size and forecast 2025-2030

Chart on Others - Market size and forecast 2025-2030 ($ million)
Data Table on Others - Market size and forecast 2025-2030 ($ million)
Chart on Others - Year-over-year growth 2025-2030 (%)
Data Table on Others - Year-over-year growth 2025-2030 (%)

9.7 Market opportunity by Event Type

Market opportunity by Event Type ($ million)
Data Table on Market opportunity by Event Type ($ million)

10. Market Segmentation by Type

10.1 Market segments

Chart on Type - Market share 2025-2030 (%)
Data Table on Type - Market share 2025-2030 (%)

10.2 Comparison by Type

Chart on Comparison by Type
Data Table on Comparison by Type

10.3 Digital ticket - Market size and forecast 2025-2030

Chart on Digital ticket - Market size and forecast 2025-2030 ($ million)
Data Table on Digital ticket - Market size and forecast 2025-2030 ($ million)
Chart on Digital ticket - Year-over-year growth 2025-2030 (%)
Data Table on Digital ticket - Year-over-year growth 2025-2030 (%)

10.4 Online printable tickets - Market size and forecast 2025-2030

Chart on Online printable tickets - Market size and forecast 2025-2030 ($ million)
Data Table on Online printable tickets - Market size and forecast 2025-2030 ($ million)
Chart on Online printable tickets - Year-over-year growth 2025-2030 (%)
Data Table on Online printable tickets - Year-over-year growth 2025-2030 (%)

10.5 Paper tickets - Market size and forecast 2025-2030

Chart on Paper tickets - Market size and forecast 2025-2030 ($ million)
Data Table on Paper tickets - Market size and forecast 2025-2030 ($ million)
Chart on Paper tickets - Year-over-year growth 2025-2030 (%)
Data Table on Paper tickets - Year-over-year growth 2025-2030 (%)

10.6 Market opportunity by Type

Market opportunity by Type ($ million)
Data Table on Market opportunity by Type ($ million)

11. Customer Landscape

11.1 Customer landscape overview

Analysis of price sensitivity, lifecycle, customer purchase basket, adoption rates, and purchase criteria

12. Geographic Landscape

12.1 Geographic segmentation

Chart on Market share by geography 2025-2030 (%)
Data Table on Market share by geography 2025-2030 (%)

12.2 Geographic comparison

Chart on Geographic comparison
Data Table on Geographic comparison

12.3 Europe - Market size and forecast 2025-2030

Chart on Europe - Market size and forecast 2025-2030 ($ million)
Data Table on Europe - Market size and forecast 2025-2030 ($ million)
Chart on Europe - Year-over-year growth 2025-2030 (%)
Data Table on Europe - Year-over-year growth 2025-2030 (%)
Chart on Regional Comparison - Europe
Data Table on Regional Comparison - Europe

12.3.1 Germany - Market size and forecast 2025-2030

Chart on Germany - Market size and forecast 2025-2030 ($ million)
Data Table on Germany - Market size and forecast 2025-2030 ($ million)
Chart on Germany - Year-over-year growth 2025-2030 (%)
Data Table on Germany - Year-over-year growth 2025-2030 (%)

12.3.2 UK - Market size and forecast 2025-2030

Chart on UK - Market size and forecast 2025-2030 ($ million)
Data Table on UK - Market size and forecast 2025-2030 ($ million)
Chart on UK - Year-over-year growth 2025-2030 (%)
Data Table on UK - Year-over-year growth 2025-2030 (%)

12.3.3 France - Market size and forecast 2025-2030

Chart on France - Market size and forecast 2025-2030 ($ million)
Data Table on France - Market size and forecast 2025-2030 ($ million)
Chart on France - Year-over-year growth 2025-2030 (%)
Data Table on France - Year-over-year growth 2025-2030 (%)

12.3.4 Italy - Market size and forecast 2025-2030

Chart on Italy - Market size and forecast 2025-2030 ($ million)
Data Table on Italy - Market size and forecast 2025-2030 ($ million)
Chart on Italy - Year-over-year growth 2025-2030 (%)
Data Table on Italy - Year-over-year growth 2025-2030 (%)

12.3.5 Spain - Market size and forecast 2025-2030

Chart on Spain - Market size and forecast 2025-2030 ($ million)
Data Table on Spain - Market size and forecast 2025-2030 ($ million)
Chart on Spain - Year-over-year growth 2025-2030 (%)
Data Table on Spain - Year-over-year growth 2025-2030 (%)

12.3.6 The Netherlands - Market size and forecast 2025-2030

Chart on The Netherlands - Market size and forecast 2025-2030 ($ million)
Data Table on The Netherlands - Market size and forecast 2025-2030 ($ million)
Chart on The Netherlands - Year-over-year growth 2025-2030 (%)
Data Table on The Netherlands - Year-over-year growth 2025-2030 (%)

12.4 APAC - Market size and forecast 2025-2030

Chart on APAC - Market size and forecast 2025-2030 ($ million)
Data Table on APAC - Market size and forecast 2025-2030 ($ million)
Chart on APAC - Year-over-year growth 2025-2030 (%)
Data Table on APAC - Year-over-year growth 2025-2030 (%)
Chart on Regional Comparison - APAC
Data Table on Regional Comparison - APAC

12.4.1 China - Market size and forecast 2025-2030

Chart on China - Market size and forecast 2025-2030 ($ million)
Data Table on China - Market size and forecast 2025-2030 ($ million)
Chart on China - Year-over-year growth 2025-2030 (%)
Data Table on China - Year-over-year growth 2025-2030 (%)

12.4.2 Japan - Market size and forecast 2025-2030

Chart on Japan - Market size and forecast 2025-2030 ($ million)
Data Table on Japan - Market size and forecast 2025-2030 ($ million)
Chart on Japan - Year-over-year growth 2025-2030 (%)
Data Table on Japan - Year-over-year growth 2025-2030 (%)

12.4.3 India - Market size and forecast 2025-2030

Chart on India - Market size and forecast 2025-2030 ($ million)
Data Table on India - Market size and forecast 2025-2030 ($ million)
Chart on India - Year-over-year growth 2025-2030 (%)
Data Table on India - Year-over-year growth 2025-2030 (%)

12.4.4 South Korea - Market size and forecast 2025-2030

Chart on South Korea - Market size and forecast 2025-2030 ($ million)
Data Table on South Korea - Market size and forecast 2025-2030 ($ million)
Chart on South Korea - Year-over-year growth 2025-2030 (%)
Data Table on South Korea - Year-over-year growth 2025-2030 (%)

12.4.5 Australia - Market size and forecast 2025-2030

Chart on Australia - Market size and forecast 2025-2030 ($ million)
Data Table on Australia - Market size and forecast 2025-2030 ($ million)
Chart on Australia - Year-over-year growth 2025-2030 (%)
Data Table on Australia - Year-over-year growth 2025-2030 (%)

12.4.6 Indonesia - Market size and forecast 2025-2030

Chart on Indonesia - Market size and forecast 2025-2030 ($ million)
Data Table on Indonesia - Market size and forecast 2025-2030 ($ million)
Chart on Indonesia - Year-over-year growth 2025-2030 (%)
Data Table on Indonesia - Year-over-year growth 2025-2030 (%)

12.5 North America - Market size and forecast 2025-2030

Chart on North America - Market size and forecast 2025-2030 ($ million)
Data Table on North America - Market size and forecast 2025-2030 ($ million)
Chart on North America - Year-over-year growth 2025-2030 (%)
Data Table on North America - Year-over-year growth 2025-2030 (%)
Chart on Regional Comparison - North America
Data Table on Regional Comparison - North America

12.5.1 US - Market size and forecast 2025-2030

Chart on US - Market size and forecast 2025-2030 ($ million)
Data Table on US - Market size and forecast 2025-2030 ($ million)
Chart on US - Year-over-year growth 2025-2030 (%)
Data Table on US - Year-over-year growth 2025-2030 (%)

12.5.2 Canada - Market size and forecast 2025-2030

Chart on Canada - Market size and forecast 2025-2030 ($ million)
Data Table on Canada - Market size and forecast 2025-2030 ($ million)
Chart on Canada - Year-over-year growth 2025-2030 (%)
Data Table on Canada - Year-over-year growth 2025-2030 (%)

12.5.3 Mexico - Market size and forecast 2025-2030

Chart on Mexico - Market size and forecast 2025-2030 ($ million)
Data Table on Mexico - Market size and forecast 2025-2030 ($ million)
Chart on Mexico - Year-over-year growth 2025-2030 (%)
Data Table on Mexico - Year-over-year growth 2025-2030 (%)

12.6 Middle East and Africa - Market size and forecast 2025-2030

Chart on Middle East and Africa - Market size and forecast 2025-2030 ($ million)
Data Table on Middle East and Africa - Market size and forecast 2025-2030 ($ million)
Chart on Middle East and Africa - Year-over-year growth 2025-2030 (%)
Data Table on Middle East and Africa - Year-over-year growth 2025-2030 (%)
Chart on Regional Comparison - Middle East and Africa
Data Table on Regional Comparison - Middle East and Africa

12.6.1 Saudi Arabia - Market size and forecast 2025-2030

Chart on Saudi Arabia - Market size and forecast 2025-2030 ($ million)
Data Table on Saudi Arabia - Market size and forecast 2025-2030 ($ million)
Chart on Saudi Arabia - Year-over-year growth 2025-2030 (%)
Data Table on Saudi Arabia - Year-over-year growth 2025-2030 (%)

12.6.2 UAE - Market size and forecast 2025-2030

Chart on UAE - Market size and forecast 2025-2030 ($ million)
Data Table on UAE - Market size and forecast 2025-2030 ($ million)
Chart on UAE - Year-over-year growth 2025-2030 (%)
Data Table on UAE - Year-over-year growth 2025-2030 (%)

12.6.3 South Africa - Market size and forecast 2025-2030

Chart on South Africa - Market size and forecast 2025-2030 ($ million)
Data Table on South Africa - Market size and forecast 2025-2030 ($ million)
Chart on South Africa - Year-over-year growth 2025-2030 (%)
Data Table on South Africa - Year-over-year growth 2025-2030 (%)

12.6.4 Israel - Market size and forecast 2025-2030

Chart on Israel - Market size and forecast 2025-2030 ($ million)
Data Table on Israel - Market size and forecast 2025-2030 ($ million)
Chart on Israel - Year-over-year growth 2025-2030 (%)
Data Table on Israel - Year-over-year growth 2025-2030 (%)

12.6.5 Turkey - Market size and forecast 2025-2030

Chart on Turkey - Market size and forecast 2025-2030 ($ million)
Data Table on Turkey - Market size and forecast 2025-2030 ($ million)
Chart on Turkey - Year-over-year growth 2025-2030 (%)
Data Table on Turkey - Year-over-year growth 2025-2030 (%)

12.7 South America - Market size and forecast 2025-2030

Chart on South America - Market size and forecast 2025-2030 ($ million)
Data Table on South America - Market size and forecast 2025-2030 ($ million)
Chart on South America - Year-over-year growth 2025-2030 (%)
Data Table on South America - Year-over-year growth 2025-2030 (%)
Chart on Regional Comparison - South America
Data Table on Regional Comparison - South America

12.7.1 Brazil - Market size and forecast 2025-2030

Chart on Brazil - Market size and forecast 2025-2030 ($ million)
Data Table on Brazil - Market size and forecast 2025-2030 ($ million)
Chart on Brazil - Year-over-year growth 2025-2030 (%)
Data Table on Brazil - Year-over-year growth 2025-2030 (%)

12.7.2 Argentina - Market size and forecast 2025-2030

Chart on Argentina - Market size and forecast 2025-2030 ($ million)
Data Table on Argentina - Market size and forecast 2025-2030 ($ million)
Chart on Argentina - Year-over-year growth 2025-2030 (%)
Data Table on Argentina - Year-over-year growth 2025-2030 (%)

12.7.3 Chile - Market size and forecast 2025-2030

Chart on Chile - Market size and forecast 2025-2030 ($ million)
Data Table on Chile - Market size and forecast 2025-2030 ($ million)
Chart on Chile - Year-over-year growth 2025-2030 (%)
Data Table on Chile - Year-over-year growth 2025-2030 (%)

12.8 Market opportunity by geography

Market opportunity by geography ($ million)
Data Tables on Market opportunity by geography ($ million)

13. Drivers, Challenges, and Opportunity

13.1 Market drivers

Increasing sports sponsorship spending
Rapid growth of sports industry and international sporting events
Rising usage of mobile applications for engaging fans in online sporting events

13.2 Market challenges

Rising concerns in ticket counterfeiting for sporting events
Increasing disinterest in sporting events among new generations
Failing to update in technological advancements in sports industry

13.3 Impact of drivers and challenges

Impact of drivers and challenges in 2025 and 2030

13.4 Market opportunities

High utilization of social media for branding and collaboration
Increasing number of low-cost airlines for sports tourism
Integration of analytics with online ticket platforms

14. Competitive Landscape

14.1 Overview

14.2

Overview on criticality of inputs and factors of differentiation

14.3 Landscape disruption

Overview on factors of disruption

14.4 Industry risks

Impact of key risks on business

15. Competitive Analysis

15.1 Companies profiled

Companies covered

15.2 Company ranking index

15.3 Market positioning of companies

Matrix on companies position and classification

15.4 AEG Worldwide

AEG Worldwide - Overview
AEG Worldwide - Product / Service
AEG Worldwide - Key offerings
SWOT

15.5 ATP Tour Inc

ATP Tour Inc - Overview
ATP Tour Inc - Product / Service
ATP Tour Inc - Key offerings
SWOT

15.6 Bellator MMA

Bellator MMA - Overview
Bellator MMA - Product / Service
Bellator MMA - Key offerings
SWOT

15.7 E1 Series Ltd

E1 Series Ltd - Overview
E1 Series Ltd - Product / Service
E1 Series Ltd - Key offerings
SWOT

15.8 Extreme E Ltd

Extreme E Ltd - Overview
Extreme E Ltd - Product / Service
Extreme E Ltd - Key offerings
SWOT

15.9 GLORY Sports International

GLORY Sports International - Overview
GLORY Sports International - Product / Service
GLORY Sports International - Key offerings
SWOT

15.10 IMG Worldwide LLC

IMG Worldwide LLC - Overview
IMG Worldwide LLC - Product / Service
IMG Worldwide LLC - Key offerings
SWOT

15.11 IndyCar Series LLC

IndyCar Series LLC - Overview
IndyCar Series LLC - Product / Service
IndyCar Series LLC - Key offerings
SWOT

15.12 Infront Sports and Media AG

Infront Sports and Media AG - Overview
Infront Sports and Media AG - Product / Service
Infront Sports and Media AG - Key offerings
SWOT

15.13 Lagardere SA

Lagardere SA - Overview
Lagardere SA - Business segments
Lagardere SA - Key offerings
Lagardere SA - Segment focus
SWOT

15.14 LIV Golf Investments

LIV Golf Investments - Overview
LIV Golf Investments - Product / Service
LIV Golf Investments - Key offerings
SWOT

15.15 Live Nation Entertainment Inc.

Live Nation Entertainment Inc. - Overview
Live Nation Entertainment Inc. - Business segments
Live Nation Entertainment Inc. - Key offerings
Live Nation Entertainment Inc. - Segment focus
SWOT

15.16 Major League Baseball

Major League Baseball - Overview
Major League Baseball - Product / Service
Major League Baseball - Key offerings
SWOT

15.17 Octagon Inc

Octagon Inc - Overview
Octagon Inc - Product / Service
Octagon Inc - Key offerings
SWOT

15.18 Wasserman Media Group LLC

Wasserman Media Group LLC - Overview
Wasserman Media Group LLC - Product / Service
Wasserman Media Group LLC - Key offerings
SWOT

16. Appendix

16.1 Scope of the report

Market definition
Objectives
Notes and caveats

16.2 Inclusions and exclusions checklist

Inclusions checklist
Exclusions checklist

16.3 Currency conversion rates for US$

16.4 Research methodology

16.5 Data procurement

Information sources

16.6 Data validation

16.7 Validation techniques employed for market sizing

16.8 Data synthesis

16.9 360 degree market analysis

16.10 List of abbreviations

Research Methodology

Technavio presents a detailed picture of the market by way of study, synthesis, and summation of data from multiple sources. The analysts have presented the various facets of the market with a particular focus on identifying the key industry influencers. The data thus presented is comprehensive, reliable, and the result of extensive research, both primary and secondary.

INFORMATION SOURCES

Primary sources

  • Manufacturers and suppliers
  • Channel partners
  • Industry experts
  • Strategic decision makers

Secondary sources

  • Industry journals and periodicals
  • Government data
  • Financial reports of key industry players
  • Historical data
  • Press releases

DATA ANALYSIS

Data Synthesis

  • Collation of data
  • Estimation of key figures
  • Analysis of derived insights

Data Validation

  • Triangulation with data models
  • Reference against proprietary databases
  • Corroboration with industry experts

REPORT WRITING

Qualitative

  • Market drivers
  • Market challenges
  • Market trends
  • Five forces analysis

Quantitative

  • Market size and forecast
  • Market segmentation
  • Geographical insights
  • Competitive landscape

Interested in this report?

Get your sample now to see our research methodology and insights!

Download Now

Frequently Asked Questions

Sporting Events market growth will increase by USD 140427.0 million during 2026-2030.

The Sporting Events market is expected to grow at a CAGR of 9.4% during 2026-2030.

Sporting Events market is segmented by Revenue stream (Sponsorships, Tickets, Broadcasting and media rights, Merchandising) Event type (Soccer, Cricket, Tennis, Others) Type (Digital ticket, Online printable tickets, Paper tickets)

AEG Worldwide, ATP Tour Inc, Bellator MMA, E1 Series Ltd, Extreme E Ltd, GLORY Sports International, IMG Worldwide LLC, IndyCar Series LLC, Infront Sports and Media AG, Lagardere SA, LIV Golf Investments, Live Nation Entertainment Inc., Major League Baseball, NASCAR Inc, Octagon Inc, Tough Mudder Inc, UFC LLC, Wasserman Media Group LLC, World Surf League, WTA TOUR INC. are a few of the key vendors in the Sporting Events market.

Europe will register the highest growth rate of 34.2% among the other regions. Therefore, the Sporting Events market in Europe is expected to garner significant business opportunities for the vendors during the forecast period.

Germany, UK, France, Italy, Spain, The Netherlands, China, Japan, India, South Korea, Australia, Indonesia, US, Canada, Mexico, Saudi Arabia, UAE, South Africa, Israel, Turkey, Brazil, Argentina, Chile

  • Increasing sports sponsorship spending is the driving factor this market.

The Sporting Events market vendors should focus on grabbing business opportunities from the Revenue stream segment as it accounted for the largest market share in the base year.
RIA - Research AI Assistant
Ask RIA