Sports Bicycle Market Analysis, Size, and Forecast 2024-2028: North America (US, Canada, and Mexico), Europe (France, Germany, Italy, The Netherlands, and UK), Middle East and Africa (UAE), APAC (Australia, China, India, and Japan), South America (Brazil), and Rest of World (ROW)

Sports Bicycle Market Analysis, Size, and Forecast 2024-2028:
North America (US, Canada, and Mexico), Europe (France, Germany, Italy, The Netherlands, and UK), Middle East and Africa (UAE), APAC (Australia, China, India, and Japan), South America (Brazil), and Rest of World (ROW)

Published: Jul 2024 165 Pages SKU: IRTNTR74333

Market Overview at a Glance

$7.20 B
Market Opportunity
7.44%
CAGR
6.4
YoY growth 2023-2024(%)

Sports Bicycle Market Size 2024-2028

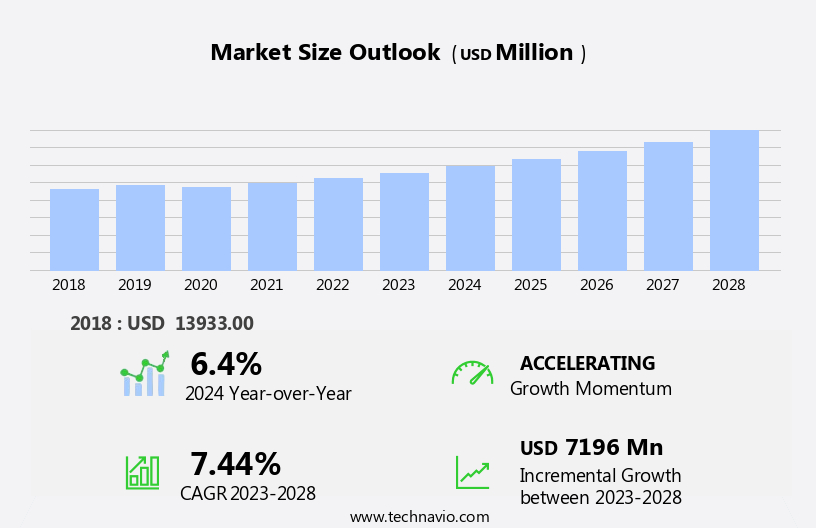
The sports bicycle market size is forecast to increase by USD 7.2 billion, at a CAGR of 7.44% between 2023 and 2028.

  • The market is experiencing significant growth, driven by the increasing popularity of cycling as a healthier and more eco-friendly mode of transportation. A key trend in the market is the development of innovative products, including electric and smart bicycles, which cater to diverse consumer needs and preferences. However, the market faces challenges, including the rise in prices of raw materials, particularly aluminum and steel, which impact production costs. Furthermore, the market is affected by the increasing fuel prices, which may discourage potential buyers from purchasing traditional bicycles in favor of more fuel-efficient alternatives.
  • Companies in the market must navigate these challenges by focusing on cost optimization and continuous innovation to maintain competitiveness and capitalize on the growing demand for sustainable transportation solutions.

What will be the Size of the Sports Bicycle Market during the forecast period?

Sports Bicycle Market Size

Explore in-depth regional segment analysis with market size data - historical 2018-2022 and forecasts 2024-2028 - in the full report.  
Request Free Sample

The market continues to evolve, with dynamic market activities unfolding across various sectors. Cycling events serve as platforms for showcasing the latest innovations, from gravel bike races to triathlons, fueling consumer interest and driving sales. Direct-to-consumer sales have gained traction, enabling brands to offer competitive pricing and personalized customer service. Bike pumps and rim brakes remain essential components, while hydraulic disc brakes and gps tracking offer enhanced performance and safety. Weight reduction through titanium frames and cycling apparel is a priority for competitive riders, while bike fitting ensures optimal comfort and efficiency. Gravel bikes and drivetrain efficiency have emerged as key trends, with aluminum frames offering a balance between cost and performance.

Bike helmets, component upgrades, and cycling shoes are essential for rider safety and comfort. Fitness monitoring through mobile apps and gps tracking provide valuable data for training and performance improvement. E-bikes and bike sharing schemes have expanded the market, catering to diverse consumer preferences. Brand loyalty is influenced by distribution networks, marketing campaigns, and bike customization options. Component recycling and frame geometry innovations contribute to sustainable manufacturing practices, reducing the carbon footprint and environmental impact. Suspension systems and shock absorbers enhance the riding experience, while sales channels and pricing strategies adapt to the evolving market landscape. Bicycle tourism and e-commerce platforms have emerged as significant growth areas, with bike racks, bike lights, folding bikes, and inner tubes catering to the diverse needs of cyclists. Performance testing and safety standards ensure the quality and reliability of products, maintaining consumer trust and confidence in the market.

How is this Sports Bicycle Industry segmented?

The sports bicycle industry research report provides comprehensive data (region-wise segment analysis), with forecasts and estimates in "USD million" for the period 2024-2028, as well as historical data from 2018-2022 for the following segments.

  • Application
    • Adults
    • Kids
  • Product
    • Mountain bicycles
    • Cyclo-cross bicycles
    • Road racing bicycles
    • Track bicycles
  • Geography
    • North America
      • US
      • Canada
    • Europe
      • Germany
      • UK
    • APAC
      • China
    • Rest of World (ROW)

By Application Insights

The adults segment is estimated to witness significant growth during the forecast period.

The market is experiencing a shift in consumer demographics, with adults (20-60) showing increased interest and adoption. Traditional perceptions of biking being a youth activity are evolving, as more elderly people embrace cycling for health, recreation, and adventure. This trend is particularly noticeable in regions such as the US, Europe, India, and Australia, where declining car ownership among young adults and growing health consciousness are driving sales. Sustainable manufacturing practices are gaining importance in the industry, with companies focusing on reducing carbon footprint and environmental impact. Supply chain management and bike maintenance are critical areas of emphasis, ensuring efficient distribution networks and effective marketing campaigns.

BMX Bikes, steel frames, and road bikes continue to be popular, while mountain bikes and gravel bikes cater to the adventurous and off-road enthusiasts. Brand loyalty is a significant factor in the market, with consumers preferring trusted brands for their bike needs. Direct-to-consumer sales and e-commerce platforms have emerged as viable channels, offering competitive pricing and convenience. Customization, component upgrades, and bike repair services cater to individual preferences, while safety standards ensure consumer protection. Product innovation is a key driver, with advancements in drivetrain efficiency, frame geometry, and suspension systems. Electric bikes (e-bikes) and bike sharing programs are emerging trends, addressing consumer needs for convenience and sustainability.

Health benefits, such as improved cardiovascular fitness and reduced stress, further fuel market growth. Bike events, tours, and cycling apparel complement the market, offering unique experiences and enhancing the overall cycling lifestyle. Consumer preferences for lightweight materials like carbon fiber frames, titanium frames, and aluminum frames continue to influence design and manufacturing. Bike racks, bike lights, and folding bikes cater to the diverse needs of consumers. Customer service, competitive pricing, and component recycling are essential elements of the market, ensuring a positive consumer experience and reducing environmental impact. The future of the market is promising, with a focus on innovation, sustainability, and catering to the evolving needs and preferences of consumers.

Sports Bicycle Market Size

Request Free Sample

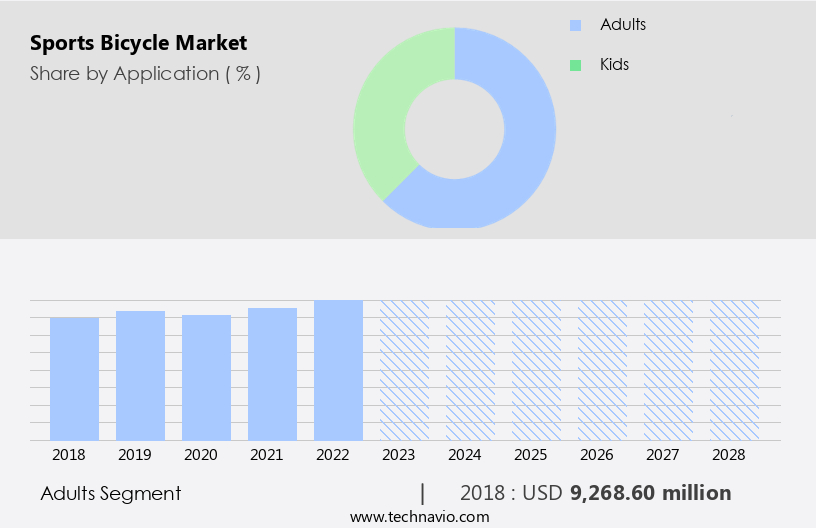
The Adults segment was valued at USD 9.27 billion in 2018 and showed a gradual increase during the forecast period.

Regional Analysis

North America is estimated to contribute 37% to the growth of the global market during the forecast period.Technavio's analysts have elaborately explained the regional trends and drivers that shape the market during the forecast period.

Sports Bicycle Market Share by Geography

 Request Free Sample

The North American the market holds a significant share in the global industry, driven by the increasing participation in cycling as a popular fitness trend. This region's growth is further fueled by the rising interest in recreational activities, such as mountain biking and road racing. Cycling organizations like the Adventure Cycling Association in the US promote cycling as a sustainable and eco-friendly transportation method, attracting a diverse range of consumers. Sustainable manufacturing practices are gaining momentum in the sports bicycle industry, with a focus on reducing carbon footprint and environmental impact. Supply chain management is optimized through efficient distribution networks and marketing campaigns, ensuring timely delivery and customer satisfaction.

Customization options, such as bike fitting and component upgrades, cater to consumer preferences. Bike maintenance is essential for the longevity and performance of sports bicycles. Services like bike repair and bike fitting contribute to the market's growth. Cycling events, both competitive and recreational, provide opportunities for brand loyalty and exposure. Direct-to-consumer sales and e-commerce platforms offer competitive pricing and convenience. Innovations in materials, such as carbon fiber frames and titanium frames, contribute to weight reduction and improved performance. Safety standards ensure consumer safety, while shock absorbers and suspension systems enhance the riding experience. Sales channels include retail stores, online sales, and bike sharing programs.

Bike pumps, rim brakes, hydraulic disc brakes, cycling apparel, and accessories like GPS tracking, cycling gloves, bike helmets, and bike lights cater to various consumer needs. Electric bikes (e-bikes) and folding bikes offer convenience and accessibility to a wider audience. Health benefits, such as improved cardiovascular health and mental wellbeing, continue to attract new cyclists. Bike racks, performance testing, inner tubes, and bike locks ensure the safe transportation and storage of sports bicycles. Consumer preferences for hybrid bikes and gravel bikes cater to diverse riding styles and terrains. Drivetrain efficiency and frame geometry are key factors in product innovation.

In summary, the market in North America is experiencing growth due to the increasing popularity of cycling as a form of exercise and recreation. Sustainable manufacturing practices, efficient supply chain management, and consumer-focused innovations are driving the market's evolution.

Market Dynamics

Our researchers analyzed the data with 2023 as the base year, along with the key drivers, trends, and challenges. A holistic analysis of drivers will help companies refine their marketing strategies to gain a competitive advantage.

The market caters to enthusiasts seeking high-performance, lightweight bikes for competitive cycling and fitness training. These bikes, featuring aerodynamic frames, carbon fiber components, and advanced suspension systems, are designed to optimize speed and agility. Key players in this market prioritize research and development to integrate innovative technologies, such as electronic shifting and power meters, enhancing rider experience. Consumers value durability, comfort, and customization, driving demand for sports bicycles with adjustable handlebars, ergonomic saddles, and personalized color schemes. Additionally, the market is fueled by the growing popularity of cycling events, including triathlons, century rides, and gran fondos, encouraging more individuals to invest in top-tier sports bicycles. Furthermore, the rise of e-bikes in the market offers an accessible option for those seeking a more inclusive and versatile cycling experience. Overall, the market continues to evolve, providing a dynamic and exciting space for both professionals and recreational riders.

What are the key market drivers leading to the rise in the adoption of Sports Bicycle Industry?

  • The primary factor fueling market growth is the upward trend in fuel prices. 
  • The market is experiencing growth due to various factors. One significant factor is the increasing focus on sustainable manufacturing and reducing carbon footprint. Consumers are becoming more environmentally conscious and prefer bicycles as a low-emission transportation alternative. This trend is driving demand for sports bicycles, particularly in regions with well-established supply chain management systems. Sports bicycles come in various types, including BMX bikes, steel frames, road bikes, and mountain bikes. Proper maintenance, such as wheel alignment and bottom bracket replacement, is essential to ensure the longevity of these bicycles. Brands are responding to consumer preferences by launching marketing campaigns and offering bike customization options.
  • The market is also witnessing advancements in technology, such as improved wheel alignment systems and lightweight materials. These innovations are enhancing the riding experience and increasing brand loyalty. Effective distribution networks are crucial for reaching consumers and ensuring timely delivery. Bike repair is an essential aspect of the market. Consumers often prefer to repair their bicycles rather than buying new ones, making bike repair a significant revenue stream for businesses. Overall, the market is expected to continue growing due to increasing consumer awareness, technological advancements, and a focus on sustainability.

What are the market trends shaping the Sports Bicycle Industry?

  • The development of innovative products is a mandatory trend in today's market. Professionals in various industries are focusing on creating new and advanced offerings to meet evolving consumer needs.
  • The market is experiencing significant growth due to technological advancements in bicycle design and accessories. companies are introducing innovative products, such as sports bicycles equipped with GPS tracking devices, lighter Body Armor like cycling gloves and apparel, and advanced braking systems, including rim brakes and hydraulic disc brakes. One recent development is SCOTT Sports SA's twinloc suspension system, launched in June 2021, which connects the shock, fork, and frame to provide traction control and lockout, addressing the issue of insufficient traction while riding.
  • Additionally, weight reduction is a key focus in the market, with titanium frames and component upgrades contributing to lighter, more efficient bicycles. Bike fitting services and gravel bikes are also gaining popularity, catering to the diverse needs of cycling enthusiasts. Drivetrain efficiency and aluminum frames are other areas of innovation, ensuring a smoother, more enjoyable cycling experience.

What challenges does the Sports Bicycle Industry face during its growth?

  • The escalating costs of raw materials pose a significant challenge to the industry's growth trajectory. 
  • The market faces challenges from increasing raw material costs, particularly for specialty materials like titanium and carbon fiber. These materials, which are essential for producing high-performance bicycles, are expensive due to their production processes. For instance, titanium, which is almost as strong as steel and as lightweight as aluminum, costs over USD32,000 per ton, significantly more than Carbon Steel's cost of under USD1,000 per ton. Component recycling is a potential solution to mitigate these rising costs. This practice involves refurbishing and reusing old bicycle parts, reducing the demand for new materials and lowering production costs.
  • Consumer preferences for eco-friendly practices and the availability of mobile apps for fitness monitoring and performance testing further boost the appeal of recycled components. Product innovation continues to be a key driver in the market, with advancements in cycling shoes, bike racks, bike lights, electric bikes (e-bikes), and folding bikes. Safety standards are also a critical consideration, with manufacturers focusing on enhancing safety features, such as improved braking systems and better frame designs. Inner tubes, a crucial component of bicycles, are also undergoing innovation, with manufacturers exploring alternatives to traditional rubber tubes, such as solid tires and self-sealing tubes.
  • Health benefits, such as improved cardiovascular health and reduced stress levels, continue to attract consumers to cycling as a fitness activity. Bike sharing programs and initiatives to promote cycling as a sustainable transportation option further expand the market's reach.

Exclusive Customer Landscape

The sports bicycle market forecasting report includes the adoption lifecycle of the market, covering from the innovator's stage to the laggard's stage. It focuses on adoption rates in different regions based on penetration. Furthermore, the sports bicycle market report also includes key purchase criteria and drivers of price sensitivity to help companies evaluate and develop their market growth analysis strategies.
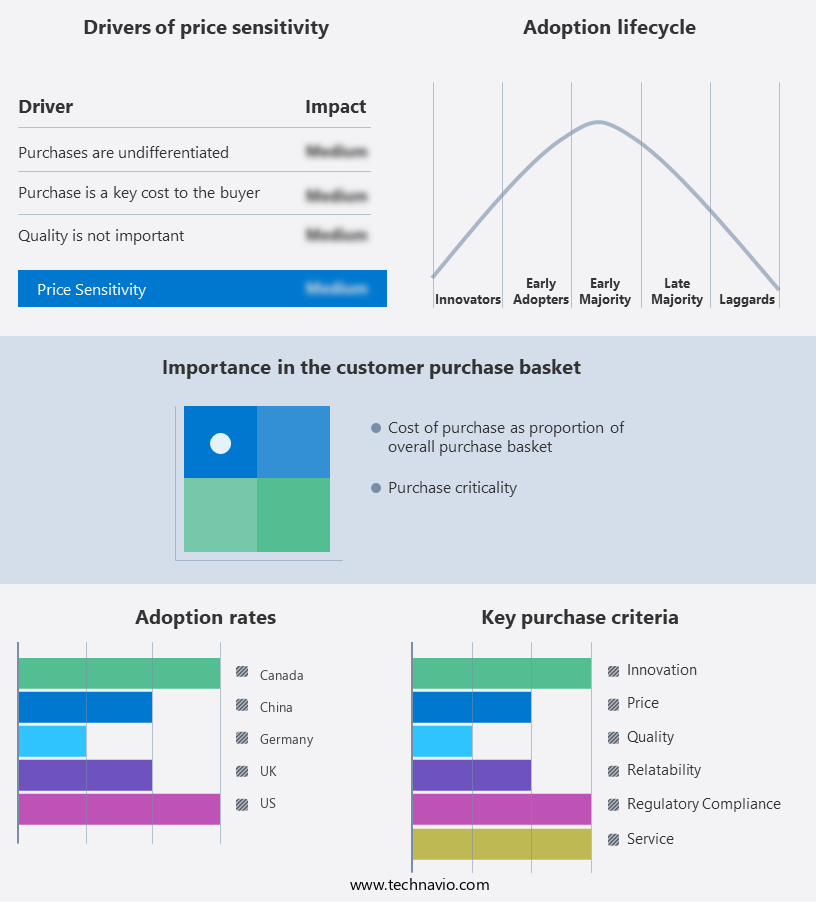
Sports Bicycle Market Share by Geography

 Customer Landscape

Key Companies & Market Insights

Companies are implementing various strategies, such as strategic alliances, sports bicycle market forecast, partnerships, mergers and acquisitions, geographical expansion, and product/service launches, to enhance their presence in the industry.

Accell Group NV - The company specializes in providing a diverse range of high-performance Sports bicycles from renowned brands such as Haibike, Winora, Ghost, Batavus, Koga, Lapierre, Raleigh, Sparta, Babboe, and Carqon.

The industry research and growth report includes detailed analyses of the competitive landscape of the market and information about key companies, including:

  • Accell Group NV
  • Advanced Sports Inc.
  • Alta Cycling Group
  • Dorel Industries Inc.
  • F.I.V.E. Bianchi Spa
  • Firmstrong Bikes
  • Giant Manufacturing Co. Ltd.
  • Hero MotoCorp Ltd
  • Jamis Bikes
  • Kona Bicycle Co.
  • Marin Mountain Bikes Inc.
  • Merida Industry Co. Ltd.
  • ORBEA S. COOP. LTDA
  • Pure Fix Cycles, LLC
  • R.C. Jenson, Inc.
  • Rockstar Industries
  • Seven Cycles Inc.
  • Tianjin Fuji ta Group Co. Ltd.
  • Trek Bicycle Corp.
  • Youngone Corp.

Qualitative and quantitative analysis of companies has been conducted to help clients understand the wider business environment as well as the strengths and weaknesses of key industry players. Data is qualitatively analyzed to categorize companies as pure play, category-focused, industry-focused, and diversified; it is quantitatively analyzed to categorize companies as dominant, leading, strong, tentative, and weak.

Recent Development and News in Sports Bicycle Market

  • In January 2024, Trek Bicycle Corporation, a leading player in the market, announced the launch of its new electric bicycle line, "E-Caliber," aimed at expanding its product offerings in response to growing consumer demand for e-bikes (Trek Bicycle Corporation Press Release, 2024).
  • In March 2024, Shimano Inc., a major component manufacturer, and Wahoo Fitness, a fitness technology company, entered into a strategic partnership to integrate Shimano's Di2 electronic shifting system with Wahoo's smart trainers and cycling apps (Shimano Inc. Press Release, 2024).
  • In May 2024, Specialized Bikes, a prominent sports bicycle manufacturer, completed the acquisition of S-Works, a high-performance components brand, to strengthen its product portfolio and improve its competitive position in the market (Specialized Bikes Press Release, 2024).
  • In April 2025, the European Union passed new regulations on the production and sale of bicycles, mandating stricter safety standards and eco-friendly manufacturing processes, which are expected to impact the entire sports bicycle industry (European Parliament Press Release, 2025).

Research Analyst Overview

  • The market is experiencing dynamic shifts, driven by advancements in technology and evolving consumer preferences. Power meters and smart bikes are revolutionizing performance tracking, while inventory and logistics management ensure efficient supply chain operations. Government regulations and safety standards prioritize product safety testing and certification. Customer segmentation strategies cater to diverse demographics, from heart rate monitors for fitness enthusiasts to bike trainers for home use. E-commerce optimization and virtual cycling platforms expand accessibility. Component standardization, GPS navigation, and digital marketing enhance the customer experience.
  • Sustainability initiatives, such as lightweight alloys and bike sharing programs, promote environmental consciousness. Supply chain resilience, pricing models, and competitive benchmarking ensure business agility. Performance testing, durability testing, and marketing analytics inform product development. Community engagement and social media marketing foster brand loyalty. Advanced materials, 3D printing, and bike lane infrastructure contribute to innovation. Safety regulations and component reliability safeguard consumer trust.

Dive into Technavio's robust research methodology, blending expert interviews, extensive data synthesis, and validated models for unparalleled Sports Bicycle Market insights. See full methodology.

Market Scope

Report Coverage

Details

Page number

165

Base year

2023

Historic period

2018-2022

Forecast period

2024-2028

Growth momentum & CAGR

Accelerate at a CAGR of 7.44%

Market growth 2024-2028

USD 7196 million

Market structure

Fragmented

YoY growth 2023-2024(%)

6.4

Key countries

US, Germany, China, Canada, and UK

Competitive landscape

Leading Companies, Market Positioning of Companies, Competitive Strategies, and Industry Risks

Request Free Sample

What are the Key Data Covered in this Sports Bicycle Market Research and Growth Report?

  • CAGR of the Sports Bicycle industry during the forecast period
  • Detailed information on factors that will drive the growth and forecasting between 2024 and 2028
  • Precise estimation of the size of the market and its contribution of the industry in focus to the parent market
  • Accurate predictions about upcoming growth and trends and changes in consumer behaviour
  • Growth of the market across North America, Europe, APAC, Middle East and Africa, and South America
  • Thorough analysis of the market's competitive landscape and detailed information about companies
  • Comprehensive analysis of factors that will challenge the sports bicycle market growth of industry companies

We can help! Our analysts can customize this sports bicycle market research report to meet your requirements.

Get in touch

1 Executive Summary

  • 1.1 Market overview
    • Executive Summary - Chart on Market Overview
    • Executive Summary - Data Table on Market Overview
    • Executive Summary - Chart on Global Market Characteristics
    • Executive Summary - Chart on Market by Geography
    • Executive Summary - Chart on Market Segmentation by Application
    • Executive Summary - Chart on Market Segmentation by Product
    • Executive Summary - Chart on Incremental Growth
    • Executive Summary - Data Table on Incremental Growth
    • Executive Summary - Chart on Company Market Positioning

2 Market Landscape

  • 2.1 Market ecosystem
    • Parent Market
    • Data Table on - Parent Market
  • 2.2 Market characteristics
    • Market characteristics analysis
  • 2.3 Value chain analysis
    • Value Chain Analysis

3 Market Sizing

  • 3.1 Market definition
    • Offerings of companies included in the market definition
  • 3.2 Market segment analysis
    • Market segments
  • 3.3 Market size 2023
    • 3.4 Market outlook: Forecast for 2023-2028
      • Chart on Global - Market size and forecast 2023-2028 ($ million)
      • Data Table on Global - Market size and forecast 2023-2028 ($ million)
      • Chart on Global Market: Year-over-year growth 2023-2028 (%)
      • Data Table on Global Market: Year-over-year growth 2023-2028 (%)

    4 Historic Market Size

    • 4.1 Global Sports Bicycle Market 2018 - 2022
      • Historic Market Size - Data Table on Global Sports Bicycle Market 2018 - 2022 ($ million)
    • 4.2 Application segment analysis 2018 - 2022
      • Historic Market Size - Application Segment 2018 - 2022 ($ million)
    • 4.3 Product segment analysis 2018 - 2022
      • Historic Market Size - Product Segment 2018 - 2022 ($ million)
    • 4.4 Geography segment analysis 2018 - 2022
      • Historic Market Size - Geography Segment 2018 - 2022 ($ million)
    • 4.5 Country segment analysis 2018 - 2022
      • Historic Market Size - Country Segment 2018 - 2022 ($ million)

    5 Five Forces Analysis

    • 5.1 Five forces summary
      • Five forces analysis - Comparison between 2023 and 2028
    • 5.2 Bargaining power of buyers
      • Bargaining power of buyers - Impact of key factors 2023 and 2028
    • 5.3 Bargaining power of suppliers
      • Bargaining power of suppliers - Impact of key factors in 2023 and 2028
    • 5.4 Threat of new entrants
      • Threat of new entrants - Impact of key factors in 2023 and 2028
    • 5.5 Threat of substitutes
      • Threat of substitutes - Impact of key factors in 2023 and 2028
    • 5.6 Threat of rivalry
      • Threat of rivalry - Impact of key factors in 2023 and 2028
    • 5.7 Market condition
      • Chart on Market condition - Five forces 2023 and 2028

    6 Market Segmentation by Application

    • 6.1 Market segments
      • Chart on Application - Market share (2023-2028) (%)
      • Data Table on Application - Market share (2023-2028) (%)
    • 6.2 Comparison by Application
      • Chart on Comparison by Application
      • Data Table on Comparison by Application
    • 6.3 Adults - Market size and forecast (2023-2028)
      • Chart on Adults - Market size and forecast (2023-2028) ($ million)
      • Data Table on Adults - Market size and forecast (2023-2028) ($ million)
      • Chart on Adults - Year-over-year growth (2023-2028) (%)
      • Data Table on Adults - Year-over-year growth (2023-2028) (%)
    • 6.4 Kids - Market size and forecast (2023-2028)
      • Chart on Kids - Market size and forecast (2023-2028) ($ million)
      • Data Table on Kids - Market size and forecast (2023-2028) ($ million)
      • Chart on Kids - Year-over-year growth (2023-2028) (%)
      • Data Table on Kids - Year-over-year growth (2023-2028) (%)
    • 6.5 Market opportunity by Application
      • Market opportunity by Application ($ million)
      • Data Table on Market opportunity by Application ($ million)

    7 Market Segmentation by Product

    • 7.1 Market segments
      • Chart on Product - Market share (2023-2028) (%)
      • Data Table on Product - Market share (2023-2028) (%)
    • 7.2 Comparison by Product
      • Chart on Comparison by Product
      • Data Table on Comparison by Product
    • 7.3 Mountain bicycles - Market size and forecast (2023-2028)
      • Chart on Mountain bicycles - Market size and forecast (2023-2028) ($ million)
      • Data Table on Mountain bicycles - Market size and forecast (2023-2028) ($ million)
      • Chart on Mountain bicycles - Year-over-year growth (2023-2028) (%)
      • Data Table on Mountain bicycles - Year-over-year growth (2023-2028) (%)
    • 7.4 Cyclo-cross bicycles - Market size and forecast (2023-2028)
      • Chart on Cyclo-cross bicycles - Market size and forecast (2023-2028) ($ million)
      • Data Table on Cyclo-cross bicycles - Market size and forecast (2023-2028) ($ million)
      • Chart on Cyclo-cross bicycles - Year-over-year growth (2023-2028) (%)
      • Data Table on Cyclo-cross bicycles - Year-over-year growth (2023-2028) (%)
    • 7.5 Road racing bicycles - Market size and forecast (2023-2028)
      • Chart on Road racing bicycles - Market size and forecast (2023-2028) ($ million)
      • Data Table on Road racing bicycles - Market size and forecast (2023-2028) ($ million)
      • Chart on Road racing bicycles - Year-over-year growth (2023-2028) (%)
      • Data Table on Road racing bicycles - Year-over-year growth (2023-2028) (%)
    • 7.6 Track bicycles - Market size and forecast (2023-2028)
      • Chart on Track bicycles - Market size and forecast (2023-2028) ($ million)
      • Data Table on Track bicycles - Market size and forecast (2023-2028) ($ million)
      • Chart on Track bicycles - Year-over-year growth (2023-2028) (%)
      • Data Table on Track bicycles - Year-over-year growth (2023-2028) (%)
    • 7.7 Market opportunity by Product
      • Market opportunity by Product ($ million)
      • Data Table on Market opportunity by Product ($ million)

    8 Market Segmentation by End-User

    • 8.1 Market segments
      • Chart on End-User - Market share (2023-2028) (%)
      • Data Table on End-User - Market share (2023-2028) (%)
    • 8.2 Comparison by End-User
      • Chart on Comparison by End-User
      • Data Table on Comparison by End-User
    • 8.3 Recreational Cyclists - Market size and forecast (2023-2028)
      • Chart on Recreational Cyclists - Market size and forecast (2023-2028) ($ million)
      • Data Table on Recreational Cyclists - Market size and forecast (2023-2028) ($ million)
      • Chart on Recreational Cyclists - Year-over-year growth (2023-2028) (%)
      • Data Table on Recreational Cyclists - Year-over-year growth (2023-2028) (%)
    • 8.4 Professional Athletes - Market size and forecast (2023-2028)
      • Chart on Professional Athletes - Market size and forecast (2023-2028) ($ million)
      • Data Table on Professional Athletes - Market size and forecast (2023-2028) ($ million)
      • Chart on Professional Athletes - Year-over-year growth (2023-2028) (%)
      • Data Table on Professional Athletes - Year-over-year growth (2023-2028) (%)
    • 8.5 Commuters - Market size and forecast (2023-2028)
      • Chart on Commuters - Market size and forecast (2023-2028) ($ million)
      • Data Table on Commuters - Market size and forecast (2023-2028) ($ million)
      • Chart on Commuters - Year-over-year growth (2023-2028) (%)
      • Data Table on Commuters - Year-over-year growth (2023-2028) (%)
    • 8.6 Market opportunity by End-User
      • Market opportunity by End-User ($ million)
      • Data Table on Market opportunity by End-User ($ million)

    9 Market Segmentation by Distribution Channel

    • 9.1 Market segments
      • Chart on Distribution Channel - Market share (2023-2028) (%)
      • Data Table on Distribution Channel - Market share (2023-2028) (%)
    • 9.2 Comparison by Distribution Channel
      • Chart on Comparison by Distribution Channel
      • Data Table on Comparison by Distribution Channel
    • 9.3 Specialty Stores - Market size and forecast (2023-2028)
      • Chart on Specialty Stores - Market size and forecast (2023-2028) ($ million)
      • Data Table on Specialty Stores - Market size and forecast (2023-2028) ($ million)
      • Chart on Specialty Stores - Year-over-year growth (2023-2028) (%)
      • Data Table on Specialty Stores - Year-over-year growth (2023-2028) (%)
    • 9.4 Online Retail - Market size and forecast (2023-2028)
      • Chart on Online Retail - Market size and forecast (2023-2028) ($ million)
      • Data Table on Online Retail - Market size and forecast (2023-2028) ($ million)
      • Chart on Online Retail - Year-over-year growth (2023-2028) (%)
      • Data Table on Online Retail - Year-over-year growth (2023-2028) (%)
    • 9.5 Direct Sales - Market size and forecast (2023-2028)
      • Chart on Direct Sales - Market size and forecast (2023-2028) ($ million)
      • Data Table on Direct Sales - Market size and forecast (2023-2028) ($ million)
      • Chart on Direct Sales - Year-over-year growth (2023-2028) (%)
      • Data Table on Direct Sales - Year-over-year growth (2023-2028) (%)
    • 9.6 Market opportunity by Distribution Channel
      • Market opportunity by Distribution Channel ($ million)
      • Data Table on Market opportunity by Distribution Channel ($ million)

    10 Market Segmentation by Material Type

    • 10.1 Market segments
      • Chart on Material Type - Market share (2023-2028) (%)
      • Data Table on Material Type - Market share (2023-2028) (%)
    • 10.2 Comparison by Material Type
      • Chart on Comparison by Material Type
      • Data Table on Comparison by Material Type
    • 10.3 Carbon Fiber - Market size and forecast (2023-2028)
      • Chart on Carbon Fiber - Market size and forecast (2023-2028) ($ million)
      • Data Table on Carbon Fiber - Market size and forecast (2023-2028) ($ million)
      • Chart on Carbon Fiber - Year-over-year growth (2023-2028) (%)
      • Data Table on Carbon Fiber - Year-over-year growth (2023-2028) (%)
    • 10.4 Aluminum - Market size and forecast (2023-2028)
      • Chart on Aluminum - Market size and forecast (2023-2028) ($ million)
      • Data Table on Aluminum - Market size and forecast (2023-2028) ($ million)
      • Chart on Aluminum - Year-over-year growth (2023-2028) (%)
      • Data Table on Aluminum - Year-over-year growth (2023-2028) (%)
    • 10.5 Steel - Market size and forecast (2023-2028)
      • Chart on Steel - Market size and forecast (2023-2028) ($ million)
      • Data Table on Steel - Market size and forecast (2023-2028) ($ million)
      • Chart on Steel - Year-over-year growth (2023-2028) (%)
      • Data Table on Steel - Year-over-year growth (2023-2028) (%)
    • 10.6 Titanium - Market size and forecast (2023-2028)
      • Chart on Titanium - Market size and forecast (2023-2028) ($ million)
      • Data Table on Titanium - Market size and forecast (2023-2028) ($ million)
      • Chart on Titanium - Year-over-year growth (2023-2028) (%)
      • Data Table on Titanium - Year-over-year growth (2023-2028) (%)
    • 10.7 Market opportunity by Material Type
      • Market opportunity by Material Type ($ million)
      • Data Table on Market opportunity by Material Type ($ million)

    11 Customer Landscape

    • 11.1 Customer landscape overview
      • Analysis of price sensitivity, lifecycle, customer purchase basket, adoption rates, and purchase criteria

    12 Geographic Landscape

    • 12.1 Geographic segmentation
      • Chart on Market share by geography 2023-2028 (%)
      • Data Table on Market share by geography 2023-2028 (%)
    • 12.2 Geographic comparison
      • Chart on Geographic comparison
      • Data Table on Geographic comparison
    • 12.3 North America - Market size and forecast 2023-2028
      • Chart on North America - Market size and forecast 2023-2028 ($ million)
      • Data Table on North America - Market size and forecast 2023-2028 ($ million)
      • Chart on North America - Year-over-year growth 2023-2028 (%)
      • Data Table on North America - Year-over-year growth 2023-2028 (%)
    • 12.4 Europe - Market size and forecast 2023-2028
      • Chart on Europe - Market size and forecast 2023-2028 ($ million)
      • Data Table on Europe - Market size and forecast 2023-2028 ($ million)
      • Chart on Europe - Year-over-year growth 2023-2028 (%)
      • Data Table on Europe - Year-over-year growth 2023-2028 (%)
    • 12.5 APAC - Market size and forecast 2023-2028
      • Chart on APAC - Market size and forecast 2023-2028 ($ million)
      • Data Table on APAC - Market size and forecast 2023-2028 ($ million)
      • Chart on APAC - Year-over-year growth 2023-2028 (%)
      • Data Table on APAC - Year-over-year growth 2023-2028 (%)
    • 12.6 Middle East and Africa - Market size and forecast 2023-2028
      • Chart on Middle East and Africa - Market size and forecast 2023-2028 ($ million)
      • Data Table on Middle East and Africa - Market size and forecast 2023-2028 ($ million)
      • Chart on Middle East and Africa - Year-over-year growth 2023-2028 (%)
      • Data Table on Middle East and Africa - Year-over-year growth 2023-2028 (%)
    • 12.7 South America - Market size and forecast 2023-2028
      • Chart on South America - Market size and forecast 2023-2028 ($ million)
      • Data Table on South America - Market size and forecast 2023-2028 ($ million)
      • Chart on South America - Year-over-year growth 2023-2028 (%)
      • Data Table on South America - Year-over-year growth 2023-2028 (%)
    • 12.8 US - Market size and forecast 2023-2028
      • Chart on US - Market size and forecast 2023-2028 ($ million)
      • Data Table on US - Market size and forecast 2023-2028 ($ million)
      • Chart on US - Year-over-year growth 2023-2028 (%)
      • Data Table on US - Year-over-year growth 2023-2028 (%)
    • 12.9 Germany - Market size and forecast 2023-2028
      • Chart on Germany - Market size and forecast 2023-2028 ($ million)
      • Data Table on Germany - Market size and forecast 2023-2028 ($ million)
      • Chart on Germany - Year-over-year growth 2023-2028 (%)
      • Data Table on Germany - Year-over-year growth 2023-2028 (%)
    • 12.10 China - Market size and forecast 2023-2028
      • Chart on China - Market size and forecast 2023-2028 ($ million)
      • Data Table on China - Market size and forecast 2023-2028 ($ million)
      • Chart on China - Year-over-year growth 2023-2028 (%)
      • Data Table on China - Year-over-year growth 2023-2028 (%)
    • 12.11 Canada - Market size and forecast 2023-2028
      • Chart on Canada - Market size and forecast 2023-2028 ($ million)
      • Data Table on Canada - Market size and forecast 2023-2028 ($ million)
      • Chart on Canada - Year-over-year growth 2023-2028 (%)
      • Data Table on Canada - Year-over-year growth 2023-2028 (%)
    • 12.12 UK - Market size and forecast 2023-2028
      • Chart on UK - Market size and forecast 2023-2028 ($ million)
      • Data Table on UK - Market size and forecast 2023-2028 ($ million)
      • Chart on UK - Year-over-year growth 2023-2028 (%)
      • Data Table on UK - Year-over-year growth 2023-2028 (%)
    • 12.13 Market opportunity by geography
      • Market opportunity by geography ($ million)
      • Data Tables on Market opportunity by geography ($ million)
    • 12.14 France - Market size and forecast (2023-2028)
      • Chart on France - Market size and forecast (2023-2028) ($ million)
      • Data Table on France - Market size and forecast (2023-2028) ($ million)
      • Chart on France - Year-over-year growth (2023-2028) (%)
      • Data Table on France - Year-over-year growth (2023-2028) (%)
    • 12.15 Italy - Market size and forecast (2023-2028)
      • Chart on Italy - Market size and forecast (2023-2028) ($ million)
      • Data Table on Italy - Market size and forecast (2023-2028) ($ million)
      • Chart on Italy - Year-over-year growth (2023-2028) (%)
      • Data Table on Italy - Year-over-year growth (2023-2028) (%)
    • 12.16 Saudi Arabia - Market size and forecast (2023-2028)
      • Chart on Saudi Arabia - Market size and forecast (2023-2028) ($ million)
      • Data Table on Saudi Arabia - Market size and forecast (2023-2028) ($ million)
      • Chart on Saudi Arabia - Year-over-year growth (2023-2028) (%)
      • Data Table on Saudi Arabia - Year-over-year growth (2023-2028) (%)
    • 12.17 The Netherlands - Market size and forecast (2023-2028)
      • Chart on The Netherlands - Market size and forecast (2023-2028) ($ million)
      • Data Table on The Netherlands - Market size and forecast (2023-2028) ($ million)
      • Chart on The Netherlands - Year-over-year growth (2023-2028) (%)
      • Data Table on The Netherlands - Year-over-year growth (2023-2028) (%)
    • 12.18 Japan - Market size and forecast (2023-2028)
      • Chart on Japan - Market size and forecast (2023-2028) ($ million)
      • Data Table on Japan - Market size and forecast (2023-2028) ($ million)
      • Chart on Japan - Year-over-year growth (2023-2028) (%)
      • Data Table on Japan - Year-over-year growth (2023-2028) (%)
    • 12.19 Brazil - Market size and forecast (2023-2028)
      • Chart on Brazil - Market size and forecast (2023-2028) ($ million)
      • Data Table on Brazil - Market size and forecast (2023-2028) ($ million)
      • Chart on Brazil - Year-over-year growth (2023-2028) (%)
      • Data Table on Brazil - Year-over-year growth (2023-2028) (%)
    • 12.20 UAE - Market size and forecast (2023-2028)
      • Chart on UAE - Market size and forecast (2023-2028) ($ million)
      • Data Table on UAE - Market size and forecast (2023-2028) ($ million)
      • Chart on UAE - Year-over-year growth (2023-2028) (%)
      • Data Table on UAE - Year-over-year growth (2023-2028) (%)
    • 12.21 Mexico - Market size and forecast (2023-2028)
      • Chart on Mexico - Market size and forecast (2023-2028) ($ million)
      • Data Table on Mexico - Market size and forecast (2023-2028) ($ million)
      • Chart on Mexico - Year-over-year growth (2023-2028) (%)
      • Data Table on Mexico - Year-over-year growth (2023-2028) (%)
    • 12.22 India - Market size and forecast (2023-2028)
      • Chart on India - Market size and forecast (2023-2028) ($ million)
      • Data Table on India - Market size and forecast (2023-2028) ($ million)
      • Chart on India - Year-over-year growth (2023-2028) (%)
      • Data Table on India - Year-over-year growth (2023-2028) (%)
    • 12.23 Australia - Market size and forecast (2023-2028)
      • Chart on Australia - Market size and forecast (2023-2028) ($ million)
      • Data Table on Australia - Market size and forecast (2023-2028) ($ million)
      • Chart on Australia - Year-over-year growth (2023-2028) (%)
      • Data Table on Australia - Year-over-year growth (2023-2028) (%)
    • 12.24 Rest of World (ROW) - Market size and forecast (2023-2028)
      • Chart on Rest of World (ROW) - Market size and forecast (2023-2028) ($ million)
      • Data Table on Rest of World (ROW) - Market size and forecast (2023-2028) ($ million)
      • Chart on Rest of World (ROW) - Year-over-year growth (2023-2028) (%)
      • Data Table on Rest of World (ROW) - Year-over-year growth (2023-2028) (%)

    13 Drivers, Challenges, and Opportunity/Restraints

    • 13.1 Market drivers
      • 13.2 Market challenges
        • 13.3 Impact of drivers and challenges
          • Impact of drivers and challenges in 2023 and 2028
        • 13.4 Market opportunities/restraints

          14 Competitive Landscape

          • 14.1 Overview
            • 14.2 Competitive Landscape
              • Overview on criticality of inputs and factors of differentiation
            • 14.3 Landscape disruption
              • Overview on factors of disruption
            • 14.4 Industry risks
              • Impact of key risks on business

            15 Competitive Analysis

            • 15.1 Companies profiled
              • Companies covered
            • 15.2 Market positioning of companies
              • Matrix on companies position and classification
            • 15.3 Accell Group NV
              • Accell Group NV - Overview
              • Accell Group NV - Business segments
              • Accell Group NV - Key offerings
              • Accell Group NV - Segment focus
            • 15.4 Advanced Sports Inc.
              • Advanced Sports Inc. - Overview
              • Advanced Sports Inc. - Product / Service
              • Advanced Sports Inc. - Key offerings
            • 15.5 Alta Cycling Group
              • Alta Cycling Group - Overview
              • Alta Cycling Group - Product / Service
              • Alta Cycling Group - Key offerings
            • 15.6 Dorel Industries Inc.
              • Dorel Industries Inc. - Overview
              • Dorel Industries Inc. - Business segments
              • Dorel Industries Inc. - Key offerings
              • Dorel Industries Inc. - Segment focus
            • 15.7 Giant Manufacturing Co. Ltd.
              • Giant Manufacturing Co. Ltd. - Overview
              • Giant Manufacturing Co. Ltd. - Business segments
              • Giant Manufacturing Co. Ltd. - Key offerings
              • Giant Manufacturing Co. Ltd. - Segment focus
            • 15.8 Hero MotoCorp Ltd
              • Hero MotoCorp Ltd - Overview
              • Hero MotoCorp Ltd - Product / Service
              • Hero MotoCorp Ltd - Key offerings
            • 15.9 Jamis Bikes
              • Jamis Bikes - Overview
              • Jamis Bikes - Product / Service
              • Jamis Bikes - Key offerings
            • 15.10 Kona Bicycle Co.
              • Kona Bicycle Co. - Overview
              • Kona Bicycle Co. - Product / Service
              • Kona Bicycle Co. - Key offerings
            • 15.11 Marin Mountain Bikes Inc.
              • Marin Mountain Bikes Inc. - Overview
              • Marin Mountain Bikes Inc. - Product / Service
              • Marin Mountain Bikes Inc. - Key offerings
            • 15.12 Merida Industry Co. Ltd.
              • Merida Industry Co. Ltd. - Overview
              • Merida Industry Co. Ltd. - Business segments
              • Merida Industry Co. Ltd. - Key offerings
              • Merida Industry Co. Ltd. - Segment focus
            • 15.13 Pure Fix Cycles, LLC
              • Pure Fix Cycles, LLC - Overview
              • Pure Fix Cycles, LLC - Product / Service
              • Pure Fix Cycles, LLC - Key offerings
            • 15.14 R.C. Jenson, Inc.
              • R.C. Jenson, Inc. - Overview
              • R.C. Jenson, Inc. - Product / Service
              • R.C. Jenson, Inc. - Key offerings
            • 15.15 Seven Cycles Inc.
              • Seven Cycles Inc. - Overview
              • Seven Cycles Inc. - Product / Service
              • Seven Cycles Inc. - Key offerings
            • 15.16 Tianjin Fuji ta Group Co. Ltd.
              • Tianjin Fuji ta Group Co. Ltd. - Overview
              • Tianjin Fuji ta Group Co. Ltd. - Product / Service
              • Tianjin Fuji ta Group Co. Ltd. - Key offerings
            • 15.17 Youngone Corp.
              • Youngone Corp. - Overview
              • Youngone Corp. - Product / Service
              • Youngone Corp. - Key offerings

            16 Appendix

            • 16.1 Scope of the report
              • 16.2 Inclusions and exclusions checklist
                • Inclusions checklist
                • Exclusions checklist
              • 16.3 Currency conversion rates for US$
                • Currency conversion rates for US$
              • 16.4 Research methodology
                • Research methodology
              • 16.5 Data procurement
                • Information sources
              • 16.6 Data validation
                • Data validation
              • 16.7 Validation techniques employed for market sizing
                • Validation techniques employed for market sizing
              • 16.8 Data synthesis
                • Data synthesis
              • 16.9 360 degree market analysis
                • 360 degree market analysis
              • 16.10 List of abbreviations
                • List of abbreviations

              Research Methodology

              Technavio presents a detailed picture of the market by way of study, synthesis, and summation of data from multiple sources. The analysts have presented the various facets of the market with a particular focus on identifying the key industry influencers. The data thus presented is comprehensive, reliable, and the result of extensive research, both primary and secondary.

              INFORMATION SOURCES

              Primary sources

              • Manufacturers and suppliers
              • Channel partners
              • Industry experts
              • Strategic decision makers

              Secondary sources

              • Industry journals and periodicals
              • Government data
              • Financial reports of key industry players
              • Historical data
              • Press releases

              DATA ANALYSIS

              Data Synthesis

              • Collation of data
              • Estimation of key figures
              • Analysis of derived insights

              Data Validation

              • Triangulation with data models
              • Reference against proprietary databases
              • Corroboration with industry experts

              REPORT WRITING

              Qualitative

              • Market drivers
              • Market challenges
              • Market trends
              • Five forces analysis

              Quantitative

              • Market size and forecast
              • Market segmentation
              • Geographical insights
              • Competitive landscape

              Interested in this report?

              Get your sample now to see our research methodology and insights!

              Download Now

              Frequently Asked Questions

              Sports Bicycle market growth will increase by $ 7196 mn during 2024-2028 .

              The Sports Bicycle market is expected to grow at a CAGR of 7.44% during 2024-2028 .

              Sports Bicycle market is segmented by Application( Adults, Kids) Product( Mountain bicycles, Cyclo-cross bicycles, Road racing bicycles, Track bicycles, South America)

              Accell Group NV, Advanced Sports Inc., Alta Cycling Group, Dorel Industries Inc., F.I.V.E. Bianchi Spa, Firmstrong Bikes, Giant Manufacturing Co. Ltd., Hero MotoCorp Ltd, Jamis Bikes, Kona Bicycle Co., Marin Mountain Bikes Inc., Merida Industry Co. Ltd., ORBEA S. COOP. LTDA, Pure Fix Cycles, LLC, R.C. Jenson, Inc., Rockstar Industries, Seven Cycles Inc., Tianjin Fuji ta Group Co. Ltd., Trek Bicycle Corp., Youngone Corp. are a few of the key vendors in the Sports Bicycle market.

              North America will register the highest growth rate of 37% among the other regions. Therefore, the Sports Bicycle market in North America is expected to garner significant business opportunities for the vendors during the forecast period.

              US, Germany, UK, France, Italy, Canada, China, Saudi Arabia, The Netherlands, Japan, Brazil, UAE, Mexico, India, Australia

              • Increasing fuel pricesFuel price increased significantly in recent years and continues to fluctuate. According to the US Energy Information Administration is the driving factor this market.
              • the average price of crude oil was $70.68 in 2021 and is expected to be $107.6 by 2022. With an increase in the price of fuel is the driving factor this market.
              • the demand for sports bicycles has increased. Sports bicycles are equipped with gear that helps manage speeds better and make riding on mountain trails is the driving factor this market.
              • overpasses is the driving factor this market.
              • and rough roads easier. Most people in Europe now prefer to use a bicycle to commute to work is the driving factor this market.
              • particularly with city governments constructing bike-friendly streets. Thereby is the driving factor this market.
              • such factors are expected to contribute to the growth of the global sports bicycle market during the forecast period. is the driving factor this market.

              The Sports Bicycle market vendors should focus on grabbing business opportunities from the Adults segment as it accounted for the largest market share in the base year.