Stationary Generator Market Size 2024-2028
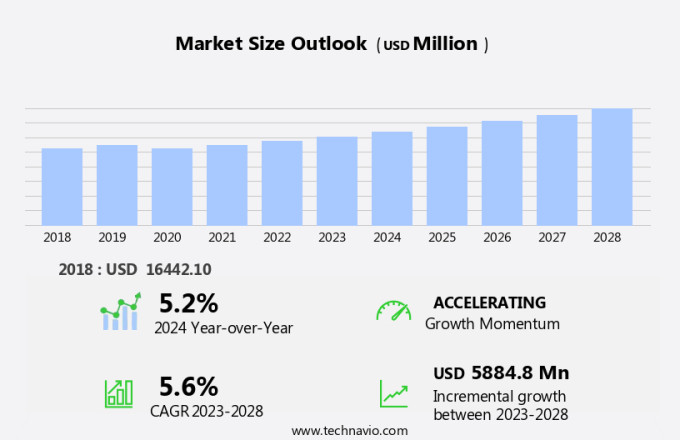
The stationary generator market size is forecast to increase by USD 5.88 billion at a CAGR of 5.6% between 2023 and 2028.
- The market is witnessing significant growth due to the rising demand for uninterrupted power supply. Technological advances in generator technology, including fuel efficiency and emissions reduction, are driving market growth. Additionally, the availability of alternatives for power backup, such as solar and wind energy, is increasing the adoption of stationary generators. These trends are expected to continue, with the market expected to grow steadily in the coming years. Furthermore, the increasing demand for reliable power sources in various industries, including healthcare, telecommunications, and data centers, is also fueling market growth. Despite these opportunities, challenges remain, including the high initial investment costs and the need for regular maintenance.Overall, the market is poised for growth, driven by the need for reliable power sources and technological advancements.
What will be the Size of the Stationary Generator Market During the Forecast Period?
- The market experiences significant growth due to the increasing demand for reliable power backup solutions, particularly in sectors vulnerable to extreme weather events and inadequate power infrastructure. The construction sector, mining activities, and telecommunications are key industries relying on stationary genersets to ensure continuous operation and uninterrupted power supply. Extreme weather conditions and natural disasters pose a threat to electricity demand, leading to grid outages and power instability. In remote locations, where power infrastructure is liergy technology and emission regulations are shaping the market's future direction.
How is this Stationary Generator Industry segmented and which is the largest segment?
The stationary generator industry research report provides comprehensive data (region-wise segment analysis), with forecasts and estimates in "USD million" for the period 2024-2028, as well as historical data from 2018-2022 for the following segments.
- Product
- Diesel
- Gas
- Type
- Less than 300 kW
- Greater than 800 kW
- 301 kW to 800 kW
- Geography
- APAC
- China
- India
- Japan
- South Korea
- North America
- Mexico
- US
- Europe
- Germany
- UK
- France
- Middle East and Africa
- South America
- APAC
By Product Insights
- The diesel segment is estimated to witness significant growth during the forecast period.
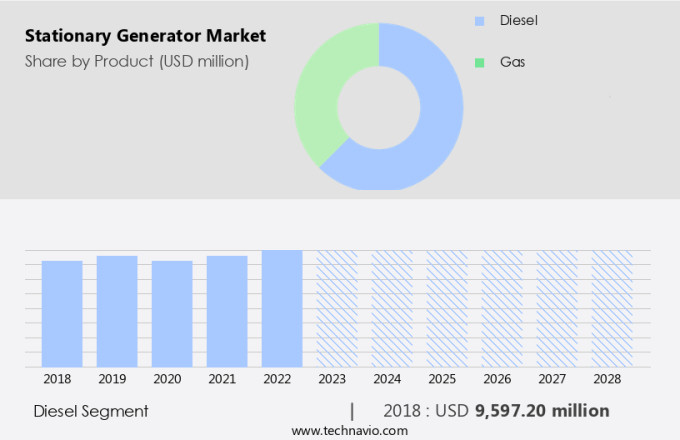
Stationary generators, particularly those with lower power ratings, primarily utilize diesel fuel for operation, whereas industrial generators predominantly rely on diesel over gasoline. Diesel generators offer several advantages, including less maintenance requirements and extended lifetimes due to their operation at low temperatures and speeds. The cost-effectiveness of diesel generators over their long-term ownership further enhances their appeal among industrial contractors and commercial buildings. However, environmental concerns surrounding CO? emissions from diesel generators and the rising adoption of eco-friendly energy sources have led to an increasing preference for natural gas-powered generators.
Get a glance at the Stationary Generator Industry report of share of various segments Request Free Sample
The Diesel segment was valued at USD 9597.20 million in 2018 and showed a gradual increase during the forecast period.
Regional Analysis
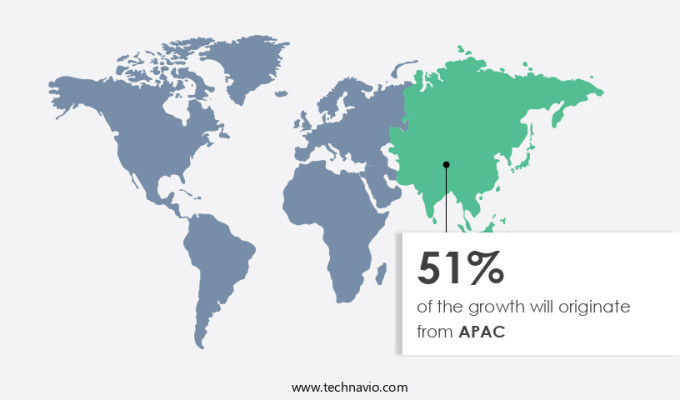
- APAC is estimated to contribute 51% to the growth of the global market during the forecast period.
Technavio's analysts have elaborately explained the regional trends and drivers that shape the market during the forecast period.
For more insights on the market share of various regions, Request Free Sample
In Asia-Pacific (APAC), the escalating electricity demand resulting from industrialization and rising per capita power consumption has put significant pressure on the existing power infrastructure. Many countries in the region, such as Myanmar, Pakistan, and Bangladesh, face frequent power outages due to inadequate electricity generation. This situation has led to a surge in demand for stationary generators to provide backup power and offset regular power fluctuations. The commercial and telecommunications sectors, which are expanding rapidly in APAC, further boost the demand for reliable power sources. The increasing need for uninterrupted power supply, particularly during severe weather events, underscores the importance of stationary generators in the region. Consequently, the market in APAC is experiencing significant growth.
Market Dynamics
Our stationary generator market researchers analyzed the data with 2023 as the base year, along with the key drivers, trends, and challenges. A holistic analysis of drivers will help companies refine their marketing strategies to gain a competitive advantage.
What are the key market drivers leading to the rise in adoption of Stationary Generator Industry?
Rising demand for uninterrupted power is the key driver of the market.
- The market is experiencing significant growth due to the increasing electricity demand and inadequate power infrastructure, particularly in the construction sector and remote locations. Extreme weather events, such as hurricanes and blizzards, have led to an increased need for backup power solutions, including diesel and natural gas generators. Fossil fuels, including diesel and natural gas, continue to dominate the market due to their reliability and ability to provide continuous power during power instability and grid outages. However, emission regulations are driving the demand for sustainable energy solutions, such as renewable energy technology. The mining, oil and gas, transportation, telecommunications, and data center industries are major consumers of stationary generators, especially during peak-load and standby situations.
- The market is expected to grow further as the demand for reliable electricity increases in various sectors, including electric power generation, marine, and fossil fuel exploration. The use of stationary generators provides uninterrupted power supply during natural disasters and power interruptions, making them essential for various industries and applications.
What are the market trends shaping the Stationary Generator Industry?
Technological advances in generators is the upcoming trend in the market.
- The market has experienced significant fluctuations due to the volatility in fuel prices, particularly those of fossil fuels like diesel and natural gas. Extreme weather events and inadequate power infrastructure have led to an increased demand for reliable electricity sources in various sectors, including construction, mining, telecommunications, and data centers. Fossil fuel exploration in oil and gas industries and transportation sectors further contribute to the demand for stationary generators. Technological advancements have provided solutions to mitigate the high fuel costs. Dual-fuel and tri-fuel systems have gained popularity as they enable diesel engines to operate on natural gas, offering cost savings and operational reliability.
- Grid outages and power interruptions caused by natural disasters and power instability have accelerated the adoption of backup power solutions like diesel and natural gas generators. Moreover, emission regulations and the push towards sustainable energy solutions have led to the increased use of renewable energy technology in electricity generation. However, the intermittent nature of renewable energy sources necessitates the use of stationary generators to ensure uninterrupted power supply in remote locations and during peak-load or standby situations. The market for stationary generators is expected to grow as the demand for clean energy technologies continues to rise. In conclusion, the market is influenced by various factors, including fuel prices, extreme weather events, electricity demand, and the need for reliable electricity sources.Technological advancements have provided cost-effective and operationally reliable solutions, making stationary generators a vital component of the electricity generation landscape.
What challenges does Stationary Generator Industry face during the growth?
Availability of alternatives for power backup is a key challenge affecting the industry growth.
- The market has experienced significant growth due to the increasing demand for reliable electricity, especially in regions prone to Extreme Weather Events and inadequate power infrastructure. Traditional fossil fuel-based generators, such as diesel and natural gas, continue to dominate the market, but their high fuel costs, emission regulations, and maintenance requirements have led to a surge in demand for sustainable energy solutions. The construction sector, telecommunications, mining activities, oil and gas exploration, transportation, and data centers are key industries driving the demand for backup power solutions. Renewable energy technologies, such as solar and wind, are increasingly being adopted for primary power generation, but they require backup power during power interruptions and grid outages.
- Alternative power backup solutions, such as battery power packs and inverter technology, are gaining popularity due to their cost-effectiveness, environmental friendliness, and ease of installation. These power packs consist of large batteries and inverters, offering AC wall plug-styled outlets for user convenience. They are also simple to design and install, making them an attractive option for residential consumers and remote locations. Electric power generation from clean energy technologies, including renewable energy sources, is expected to increase in the coming years, reducing the demand for fossil fuel-based generators. However, until then, stationary generators will continue to play a crucial role in providing uninterrupted power supply during power instability and natural disasters.
Exclusive Customer Landscape
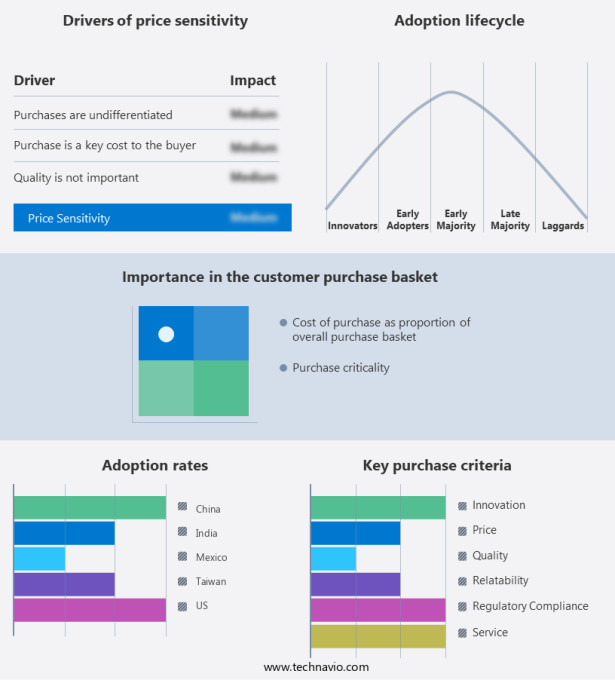
The stationary generator market forecasting report includes the adoption lifecycle of the market, covering from the innovator's stage to the laggard's stage. It focuses on adoption rates in different regions based on penetration. Furthermore, the market report also includes key purchase criteria and drivers of price sensitivity to help companies evaluate and develop their market growth analysis strategies.
Customer Landscape
Key Companies & Market Insights
Companies are implementing various strategies, such as strategic alliances, market forecast , partnerships, mergers and acquisitions, geographical expansion, and product/service launches, to enhance their presence in the industry.
Aggreko Plc - Our company provides rental services for stationary generators fueled by gas and diesel. These generators are renowned for their dependability, efficiency, and cost-effectiveness. By choosing our rental services, you can ensure a continuous power supply during power outages or construction projects. Our team is dedicated to making the rental process easy and hassle-free, allowing you to focus on your priorities. Our generators undergo rigorous maintenance and testing to ensure optimal performance and reliability. With our flexible rental plans, you can rent a generator for as long as you need, making it a cost-effective solution for your power needs.
The stationary generator industry research and growth report includes detailed analyses of the competitive landscape of the market and information about key companies, including:
- Aggreko Plc
- APR Energy
- Atlas Copco AB
- Briggs and Stratton LLC
- Caterpillar Inc.
- Cummins Inc.
- Daewoo International Corp.
- Generac Holdings Inc.
- Honeywell International Inc.
- Hyundai Heavy Industries Group
- Kirloskar Electric Co. Ltd.
- Kohler Co.
- Mitsubishi Heavy Industries Ltd
- Multiquip Inc.
- Quanta Services Inc.
- Rolls Royce Holdings Plc
- Scotts Emergency Lighting and Power Generation Inc.
- Siemens AG
- Wartsila Corp.
- Yanmar Holdings Co. Ltd.
Qualitative and quantitative analysis of companies has been conducted to help clients understand the wider business environment as well as the strengths and weaknesses of key industry players. Data is qualitatively analyzed to categorize companies as pure play, category-focused, industry-focused, and diversified; it is quantitatively analyzed to categorize companies as dominant, leading, strong, tentative, and weak.
Research Analyst Overview
the market is witnessing significant growth due to various market dynamics. One of the primary factors driving this growth is the increasing electricity demand, especially in developing countries, where power infrastructure is inadequate to meet the growing energy needs. Another factor fueling the demand for stationary generators is the rise in extreme weather events, leading to power instability and outages. Natural disasters such as hurricanes, earthquakes, and wildfires can cause extensive damage to power grids, leading to prolonged power outages. In such situations, stationary generators provide a reliable electricity source, ensuring uninterrupted power supply to critical infrastructure and essential services.
The construction sector is another significant end-user of stationary generators. Construction sites require a continuous power supply for various operations, and grid outages can significantly impact project timelines. Stationary generators provide a backup power solution, ensuring that construction projects remain on schedule. The mining industry is another major consumer of stationary generators. Mining activities often take place in remote locations, where access to the power grid is limited or non-existent. Stationary generators provide a sustainable energy solution, enabling mining operations to continue uninterrupted. Fossil fuels continue to dominate the power generation landscape, with diesel and natural gas being the most commonly used fuels for stationary generators.
However, the increasing focus on reducing greenhouse gas emissions and transitioning to clean energy technologies is driving the adoption of renewable energy technology in the market. Renewable energy sources such as solar, wind, and hydroelectric power are becoming increasingly cost-competitive with traditional fossil fuel-based power generation. Renewable energy technologies offer several advantages, including lower greenhouse gas emissions, reduced dependence on fossil fuels, and improved sustainability. The telecommunications industry is another significant end-user of stationary generators. Telecommunications infrastructure requires a reliable power supply to ensure uninterrupted communication services. Stationary generators provide a backup power solution, ensuring that communication networks remain operational during power outages.
The automobile industry also relies on stationary generators for various applications, including charging electric vehicles and powering workshops and dealerships. The oil and gas industry uses stationary generators for exploration and production activities, providing power to drilling rigs and production facilities. Data centers and electric utilities are other significant end-users of stationary generators. Data centers require a continuous power supply to ensure the availability of critical data and applications. Electric utilities use stationary generators as backup power sources during grid outages and to provide peak-load power during periods of high demand. In conclusion, the market is driven by various market dynamics, including increasing electricity demand, extreme weather events, inadequate power infrastructure, and the need for reliable electricity sources.
The market is also witnessing a shift towards renewable energy technologies and sustainable energy solutions, driven by emission regulations and the need to reduce greenhouse gas emissions. Stationary generators provide a critical backup power solution for various industries, including construction, mining, telecommunications, automobiles, oil and gas, data centers, and electric utilities.
|
Stationary Generator Market Scope |
|
|
Report Coverage |
Details |
|
Page number |
192 |
|
Base year |
2023 |
|
Historic period |
2018-2022 |
|
Forecast period |
2024-2028 |
|
Growth momentum & CAGR |
Accelerate at a CAGR of 5.6% |
|
Market growth 2024-2028 |
USD 5884.8 million |
|
Market structure |
Fragmented |
|
YoY growth 2023-2024(%) |
5.2 |
|
Key countries |
China, US, Taiwan, India, Mexico, Japan, South Korea, UK, Germany, and France |
|
Competitive landscape |
Leading Companies, Market Positioning of Companies, Competitive Strategies, and Industry Risks |
What are the Key Data Covered in this Market Research and Growth Report?
- CAGR of the Stationary Generator industry during the forecast period
- Detailed information on factors that will drive the market growth and forecasting between 2024 and 2028
- Precise estimation of the size of the market and its contribution of the industry in focus to the parent market
- Accurate predictions about upcoming market growth and trends and changes in consumer behaviour
- Growth of the market across APAC, North America, Europe, Middle East and Africa, and South America
- Thorough analysis of the market's competitive landscape and detailed information about companies
- Comprehensive analysis of factors that will challenge the growth of industry companies
We can help! Our analysts can customize this market research report to meet your requirements. Get in touch


