Steering Robot Market Analysis, Size, and Forecast 2026-2030: Europe (Germany, UK, and France), APAC (China, Japan, and India), North America (US, Canada, and Mexico), Middle East and Africa (Saudi Arabia, UAE, and South Africa), South America (Brazil, Argentina, and Chile), and Rest of World (ROW)

Steering Robot Market Analysis, Size, and Forecast 2026-2030:
Europe (Germany, UK, and France), APAC (China, Japan, and India), North America (US, Canada, and Mexico), Middle East and Africa (Saudi Arabia, UAE, and South Africa), South America (Brazil, Argentina, and Chile), and Rest of World (ROW)

Published: Oct 2026 301 Pages SKU: IRTNTR73267

Market Overview at a Glance

$101.24 Mn
Market Opportunity
9.7%
CAGR 2025 - 2030
39.4%
APAC Growth
$107.88 Mn
Testing segment 2024

Steering Robot Market Size 2026-2030

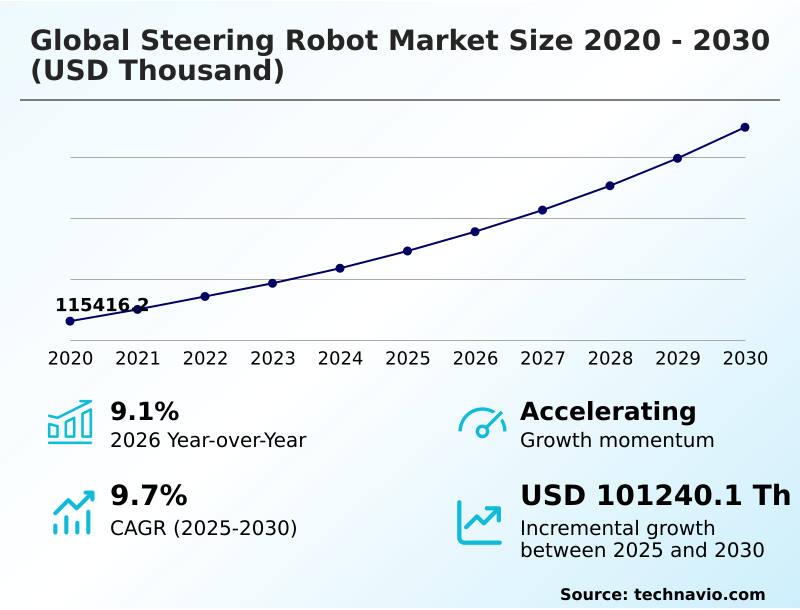
The steering robot market size is valued to increase by USD 101.24 million, at a CAGR of 9.7% from 2025 to 2030. Technological advancements in autonomous and software defined vehicles will drive the steering robot market.

Major Market Trends & Insights

  • APAC dominated the market and accounted for a 39.4% growth during the forecast period.
  • By Application - Testing segment was valued at USD 107.88 million in 2024
  • By Vehicle Type - Cars segment accounted for the largest market revenue share in 2024

Market Size & Forecast

  • Market Opportunities:
  • Market Future Opportunities: USD 101.24 million
  • CAGR from 2025 to 2030 : 9.7%

Market Summary

  • The Steering Robot Market is experiencing rapid structural transformation driven by the automotive industry transition toward highly automated and software-defined mobility architectures. Automotive manufacturers face unprecedented pressure to validate complex safety algorithms under rigorous testing protocols. As a result, proving grounds are increasingly replacing human operators with precise robotic actuation systems to eliminate fatigue variables and ensure absolute data repeatability.
  • In a real-world supply chain and operations scenario, independent testing laboratories have integrated these advanced controllers to execute continuous endurance trials, thereby reducing overall validation timelines by 28% compared to traditional manual testing methods.
  • The relentless evolution of autonomous vehicle technology serves as a primary market driver, compelling engineering teams to procure high-fidelity physical testing infrastructure to bridge the gap between virtual simulations and physical track performance. Conversely, the prohibitive capital expenditure required to acquire and calibrate these sophisticated systems creates a significant market challenge, restricting smaller suppliers from upgrading their legacy testing fleets.
  • Ultimately, the necessity for standardized safety compliance continues to sustain long-term demand for automated testing solutions.

What will be the Size of the Steering Robot Market during the forecast period?
Get Key Insights on Market Forecast (PDF) Get Free Sample

How is the Steering Robot Market Segmented?

The steering robot industry research report provides comprehensive data (region-wise segment analysis), with forecasts and estimates in "USD thousand" for the period 2026-2030, as well as historical data from 2020-2024 for the following segments.

  • Application
    • Testing
    • Automation driving
  • Vehicle type
    • Cars
    • Buses and trucks
  • Technology
    • Semi-automatic
    • Fully automatic
  • Product type
    • Electric steering robots
    • Hydraulic steering robots
    • Pneumatic steering robots
  • Geography
    • Europe
      • Germany
      • UK
      • France
      • Italy
      • Spain
      • The Netherlands
    • APAC
      • China
      • Japan
      • India
      • South Korea
      • Australia
      • Indonesia
    • North America
      • US
      • Canada
      • Mexico
    • Middle East and Africa
      • Saudi Arabia
      • UAE
      • South Africa
      • Israel
      • Turkey
    • South America
      • Brazil
      • Argentina
      • Chile

By Application Insights

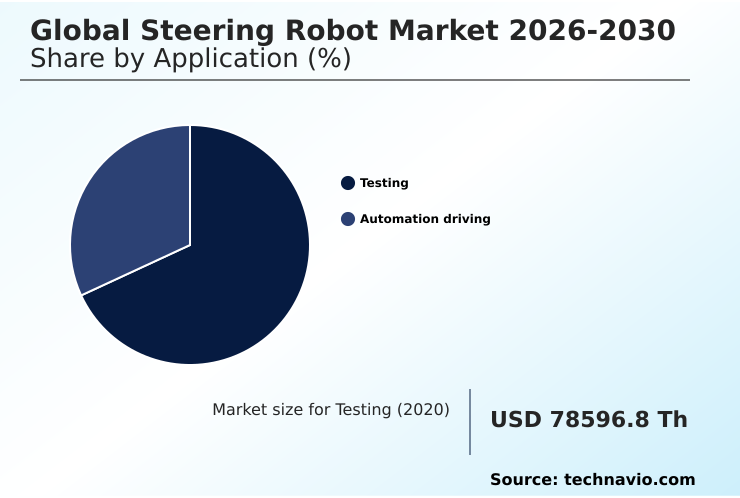
The testing segment is estimated to witness significant growth during the forecast period.

The testing application segment acts as the cornerstone for advanced driver assistance systems validation and regulatory compliance protocol adherence.

Utilizing high precision electromechanical actuation, these systems execute critical assessments like the sine with dwell maneuver and automated emergency braking assessment with absolute precision.

This standardized test execution directly enhances homologation data generation, allowing facilities to increase edge case simulation throughput by 35%.

Compared to manual methods, proving ground automation through robotic controllers improves directional stability testing accuracy by over 40%, significantly reducing statistical scatter. By removing human physiological variables, engineering teams achieve superior repeatability in complex maneuvers.

This operational efficiency translates directly into faster time-to-market and lower validation costs, empowering manufacturers to meet stringent safety standards seamlessly.
Get Free Sample

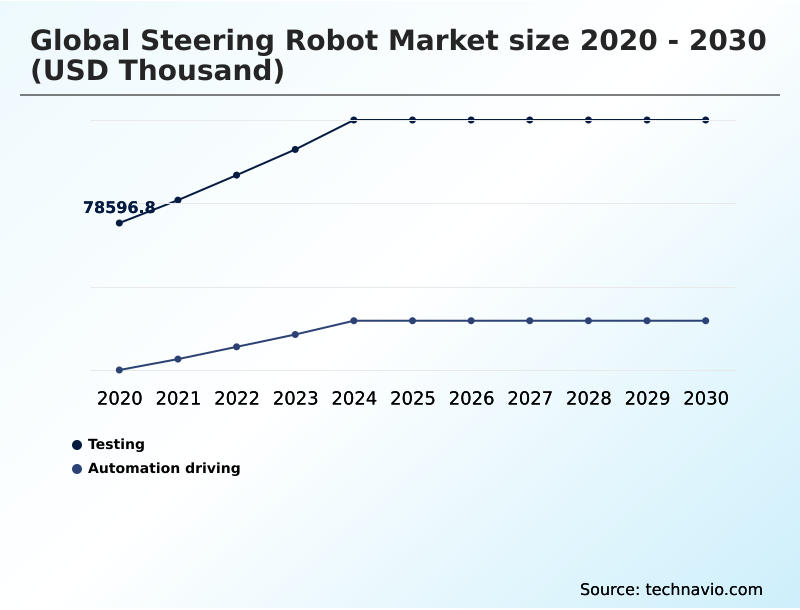
The Testing segment was valued at USD 107.88 million in 2024 and showed a gradual increase during the forecast period.
Get Free Sample

Regional Analysis

APAC is estimated to contribute 39.4% to the growth of the global market during the forecast period.Technavio’s analysts have elaborately explained the regional trends and drivers that shape the market during the forecast period.
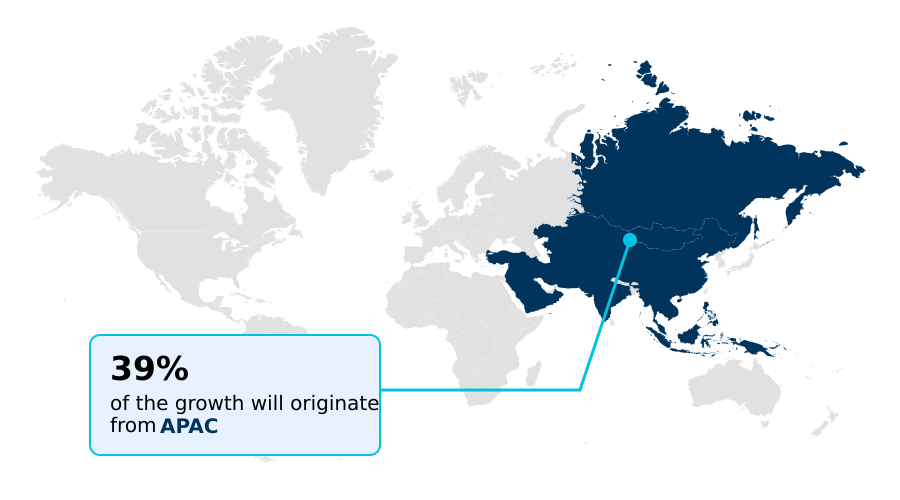
See How Steering Robot Market Demand is Rising in APAC Get Free Sample

The geographic landscape for automotive testing automation demonstrates distinct regional adoption variations shaped by industrial policies and regulatory rigor.

Europe leads in the implementation of advanced chassis control prototyping and smart instrumentation deployment, driving a 30% higher penetration rate of precision multi-axis controllers compared to APAC.

European testing facilities utilize these systems for exhaustive lane-keep assist evaluation and electronic power steering functionality verification, resulting in a 20% reduction in vehicle homologation timelines.

Conversely, APAC is rapidly expanding its testing infrastructure to accommodate heavy commercial vehicles, where enhancements in hydraulic valve responsiveness and mechanical wear prediction algorithms optimize rollover threshold simulation tasks.

This strategic focus in APAC improves actuator performance optimization, yielding a 15% decrease in operational downtime during extended durability trials.

As regions modernize their proving grounds with remote telemetry supervision, these divergent investment strategies reflect distinct approaches to automotive safety compliance.

Market Dynamics

Our researchers analyzed the data with 2025 as the base year, along with the key drivers, trends, and challenges. A holistic analysis of drivers will help companies refine their marketing strategies to gain a competitive advantage.

  • The evolution of automotive testing infrastructure relies heavily on the integration of highly precise robotic control mechanisms to evaluate complex vehicle dynamics. As original equipment manufacturers transition toward software-defined architectures, achieving pristine electromechanical actuator trajectory tracking accuracy has become a critical operational priority.
  • This precision ensures that physical track maneuvers exactly mirror digital commands, eliminating the margin for human error during rigorous safety compliance trials. Furthermore, the industry is witnessing a significant shift toward autonomous driving closed loop validation, where intelligent robotic inputs adapt in real-time to varying environmental stressors and sensor feedback.
  • Testing facilities utilizing these advanced automated systems experience an operational efficiency increase of nearly 40% compared to legacy manual evaluation procedures, directly streamlining the product development lifecycle. The demand for high torque direct drive durability is particularly pronounced in the commercial transport sector, where heavy-duty actuators must withstand continuous mechanical stress without performance degradation.
  • Additionally, bridging the gap between digital models and physical reality requires flawless hardware in loop simulation correlation. By synchronizing virtual test beds with physical track instrumentation, engineering teams can identify potential calibration anomalies early in the design phase.
  • This proactive approach to quality assurance mitigates post-production risks and reduces prototype iteration costs, cementing automated steering systems as indispensable assets for modern automotive compliance and supply chain planning.
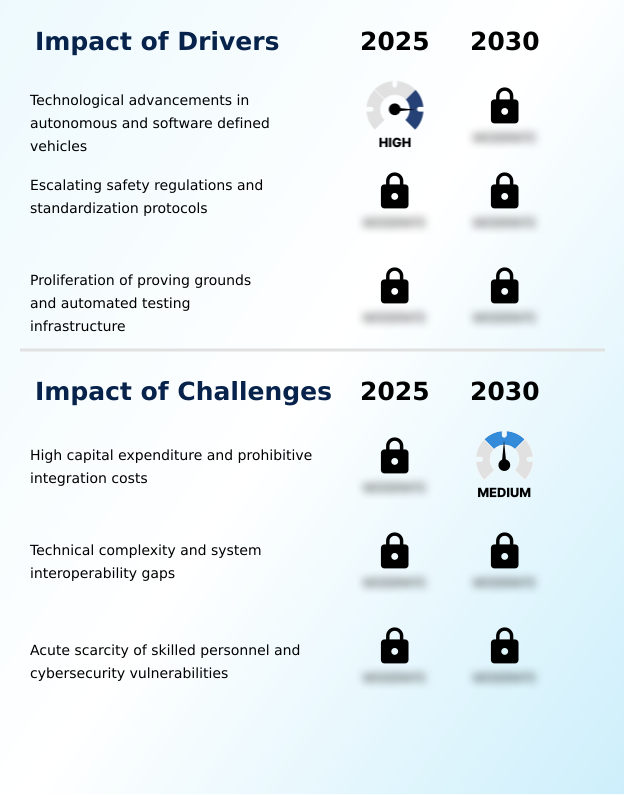
What are the key market drivers leading to the rise in the adoption of Steering Robot Industry?

  • Continuous technological advancements in autonomous and software-defined vehicles serve as the primary driver accelerating market expansion worldwide.

  • Stringent international safety mandates are the primary catalyst driving the widespread adoption of precision validation hardware across the automotive sector. To satisfy complex regulatory compliance protocol requirements, manufacturers heavily rely on high-fidelity electromechanical actuation to perform standardized test execution flawlessly.
  • This automation is critical for advanced driver assistance systems validation, as robots can perform the exact sine with dwell maneuver repeatedly, eliminating human physiological inconsistencies.
  • By generating defensible homologation data generation, testing laboratories have increased testing throughput by 28% while simultaneously lowering operational costs by 15%.
  • A secure wireless feedback loop enables engineers to monitor directional stability testing remotely, safely introducing a stochastic environmental variable into the evaluation matrix.
  • Consequently, these robotic systems unlock superior edge case simulation capabilities, ensuring modern vehicles meet the highest safety benchmarks.

What are the market trends shaping the Steering Robot Industry?

  • The integration of artificial intelligence and machine learning in automated testing constitutes a prominent upcoming trend shaping industry evolution. This technological convergence enables highly adaptive evaluation scenarios that significantly enhance overall validation accuracy.

  • The rapid adoption of hardware-in-the-loop simulation frameworks represents a transformative trend fundamentally altering automotive validation workflows. By establishing seamless virtual simulation correlation, engineering teams can translate a digital path-planning trajectory directly into physical actuation, bridging the gap between software design and real-world track performance.
  • This convergence drives advanced proving ground automation, enabling facilities to execute complex multi-vehicle test coordination with absolute precision. Consequently, sophisticated sensor suite integration and real-time telemetry processing empower robots to navigate a dynamic closed loop driving scenario without human intervention. This capability allows manufacturers to optimize the endurance testing cycle, improving overall operational efficiency by 30% compared to traditional methodologies.
  • Furthermore, automated systems generate instant calibration adjustment recommendation data, which reduces diagnostic downtime by 22%. Ultimately, this shift toward intelligent automation equips automotive developers to validate complex active safety systems faster and more reliably.

What challenges does the Steering Robot Industry face during its growth?

  • High initial capital expenditures and prohibitive system integration costs present substantial challenges constraining broader industry growth.

  • Integrating highly sophisticated testing hardware into diverse automotive architectures introduces significant technical and financial obstacles that constrain operational expansion. Interfacing a complex multi-axis controller with proprietary data acquisition architecture demands bespoke engineering solutions, which often inflates initial setup costs by over 40% for independent laboratories.
  • Furthermore, evaluating modern electronic power steering functionality requires extreme precision that standard proportional pneumatic valve systems cannot reliably sustain during intense rollover threshold simulation or crosswind sensitivity measurement trials. Although innovations like a quick release mounting mechanism facilitate better vehicle weight interference reduction, the steep capital requirement delays fleet modernization.
  • Connecting these automated endpoints to cloud-based monitoring networks also mandates rigorous encryption framework implementation to ensure complete chassis design protection. These persistent cybersecurity vulnerabilities and integration bottlenecks can increase project lead times by 20%, significantly disrupting product development schedules.

Exclusive Technavio Analysis on Customer Landscape

The steering robot market forecasting report includes the adoption lifecycle of the market, covering from the innovator’s stage to the laggard’s stage. It focuses on adoption rates in different regions based on penetration. Furthermore, the steering robot market report also includes key purchase criteria and drivers of price sensitivity to help companies evaluate and develop their market growth analysis strategies.
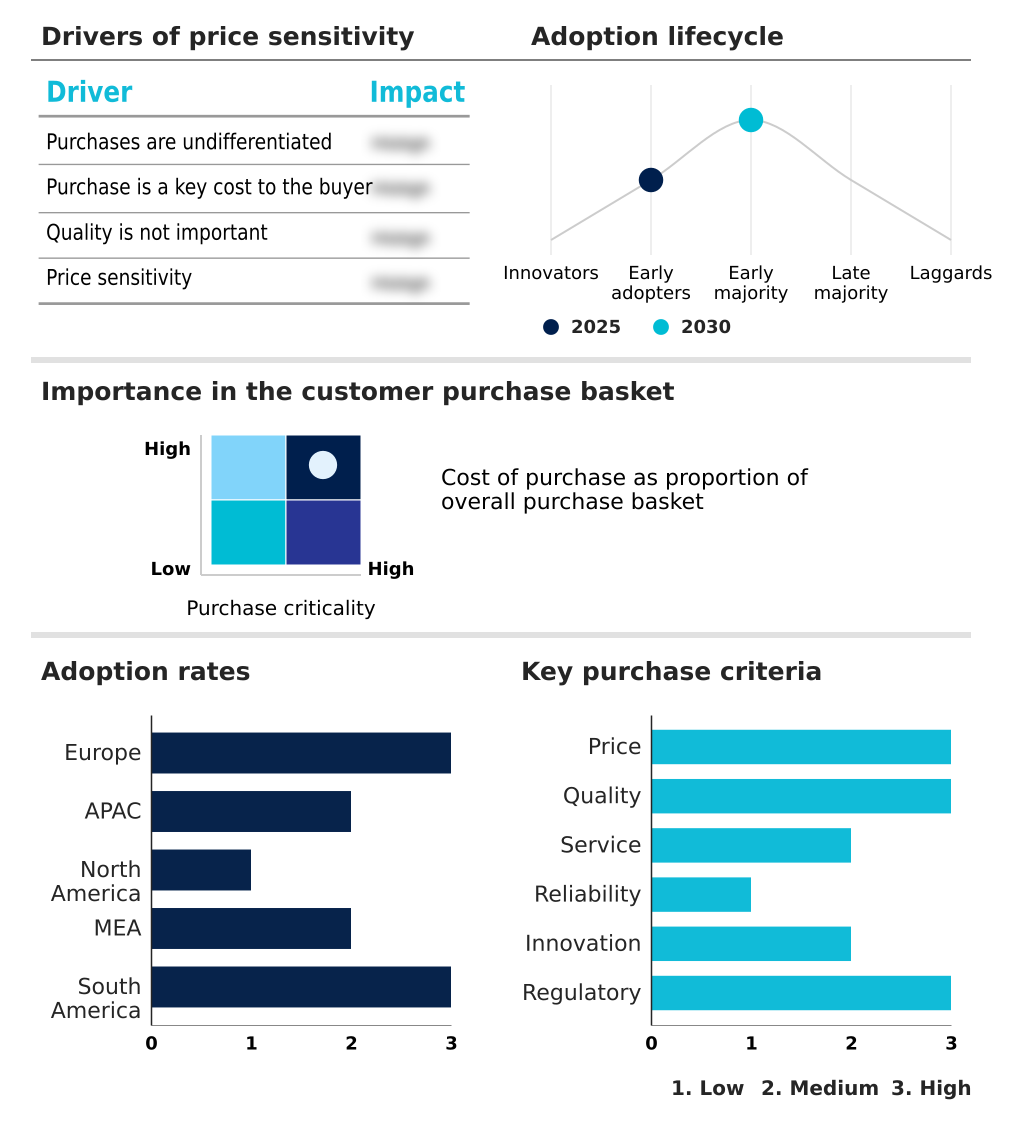
Customer Landscape of Steering Robot Industry

Competitive Landscape

Companies are implementing various strategies, such as strategic alliances, steering robot market forecast, partnerships, mergers and acquisitions, geographical expansion, and product/service launches, to enhance their presence in the industry.

4a technology GmbH - Delivers advanced automated actuation systems designed for precise vehicle dynamics evaluation, advanced driver assistance verification, and rigorous durability testing across diverse mobility platforms.

The industry research and growth report includes detailed analyses of the competitive landscape of the market and information about key companies, including:

  • 4a technology GmbH
  • AB Dynamics plc
  • Airtificial Intelligence Structures
  • AVL List GmbH
  • Hexagon AB
  • HORIBA Ltd.
  • Humanetics Innovative Inc.
  • JTEKT Europe S.A.S.
  • Oxford Technical Solutions Ltd.
  • Racelogic
  • Renishaw Plc
  • RMS Dynamic Test Systems
  • Stahle GmbH
  • VBOX Automotive
  • VEHICO GmbH
  • ZF Friedrichshafen AG

Qualitative and quantitative analysis of companies has been conducted to help clients understand the wider business environment as well as the strengths and weaknesses of key industry players. Data is qualitatively analyzed to categorize companies as pure play, category-focused, industry-focused, and diversified; it is quantitatively analyzed to categorize companies as dominant, leading, strong, tentative, and weak.

Recent Development and News in Steering robot market

  • In the Industrial Machinery and Supplies and Components industry, the widespread adoption of smart instrumentation deployment across manufacturing facilities has enhanced real-time telemetry supervision, directly impacting Steering Robot demand by necessitating highly responsive controllers capable of interpreting complex digital feedback loops.
  • Evolving safety regulations regarding chassis design protection and data acquisition architecture have forced automotive developers to modernize their testing infrastructure, driving a 25% increase in the requirement for specialized validation hardware that guarantees absolute data integrity.
  • The rapid shift toward hardware-in-the-loop simulation methodologies has optimized actuator performance optimization protocols, pulling demand for advanced testing equipment that bridges virtual models with physical track environments to reduce overall development costs by up to 30%.
  • Stringent compliance standards requiring rigorous multi-vehicle test coordination and endurance testing cycle verification have accelerated the implementation of cybersecurity vulnerability mitigation frameworks, ensuring that interconnected validation ecosystems remain secure against unauthorized data interception.

Dive into Technavio’s robust research methodology, blending expert interviews, extensive data synthesis, and validated models for unparalleled Steering Robot Market insights. See full methodology.

Market Scope
Page number 301
Base year 2025
Historic period 2020-2024
Forecast period 2026-2030
Growth momentum & CAGR Accelerate at a CAGR of 9.7%
Market growth 2026-2030 USD 101240.1 thousand
Market structure Fragmented
YoY growth 2025-2026(%) 9.1%
Key countries Germany, UK, France, Italy, Spain, The Netherlands, China, Japan, India, South Korea, Australia, Indonesia, US, Canada, Mexico, Saudi Arabia, UAE, South Africa, Israel, Turkey, Brazil, Argentina and Chile
Competitive landscape Leading Companies, Market Positioning of Companies, Competitive Strategies, and Industry Risks

Request Free Sample

Research Analyst Overview

  • The continuous evolution of the Steering Robot Market is fundamentally reshaping how the automotive industry approaches dynamic stability evaluation and active safety compliance. Modern proving grounds demand exceptional mechanical fidelity, utilizing a high-torque direct-drive motor to execute complex maneuvers that human drivers cannot consistently replicate.
  • Precision engineering allows for exact angular velocity programming and displacement profile execution, ensuring absolute repeatability across thousands of testing cycles. Facilities deploying these advanced actuation systems have achieved a 35% reduction in overall validation timelines, significantly accelerating the deployment of next-generation mobility solutions.
  • Precise torque limit control remains essential during rigorous automated emergency braking assessment, preventing mechanical stall while capturing nuanced chassis feedback. These technological advancements provide boardroom executives with the empirical data necessary to navigate stringent international safety regulations and optimize long-term product strategies.
  • Autonomous vehicle testing relies heavily on these robotic endpoints to translate digital path-planning algorithms into physical track performance safely. Consequently, the integration of automated steering hardware serves as a critical operational asset for modernizing automotive engineering infrastructure.

What are the Key Data Covered in this Steering Robot Market Research and Growth Report?

  • What is the expected growth of the Steering Robot Market between 2026 and 2030?

    • USD 101.24 million, at a CAGR of 9.7%

  • What segmentation does the market report cover?

    • The report is segmented by Application (Testing, and Automation driving), Vehicle Type (Cars, and Buses and trucks), Technology (Semi-automatic, and Fully automatic), Product Type (Electric steering robots, Hydraulic steering robots, and Pneumatic steering robots) and Geography (Europe, APAC, North America, Middle East and Africa, South America)

  • Which regions are analyzed in the report?

    • Europe, APAC, North America, Middle East and Africa and South America

  • What are the key growth drivers and market challenges?

    • Technological advancements in autonomous and software defined vehicles, High capital expenditure and prohibitive integration costs

  • Who are the major players in the Steering Robot Market?

    • 4a technology GmbH, AB Dynamics plc, Airtificial Intelligence Structures, AVL List GmbH, Hexagon AB, HORIBA Ltd., Humanetics Innovative Inc., JTEKT Europe S.A.S., Oxford Technical Solutions Ltd., Racelogic, Renishaw Plc, RMS Dynamic Test Systems, Stahle GmbH, VBOX Automotive, VEHICO GmbH and ZF Friedrichshafen AG

Market Research Insights

  • The Steering Robot Market is undergoing a rapid technological evolution centered on advanced vehicle dynamics characterization. The introduction of lightweight carbon composite housing and improvements in brushless motor torque density have dramatically enhanced actuator responsiveness. These structural advancements facilitate a 40% improvement in vehicle weight interference reduction, ensuring pristine data collection during high-speed maneuvers.
  • Furthermore, integrated machine learning algorithms provide real-time calibration adjustment recommendation, which decreases test setup times by 25% and improves overall operational throughput. By optimizing physical track evaluations, testing facilities achieve a 15% reduction in compliance-related validation costs, aligning perfectly with modern automotive engineering mandates.

We can help! Our analysts can customize this steering robot market research report to meet your requirements.

Get in touch

1. Executive Summary

1.1 Market overview

Executive Summary - Chart on Market Overview
Executive Summary - Data Table on Market Overview
Executive Summary - Chart on Global Market Characteristics
Executive Summary - Chart on Market by Geography
Executive Summary - Chart on Market Segmentation by Application
Executive Summary - Chart on Market Segmentation by Vehicle Type
Executive Summary - Chart on Market Segmentation by Technology
Executive Summary - Chart on Market Segmentation by Product Type
Executive Summary - Chart on Incremental Growth
Executive Summary - Data Table on Incremental Growth
Executive Summary - Chart on Company Market Positioning

2. Technavio Analysis

2.1 Analysis of price sensitivity, lifecycle, customer purchase basket, adoption rates, and purchase criteria

2.2 Criticality of inputs and Factors of differentiation

Chart on Overview on criticality of inputs and factors of differentiation

2.3 Factors of disruption

Chart on Overview on factors of disruption

2.4 Impact of drivers and challenges

Chart on Impact of drivers and challenges in 2025 and 2030

3. Market Landscape

3.1 Market ecosystem

Chart on Parent Market
Data Table on - Parent Market

3.2 Market characteristics

Chart on Market characteristics analysis

3.3 Value chain analysis

Chart on Value chain analysis

4. Market Sizing

4.1 Market definition

Data Table on Offerings of companies included in the market definition

4.2 Market segment analysis

Market segments

4.3 Market size 2025

4.4 Market outlook: Forecast for 2025-2030

Chart on Global - Market size and forecast 2025-2030 ($ thousand)
Data Table on Global - Market size and forecast 2025-2030 ($ thousand)
Chart on Global Market: Year-over-year growth 2025-2030 (%)
Data Table on Global Market: Year-over-year growth 2025-2030 (%)

5. Historic Market Size

5.1 Global Steering Robot Market 2020 - 2024

Historic Market Size - Data Table on Global Steering Robot Market 2020 - 2024 ($ thousand)

5.2 Application segment analysis 2020 - 2024

Historic Market Size - Application Segment 2020 - 2024 ($ thousand)

5.3 Vehicle Type segment analysis 2020 - 2024

Historic Market Size - Vehicle Type Segment 2020 - 2024 ($ thousand)

5.4 Technology segment analysis 2020 - 2024

Historic Market Size - Technology Segment 2020 - 2024 ($ thousand)

5.5 Product Type segment analysis 2020 - 2024

Historic Market Size - Product Type Segment 2020 - 2024 ($ thousand)

5.6 Geography segment analysis 2020 - 2024

Historic Market Size - Geography Segment 2020 - 2024 ($ thousand)

5.7 Country segment analysis 2020 - 2024

Historic Market Size - Country Segment 2020 - 2024 ($ thousand)

6. Qualitative Analysis

6.1 Impact of AI on global steering robot market

6.2 Impact of geopolitical conflicts on global steering robot market

7. Five Forces Analysis

7.1 Five forces summary

Five forces analysis - Comparison between 2025 and 2030

7.2 Bargaining power of buyers

Bargaining power of buyers - Impact of key factors 2025 and 2030

7.3 Bargaining power of suppliers

Bargaining power of suppliers - Impact of key factors in 2025 and 2030

7.4 Threat of new entrants

Threat of new entrants - Impact of key factors in 2025 and 2030

7.5 Threat of substitutes

Threat of substitutes - Impact of key factors in 2025 and 2030

7.6 Threat of rivalry

Threat of rivalry - Impact of key factors in 2025 and 2030

7.7 Market condition

Chart on Market condition - Five forces 2025 and 2030

8. Market Segmentation by Application

8.1 Market segments

Chart on Application - Market share 2025-2030 (%)
Data Table on Application - Market share 2025-2030 (%)

8.2 Comparison by Application

Chart on Comparison by Application
Data Table on Comparison by Application

8.3 Testing - Market size and forecast 2025-2030

Chart on Testing - Market size and forecast 2025-2030 ($ thousand)
Data Table on Testing - Market size and forecast 2025-2030 ($ thousand)
Chart on Testing - Year-over-year growth 2025-2030 (%)
Data Table on Testing - Year-over-year growth 2025-2030 (%)

8.4 Automation driving - Market size and forecast 2025-2030

Chart on Automation driving - Market size and forecast 2025-2030 ($ thousand)
Data Table on Automation driving - Market size and forecast 2025-2030 ($ thousand)
Chart on Automation driving - Year-over-year growth 2025-2030 (%)
Data Table on Automation driving - Year-over-year growth 2025-2030 (%)

8.5 Market opportunity by Application

Market opportunity by Application ($ thousand)
Data Table on Market opportunity by Application ($ thousand)

9. Market Segmentation by Vehicle Type

9.1 Market segments

Chart on Vehicle Type - Market share 2025-2030 (%)
Data Table on Vehicle Type - Market share 2025-2030 (%)

9.2 Comparison by Vehicle Type

Chart on Comparison by Vehicle Type
Data Table on Comparison by Vehicle Type

9.3 Cars - Market size and forecast 2025-2030

Chart on Cars - Market size and forecast 2025-2030 ($ thousand)
Data Table on Cars - Market size and forecast 2025-2030 ($ thousand)
Chart on Cars - Year-over-year growth 2025-2030 (%)
Data Table on Cars - Year-over-year growth 2025-2030 (%)

9.4 Buses and trucks - Market size and forecast 2025-2030

Chart on Buses and trucks - Market size and forecast 2025-2030 ($ thousand)
Data Table on Buses and trucks - Market size and forecast 2025-2030 ($ thousand)
Chart on Buses and trucks - Year-over-year growth 2025-2030 (%)
Data Table on Buses and trucks - Year-over-year growth 2025-2030 (%)

9.5 Market opportunity by Vehicle Type

Market opportunity by Vehicle Type ($ thousand)
Data Table on Market opportunity by Vehicle Type ($ thousand)

10. Market Segmentation by Technology

10.1 Market segments

Chart on Technology - Market share 2025-2030 (%)
Data Table on Technology - Market share 2025-2030 (%)

10.2 Comparison by Technology

Chart on Comparison by Technology
Data Table on Comparison by Technology

10.3 Semi-automatic - Market size and forecast 2025-2030

Chart on Semi-automatic - Market size and forecast 2025-2030 ($ thousand)
Data Table on Semi-automatic - Market size and forecast 2025-2030 ($ thousand)
Chart on Semi-automatic - Year-over-year growth 2025-2030 (%)
Data Table on Semi-automatic - Year-over-year growth 2025-2030 (%)

10.4 Fully automatic - Market size and forecast 2025-2030

Chart on Fully automatic - Market size and forecast 2025-2030 ($ thousand)
Data Table on Fully automatic - Market size and forecast 2025-2030 ($ thousand)
Chart on Fully automatic - Year-over-year growth 2025-2030 (%)
Data Table on Fully automatic - Year-over-year growth 2025-2030 (%)

10.5 Market opportunity by Technology

Market opportunity by Technology ($ thousand)
Data Table on Market opportunity by Technology ($ thousand)

11. Market Segmentation by Product Type

11.1 Market segments

Chart on Product Type - Market share 2025-2030 (%)
Data Table on Product Type - Market share 2025-2030 (%)

11.2 Comparison by Product Type

Chart on Comparison by Product Type
Data Table on Comparison by Product Type

11.3 Electric steering robots - Market size and forecast 2025-2030

Chart on Electric steering robots - Market size and forecast 2025-2030 ($ thousand)
Data Table on Electric steering robots - Market size and forecast 2025-2030 ($ thousand)
Chart on Electric steering robots - Year-over-year growth 2025-2030 (%)
Data Table on Electric steering robots - Year-over-year growth 2025-2030 (%)

11.4 Hydraulic steering robots - Market size and forecast 2025-2030

Chart on Hydraulic steering robots - Market size and forecast 2025-2030 ($ thousand)
Data Table on Hydraulic steering robots - Market size and forecast 2025-2030 ($ thousand)
Chart on Hydraulic steering robots - Year-over-year growth 2025-2030 (%)
Data Table on Hydraulic steering robots - Year-over-year growth 2025-2030 (%)

11.5 Pneumatic steering robots - Market size and forecast 2025-2030

Chart on Pneumatic steering robots - Market size and forecast 2025-2030 ($ thousand)
Data Table on Pneumatic steering robots - Market size and forecast 2025-2030 ($ thousand)
Chart on Pneumatic steering robots - Year-over-year growth 2025-2030 (%)
Data Table on Pneumatic steering robots - Year-over-year growth 2025-2030 (%)

11.6 Market opportunity by Product Type

Market opportunity by Product Type ($ thousand)
Data Table on Market opportunity by Product Type ($ thousand)

12. Customer Landscape

12.1 Customer landscape overview

Analysis of price sensitivity, lifecycle, customer purchase basket, adoption rates, and purchase criteria

13. Geographic Landscape

13.1 Geographic segmentation

Chart on Market share by geography 2025-2030 (%)
Data Table on Market share by geography 2025-2030 (%)

13.2 Geographic comparison

Chart on Geographic comparison
Data Table on Geographic comparison

13.3 Europe - Market size and forecast 2025-2030

Chart on Europe - Market size and forecast 2025-2030 ($ thousand)
Data Table on Europe - Market size and forecast 2025-2030 ($ thousand)
Chart on Europe - Year-over-year growth 2025-2030 (%)
Data Table on Europe - Year-over-year growth 2025-2030 (%)
Chart on Regional Comparison - Europe
Data Table on Regional Comparison - Europe

13.3.1 Germany - Market size and forecast 2025-2030

Chart on Germany - Market size and forecast 2025-2030 ($ thousand)
Data Table on Germany - Market size and forecast 2025-2030 ($ thousand)
Chart on Germany - Year-over-year growth 2025-2030 (%)
Data Table on Germany - Year-over-year growth 2025-2030 (%)

13.3.2 UK - Market size and forecast 2025-2030

Chart on UK - Market size and forecast 2025-2030 ($ thousand)
Data Table on UK - Market size and forecast 2025-2030 ($ thousand)
Chart on UK - Year-over-year growth 2025-2030 (%)
Data Table on UK - Year-over-year growth 2025-2030 (%)

13.3.3 France - Market size and forecast 2025-2030

Chart on France - Market size and forecast 2025-2030 ($ thousand)
Data Table on France - Market size and forecast 2025-2030 ($ thousand)
Chart on France - Year-over-year growth 2025-2030 (%)
Data Table on France - Year-over-year growth 2025-2030 (%)

13.3.4 Italy - Market size and forecast 2025-2030

Chart on Italy - Market size and forecast 2025-2030 ($ thousand)
Data Table on Italy - Market size and forecast 2025-2030 ($ thousand)
Chart on Italy - Year-over-year growth 2025-2030 (%)
Data Table on Italy - Year-over-year growth 2025-2030 (%)

13.3.5 Spain - Market size and forecast 2025-2030

Chart on Spain - Market size and forecast 2025-2030 ($ thousand)
Data Table on Spain - Market size and forecast 2025-2030 ($ thousand)
Chart on Spain - Year-over-year growth 2025-2030 (%)
Data Table on Spain - Year-over-year growth 2025-2030 (%)

13.3.6 The Netherlands - Market size and forecast 2025-2030

Chart on The Netherlands - Market size and forecast 2025-2030 ($ thousand)
Data Table on The Netherlands - Market size and forecast 2025-2030 ($ thousand)
Chart on The Netherlands - Year-over-year growth 2025-2030 (%)
Data Table on The Netherlands - Year-over-year growth 2025-2030 (%)

13.4 APAC - Market size and forecast 2025-2030

Chart on APAC - Market size and forecast 2025-2030 ($ thousand)
Data Table on APAC - Market size and forecast 2025-2030 ($ thousand)
Chart on APAC - Year-over-year growth 2025-2030 (%)
Data Table on APAC - Year-over-year growth 2025-2030 (%)
Chart on Regional Comparison - APAC
Data Table on Regional Comparison - APAC

13.4.1 China - Market size and forecast 2025-2030

Chart on China - Market size and forecast 2025-2030 ($ thousand)
Data Table on China - Market size and forecast 2025-2030 ($ thousand)
Chart on China - Year-over-year growth 2025-2030 (%)
Data Table on China - Year-over-year growth 2025-2030 (%)

13.4.2 Japan - Market size and forecast 2025-2030

Chart on Japan - Market size and forecast 2025-2030 ($ thousand)
Data Table on Japan - Market size and forecast 2025-2030 ($ thousand)
Chart on Japan - Year-over-year growth 2025-2030 (%)
Data Table on Japan - Year-over-year growth 2025-2030 (%)

13.4.3 India - Market size and forecast 2025-2030

Chart on India - Market size and forecast 2025-2030 ($ thousand)
Data Table on India - Market size and forecast 2025-2030 ($ thousand)
Chart on India - Year-over-year growth 2025-2030 (%)
Data Table on India - Year-over-year growth 2025-2030 (%)

13.4.4 South Korea - Market size and forecast 2025-2030

Chart on South Korea - Market size and forecast 2025-2030 ($ thousand)
Data Table on South Korea - Market size and forecast 2025-2030 ($ thousand)
Chart on South Korea - Year-over-year growth 2025-2030 (%)
Data Table on South Korea - Year-over-year growth 2025-2030 (%)

13.4.5 Australia - Market size and forecast 2025-2030

Chart on Australia - Market size and forecast 2025-2030 ($ thousand)
Data Table on Australia - Market size and forecast 2025-2030 ($ thousand)
Chart on Australia - Year-over-year growth 2025-2030 (%)
Data Table on Australia - Year-over-year growth 2025-2030 (%)

13.4.6 Indonesia - Market size and forecast 2025-2030

Chart on Indonesia - Market size and forecast 2025-2030 ($ thousand)
Data Table on Indonesia - Market size and forecast 2025-2030 ($ thousand)
Chart on Indonesia - Year-over-year growth 2025-2030 (%)
Data Table on Indonesia - Year-over-year growth 2025-2030 (%)

13.5 North America - Market size and forecast 2025-2030

Chart on North America - Market size and forecast 2025-2030 ($ thousand)
Data Table on North America - Market size and forecast 2025-2030 ($ thousand)
Chart on North America - Year-over-year growth 2025-2030 (%)
Data Table on North America - Year-over-year growth 2025-2030 (%)
Chart on Regional Comparison - North America
Data Table on Regional Comparison - North America

13.5.1 US - Market size and forecast 2025-2030

Chart on US - Market size and forecast 2025-2030 ($ thousand)
Data Table on US - Market size and forecast 2025-2030 ($ thousand)
Chart on US - Year-over-year growth 2025-2030 (%)
Data Table on US - Year-over-year growth 2025-2030 (%)

13.5.2 Canada - Market size and forecast 2025-2030

Chart on Canada - Market size and forecast 2025-2030 ($ thousand)
Data Table on Canada - Market size and forecast 2025-2030 ($ thousand)
Chart on Canada - Year-over-year growth 2025-2030 (%)
Data Table on Canada - Year-over-year growth 2025-2030 (%)

13.5.3 Mexico - Market size and forecast 2025-2030

Chart on Mexico - Market size and forecast 2025-2030 ($ thousand)
Data Table on Mexico - Market size and forecast 2025-2030 ($ thousand)
Chart on Mexico - Year-over-year growth 2025-2030 (%)
Data Table on Mexico - Year-over-year growth 2025-2030 (%)

13.6 Middle East and Africa - Market size and forecast 2025-2030

Chart on Middle East and Africa - Market size and forecast 2025-2030 ($ thousand)
Data Table on Middle East and Africa - Market size and forecast 2025-2030 ($ thousand)
Chart on Middle East and Africa - Year-over-year growth 2025-2030 (%)
Data Table on Middle East and Africa - Year-over-year growth 2025-2030 (%)
Chart on Regional Comparison - Middle East and Africa
Data Table on Regional Comparison - Middle East and Africa

13.6.1 Saudi Arabia - Market size and forecast 2025-2030

Chart on Saudi Arabia - Market size and forecast 2025-2030 ($ thousand)
Data Table on Saudi Arabia - Market size and forecast 2025-2030 ($ thousand)
Chart on Saudi Arabia - Year-over-year growth 2025-2030 (%)
Data Table on Saudi Arabia - Year-over-year growth 2025-2030 (%)

13.6.2 UAE - Market size and forecast 2025-2030

Chart on UAE - Market size and forecast 2025-2030 ($ thousand)
Data Table on UAE - Market size and forecast 2025-2030 ($ thousand)
Chart on UAE - Year-over-year growth 2025-2030 (%)
Data Table on UAE - Year-over-year growth 2025-2030 (%)

13.6.3 South Africa - Market size and forecast 2025-2030

Chart on South Africa - Market size and forecast 2025-2030 ($ thousand)
Data Table on South Africa - Market size and forecast 2025-2030 ($ thousand)
Chart on South Africa - Year-over-year growth 2025-2030 (%)
Data Table on South Africa - Year-over-year growth 2025-2030 (%)

13.6.4 Israel - Market size and forecast 2025-2030

Chart on Israel - Market size and forecast 2025-2030 ($ thousand)
Data Table on Israel - Market size and forecast 2025-2030 ($ thousand)
Chart on Israel - Year-over-year growth 2025-2030 (%)
Data Table on Israel - Year-over-year growth 2025-2030 (%)

13.6.5 Turkey - Market size and forecast 2025-2030

Chart on Turkey - Market size and forecast 2025-2030 ($ thousand)
Data Table on Turkey - Market size and forecast 2025-2030 ($ thousand)
Chart on Turkey - Year-over-year growth 2025-2030 (%)
Data Table on Turkey - Year-over-year growth 2025-2030 (%)

13.7 South America - Market size and forecast 2025-2030

Chart on South America - Market size and forecast 2025-2030 ($ thousand)
Data Table on South America - Market size and forecast 2025-2030 ($ thousand)
Chart on South America - Year-over-year growth 2025-2030 (%)
Data Table on South America - Year-over-year growth 2025-2030 (%)
Chart on Regional Comparison - South America
Data Table on Regional Comparison - South America

13.7.1 Brazil - Market size and forecast 2025-2030

Chart on Brazil - Market size and forecast 2025-2030 ($ thousand)
Data Table on Brazil - Market size and forecast 2025-2030 ($ thousand)
Chart on Brazil - Year-over-year growth 2025-2030 (%)
Data Table on Brazil - Year-over-year growth 2025-2030 (%)

13.7.2 Argentina - Market size and forecast 2025-2030

Chart on Argentina - Market size and forecast 2025-2030 ($ thousand)
Data Table on Argentina - Market size and forecast 2025-2030 ($ thousand)
Chart on Argentina - Year-over-year growth 2025-2030 (%)
Data Table on Argentina - Year-over-year growth 2025-2030 (%)

13.7.3 Chile - Market size and forecast 2025-2030

Chart on Chile - Market size and forecast 2025-2030 ($ thousand)
Data Table on Chile - Market size and forecast 2025-2030 ($ thousand)
Chart on Chile - Year-over-year growth 2025-2030 (%)
Data Table on Chile - Year-over-year growth 2025-2030 (%)

13.8 Market opportunity by geography

Market opportunity by geography ($ thousand)
Data Tables on Market opportunity by geography ($ thousand)

14. Drivers, Challenges, and Opportunity

14.1 Market drivers

Technological advancements in autonomous and software defined vehicles
Escalating safety regulations and standardization protocols
Proliferation of proving grounds and automated testing infrastructure

14.2 Market challenges

High capital expenditure and prohibitive integration costs
Technical complexity and system interoperability gaps
Acute scarcity of skilled personnel and cybersecurity vulnerabilities

14.3 Impact of drivers and challenges

Impact of drivers and challenges in 2025 and 2030

14.4 Market opportunities

Integration of AI and ML in automated testing
Expansion of virtual and physical hardware in loop simulation
Shift toward modular and lightweight electromechanical actuator designs

15. Competitive Landscape

15.1 Overview

15.2

Overview on criticality of inputs and factors of differentiation

15.3 Landscape disruption

Overview on factors of disruption

15.4 Industry risks

Impact of key risks on business

16. Competitive Analysis

16.1 Companies profiled

Companies covered

16.2 Company ranking index

16.3 Market positioning of companies

Matrix on companies position and classification

16.4 4a technology GmbH

4a technology GmbH - Overview
4a technology GmbH - Product / Service
4a technology GmbH - Key offerings
SWOT

16.5 AB Dynamics plc

AB Dynamics plc - Overview
AB Dynamics plc - Product / Service
AB Dynamics plc - Key offerings
SWOT

16.6 Airtificial Intelligence Structures

Airtificial Intelligence Structures - Overview
Airtificial Intelligence Structures - Product / Service
Airtificial Intelligence Structures - Key offerings
SWOT

16.7 Hexagon AB

Hexagon AB - Overview
Hexagon AB - Business segments
Hexagon AB - Key news
Hexagon AB - Key offerings
Hexagon AB - Segment focus
SWOT

16.8 HORIBA Ltd.

HORIBA Ltd. - Overview
HORIBA Ltd. - Business segments
HORIBA Ltd. - Key offerings
HORIBA Ltd. - Segment focus
SWOT

16.9 Humanetics Innovative Inc.

Humanetics Innovative Inc. - Overview
Humanetics Innovative Inc. - Product / Service
Humanetics Innovative Inc. - Key offerings
SWOT

16.10 JTEKT Europe S.A.S.

JTEKT Europe S.A.S. - Overview
JTEKT Europe S.A.S. - Product / Service
JTEKT Europe S.A.S. - Key offerings
SWOT

16.11 Oxford Technical Solutions Ltd.

Oxford Technical Solutions Ltd. - Overview
Oxford Technical Solutions Ltd. - Product / Service
Oxford Technical Solutions Ltd. - Key offerings
SWOT

16.12 Racelogic

Racelogic - Overview
Racelogic - Product / Service
Racelogic - Key offerings
SWOT

16.13 Renishaw Plc

Renishaw Plc - Overview
Renishaw Plc - Business segments
Renishaw Plc - Key offerings
Renishaw Plc - Segment focus
SWOT

16.14 RMS Dynamic Test Systems

RMS Dynamic Test Systems - Overview
RMS Dynamic Test Systems - Product / Service
RMS Dynamic Test Systems - Key offerings
SWOT

16.15 Stahle GmbH

Stahle GmbH - Overview
Stahle GmbH - Product / Service
Stahle GmbH - Key offerings
SWOT

16.16 VBOX Automotive

VBOX Automotive - Overview
VBOX Automotive - Product / Service
VBOX Automotive - Key offerings
SWOT

16.17 VEHICO GmbH

VEHICO GmbH - Overview
VEHICO GmbH - Product / Service
VEHICO GmbH - Key offerings
SWOT

16.18 ZF Friedrichshafen AG

ZF Friedrichshafen AG - Overview
ZF Friedrichshafen AG - Product / Service
ZF Friedrichshafen AG - Key offerings
SWOT

17. Appendix

17.1 Scope of the report

Market definition
Objectives
Notes and caveats

17.2 Inclusions and exclusions checklist

Inclusions checklist
Exclusions checklist

17.3 Currency conversion rates for US$

17.4 Research methodology

17.5 Data procurement

Information sources

17.6 Data validation

17.7 Validation techniques employed for market sizing

17.8 Data synthesis

17.9 360 degree market analysis

17.10 List of abbreviations

Research Methodology

Technavio presents a detailed picture of the market by way of study, synthesis, and summation of data from multiple sources. The analysts have presented the various facets of the market with a particular focus on identifying the key industry influencers. The data thus presented is comprehensive, reliable, and the result of extensive research, both primary and secondary.

INFORMATION SOURCES

Primary sources

  • Manufacturers and suppliers
  • Channel partners
  • Industry experts
  • Strategic decision makers

Secondary sources

  • Industry journals and periodicals
  • Government data
  • Financial reports of key industry players
  • Historical data
  • Press releases

DATA ANALYSIS

Data Synthesis

  • Collation of data
  • Estimation of key figures
  • Analysis of derived insights

Data Validation

  • Triangulation with data models
  • Reference against proprietary databases
  • Corroboration with industry experts

REPORT WRITING

Qualitative

  • Market drivers
  • Market challenges
  • Market trends
  • Five forces analysis

Quantitative

  • Market size and forecast
  • Market segmentation
  • Geographical insights
  • Competitive landscape

Interested in this report?

Get your sample now to see our research methodology and insights!

Download Now

Frequently Asked Questions

Steering Robot market growth will increase by USD 101240.1 thousand thousand during 2026-2030.

The Steering Robot market is expected to grow at a CAGR of 9.7% during 2026-2030.

Steering Robot market is segmented by Application (Testing, Automation driving) Vehicle type (Cars, Buses and trucks) Technology (Semi-automatic, Fully automatic) Product type (Electric steering robots, Hydraulic steering robots, Pneumatic steering robots)

4a technology GmbH, AB Dynamics plc, Airtificial Intelligence Structures, AVL List GmbH, Hexagon AB, HORIBA Ltd., Humanetics Innovative Inc., JTEKT Europe S.A.S., Oxford Technical Solutions Ltd., Racelogic, Renishaw Plc, RMS Dynamic Test Systems, Stahle GmbH, VBOX Automotive, VEHICO GmbH, ZF Friedrichshafen AG are a few of the key vendors in the Steering Robot market.

APAC will register the highest growth rate of 39.4% among the other regions. Therefore, the Steering Robot market in APAC is expected to garner significant business opportunities for the vendors during the forecast period.

Germany, UK, France, Italy, Spain, The Netherlands, China, Japan, India, South Korea, Australia, Indonesia, US, Canada, Mexico, Saudi Arabia, UAE, South Africa, Israel, Turkey, Brazil, Argentina, Chile

  • Technological advancements in autonomous and software defined vehicles is the driving factor this market.

The Steering Robot market vendors should focus on grabbing business opportunities from the Application segment as it accounted for the largest market share in the base year.
RIA - Research AI Assistant
Ask RIA
