Stick Vacuum Cleaner Market Size 2025-2029
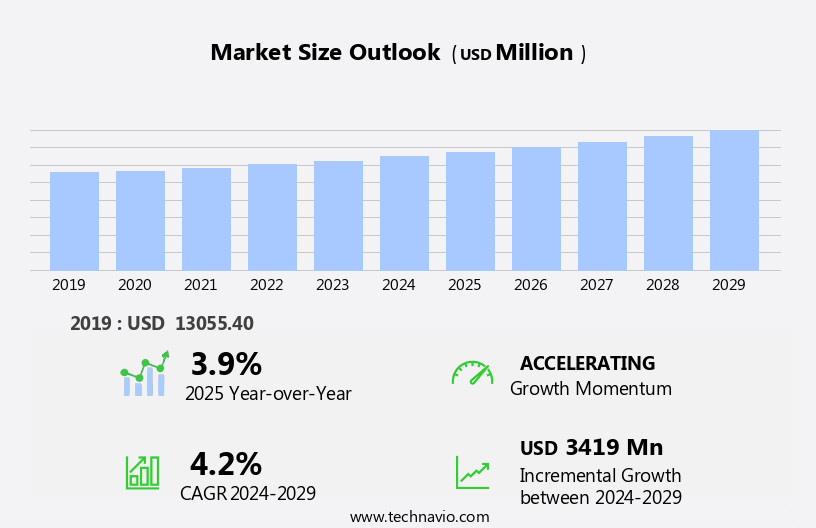
The stick vacuum cleaner market size is forecast to increase by USD 3.42 billion at a CAGR of 4.2% between 2024 and 2029.
- The market is experiencing significant growth driven by the increasing number of smart cities and the rising demand via online retailing. Smart cities' infrastructure development and the subsequent increase in residential and commercial buildings create a vast market for stick vacuum cleaners, as they offer convenience and portability. Furthermore, the convenience of purchasing vacuum cleaners online has led to an uptick in sales, making e-commerce platforms crucial distribution channels. However, this market is not without challenges. The proliferation of counterfeit products poses a significant threat, with substandard quality and performance potentially damaging consumer trust and market reputation.
- The market for stick vacuum cleaners is thriving in the online and offline sectors, with e-commerce platforms and online transaction channels providing easy access to these battery-powered tools for domestic purposes and home use. Additionally, the commercial sectors, including hardwood floors and furniture, also benefit from these devices, ensuring a clean and healthy environment for their clients and employees. To capitalize on market opportunities and navigate these challenges effectively, companies must focus on product innovation, quality assurance, and distribution networks. By addressing these factors, stakeholders can position themselves to capture market share and drive sustainable growth in the market.
What will be the Size of the Stick Vacuum Cleaner Market during the forecast period?
- The market encompasses cordless, battery powered vacuum cleaners designed for household chores and cleaning gadgets. This segment of the vacuum cleaner industry has experienced significant growth due to its convenience and versatility, catering to both domestic purposes and commercial sectors. The shift towards cordless and stick vacuums reflects consumers' preference for lightweight, easy-to-maneuver cleaning solutions. Online transaction channels have become increasingly popular, enabling seamless purchasing experiences for consumers.
- The vacuum cleaning market, which includes both stick and upright vacuum cleaners, continues to evolve, offering advanced features and technologies to maintain a clean atmosphere in various settings. Overall, the market is poised for continued expansion, driven by the increasing demand for efficient and effective cleaning solutions.
How is this Stick Vacuum Cleaner Industry segmented?
The stick vacuum cleaner industry research report provides comprehensive data (region-wise segment analysis), with forecasts and estimates in "USD million" for the period 2025-2029, as well as historical data from 2019-2023 for the following segments.
- Application
- Home
- Commercial
- Distribution Channel
- Offline
- Online
- Type
- Cordless vacuum cleaner
- Electric vacuum cleaner
- Geography
- APAC
- China
- India
- Japan
- South Korea
- North America
- US
- Canada
- Europe
- France
- Germany
- Italy
- UK
- South America
- Middle East and Africa
- APAC
By Application Insights
The home segment is estimated to witness significant growth during the forecast period. Stick vacuum cleaners, a type of cordless vacuum cleaner, have gained significant traction in the market due to their lightweight design and quick cleaning technology. These cleaning gadgets are increasingly becoming popular for household chores, catering primarily to domestic purposes and home use. The market for stick vacuum cleaners is expected to grow substantially during the forecast period, driven by the increasing trend of online retailing and the entry of new players specializing in battery-powered tools. Smart sensors, dust illumination, and anti-tangle technology are some of the advanced features that enhance the cleaning performance and user convenience of stick vacuum cleaners.
Portable and cordless vacuum cleaners, powered by lithium ion batteries, have gained popularity due to their ease of use and electricity usage efficiency. Charging stations ensure uninterrupted cleaning sessions, making these devices ideal for quick cleaning technology applications. Hard floors, carpets, and furniture are no match for these lightweight devices, which can be easily maneuvered up stairs and navigated through tight spaces. Battery power, runtime efficiency, and charging dock are essential considerations when purchasing a stick vacuum cleaner. The market offers various options for product durability, accessory compatibility, and warranty. Eco-friendly materials, modular design, and wall mount are additional features that add value to these devices. With the increasing hygiene awareness and the availability of smart sensors, LED display, voice control, self-cleaning brush, and dustbin design, stick vacuum cleaners are becoming an essential home appliance for many households.
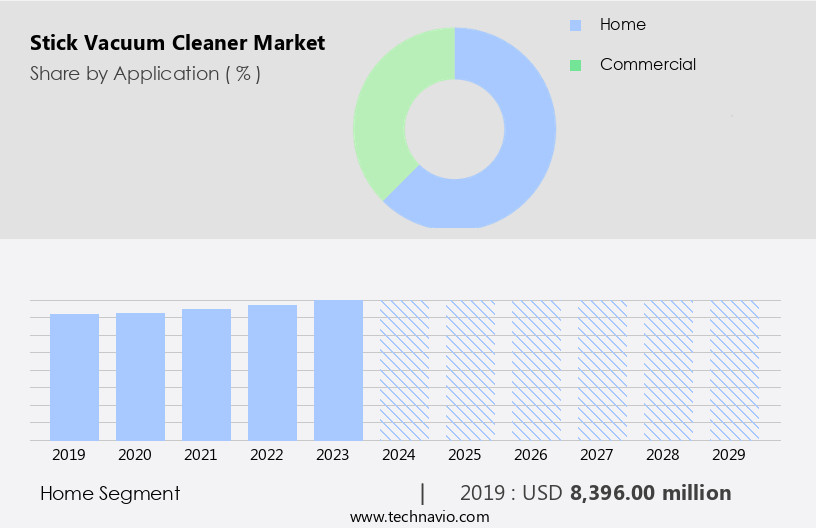
Get a glance at the market report of share of various segments Request Free Sample
The Home segment was valued at USD 8.4 billion in 2019 and showed a gradual increase during the forecast period.
Regional Analysis
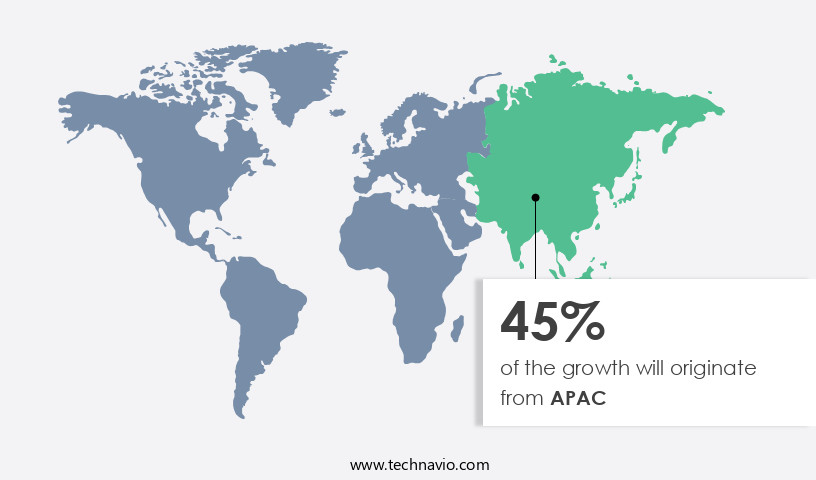
APAC is estimated to contribute 45% to the growth of the global market during the forecast period. Technavio's analysts have elaborately explained the regional trends and drivers that shape the market during the forecast period.
For more insights on the market size of various regions, Request Free Sample
The APAC market is projected to expand significantly due to several factors. These include increasing economic growth, high consumer disposable income, an aging population, the rise of smart cities, and the increasing preference for automated solutions. China is currently the largest market contributor in this region and is expected to maintain its dominance. Over the past decade, the adoption of stick vacuum cleaners has poured in countries like India and China, driven by the emergence of smart cities and the growing purchasing power of consumers. Key market trends include the increasing popularity of cordless vacuum cleaners, driven by their portability and lightweight design.
Lithium-ion batteries and quick charging technology have made cordless vacuum cleaners a convenient choice for both domestic and commercial purposes. Smart sensors, dust illumination, and voice control are some of the advanced features that are gaining traction in the market. Battery-powered tools, such as stick vacuum cleaners, are becoming increasingly popular for their energy efficiency and eco-friendliness. Online retailing platforms have made it easier for consumers to make online transactions and access a wide range of stick vacuum cleaners with various features, such as anti-tangle technology, filtration systems, and noise reduction. Product durability, accessory compatibility, and suction power are important considerations for consumers when purchasing stick vacuum cleaners.
The market also offers a range of luxury appliances with advanced features, such as ergonomic handles, LED displays, and charging docks, to enhance user convenience and cleaning performance. The market is expected to continue growing, driven by hygiene awareness and the increasing demand for smart, efficient, and convenient cleaning solutions. The market is also expected to benefit from the modular design and warranty options offered by manufacturers.
Market Dynamics
Our researchers analyzed the data with 2024 as the base year, along with the key drivers, trends, and challenges. A holistic analysis of drivers will help companies refine their marketing strategies to gain a competitive advantage.
What are the key market drivers leading to the rise in the adoption of Stick Vacuum Cleaner Industry?
- Growing number of smart cities is the key driver of the market. The global smart city market is experiencing significant growth due to the increasing adoption of technology to enhance urban living. Cities worldwide are embracing smart technologies to improve service levels, citizen well-being, sustainability, and economic development. Key benefits of smart cities include more effective, data-driven decision-making through the use of big data and connected devices. This enables city officials to make informed decisions in real-time, leading to improved city operations and enhanced citizen experiences. The market is driven by various factors, including the increasing urban population, government initiatives, and advancements in technology. The market is expected to continue growing as more cities invest in smart infrastructure and services.
- The implementation of these technologies is transforming urban landscapes and providing new opportunities for businesses and innovators. The smart city market encompasses various sectors, including transportation, energy and utilities, public safety, and healthcare. With the increasing focus on creating sustainable and livable cities, the market is poised for continued growth in the coming years.
What are the market trends shaping the Stick Vacuum Cleaner Industry?
- Growing demand via online retailing is the upcoming market trend. The e-commerce sector has experienced significant growth due to the increasing penetration of the Internet and the widespread use of smartphones. This trend is driving the adoption of online shopping among consumers worldwide. According to current research, the average transaction value and the number of online transactions continue to increase globally. The convenience of shopping from the comfort of one's home and the availability of quick shipping options are major factors contributing to the popularity of e-commerce.
- Furthermore, the wide range of products available online and the growing trust in this retail channel have significantly influenced consumer behavior. These factors collectively fuel the expansion of the e-commerce industry on a global scale.
What challenges does the Stick Vacuum Cleaner Industry face during its growth?
- Threat from counterfeit products is a key challenge affecting the industry growth. Counterfeit products pose a significant threat to the market, as they mislead retailers and consumers into purchasing replicas, believing them to be authentic. The production cost of counterfeit vacuum cleaners is significantly lower than that of original brands, making them an attractive alternative for some consumers. Manufacturers of counterfeit products meticulously replicate the packaging to create a semblance of authenticity.
- The rise of online shopping and social media platforms has increased doubts regarding the authenticity and quality of various products in the market. Consumers must exercise caution and ensure they are purchasing from reputable sources to avoid unintentionally buying counterfeit stick vacuum cleaners.
Exclusive Customer Landscape
The stick vacuum cleaner market forecasting report includes the adoption lifecycle of the market, covering from the innovator's stage to the laggard's stage. It focuses on adoption rates in different regions based on penetration. Furthermore, the stick vacuum cleaner market report also includes key purchase criteria and drivers of price sensitivity to help companies evaluate and develop their market growth analysis strategies.

Customer Landscape
Key Companies & Market Insights
Companies are implementing various strategies, such as strategic alliances, stick vacuum cleaner market forecast, partnerships, mergers and acquisitions, geographical expansion, and product/service launches, to enhance their presence in the industry.
Alfred Karcher SE and Co. KG - The company offers stick vacuum cleaners such as Karcher VC 4i Cordless Vacuum Cleaner.
The industry research and growth report includes detailed analyses of the competitive landscape of the market and information about key companies, including:
- Alfred Karcher SE and Co. KG
- Beko A and NZ Pty Ltd.
- BISSELL
- Dyson Group Co.
- Eastman Chemical Co.
- Electrolux group
- JS Global Lifestyle Co. Ltd.
- KENT RO Systems Ltd.
- klinsmann Intelligent Technology
- Koninklijke Philips NV
- LG Corp.
- Makita Corp.
- Miele and Cie. KG
- Nilfisk AS
- Panasonic Holdings Corp.
- Robert Bosch GmbH
- Samsung Electronics Co. Ltd.
- Stanley Black and Decker Inc.
- Techtronic Floor Care Technology Ltd
- Xiaomi Inc.
Qualitative and quantitative analysis of companies has been conducted to help clients understand the wider business environment as well as the strengths and weaknesses of key industry players. Data is qualitatively analyzed to categorize companies as pure play, category-focused, industry-focused, and diversified; it is quantitatively analyzed to categorize companies as dominant, leading, strong, tentative, and weak.
Research Analyst Overview
The global market, with a particular focus on vacuum cleaners, continues to experience significant growth due to the increasing demand for maintaining a clean atmosphere in both domestic and commercial sectors. This trend is driven by the widespread adoption of cordless vacuum cleaners, which offer the convenience of lightweight design and quick charging technology. One of the most popular types of cordless vacuum cleaners is the stick vacuum, which combines the maneuverability of a handheld vacuum with the suction power of an upright vacuum cleaner. These devices are powered by lithium-ion batteries, which provide longer runtime efficiency and are more energy efficient compared to their corded counterparts.
The rise of e-commerce platforms and online trading channels has made it easier for consumers to purchase battery-powered tools for various domestic purposes, including vacuum cleaners. The convenience of online transactions and the availability of a wide range of options have contributed to the growing popularity of stick vacuum cleaners. The demand for stick vacuum cleaners is not limited to home use but is also gaining traction in commercial sectors, particularly in hardwood floor settings. These devices are known for their lightweight design, which makes them easy to maneuver in tight spaces, and their smart sensors, which ensure optimal cleaning performance.
The market for stick vacuum cleaners is highly competitive, with numerous players offering various features to differentiate their products. Some of the key features that are gaining popularity include anti-tangle technology, dust illumination, smart connectivity, and voice control. Manufacturers are also focusing on product durability, accessory compatibility, filtration system, noise reduction, pet hair removal, and allergen control to cater to the evolving needs of consumers. Additionally, the use of eco-friendly materials and modular design is becoming increasingly important as consumers become more conscious of their environmental impact. Another trend in the market is the development of self-cleaning brushes and dustbin designs that make maintenance easier and more convenient for users.
Some models even come with charging docks that allow for easy and efficient charging, further enhancing the user experience. As the market for stick vacuum cleaners continues to grow, manufacturers are also offering various warranty options and portability features to cater to the diverse needs of consumers. The focus on user convenience, cleaning performance, and energy efficiency is expected to drive the growth of this market in the coming years.
|
Market Scope |
|
|
Report Coverage |
Details |
|
Page number |
215 |
|
Base year |
2024 |
|
Historic period |
2019-2023 |
|
Forecast period |
2025-2029 |
|
Growth momentum & CAGR |
Accelerate at a CAGR of 4.2% |
|
Market growth 2025-2029 |
USD 3.41 billion |
|
Market structure |
Fragmented |
|
YoY growth 2024-2025(%) |
3.9 |
|
Key countries |
China, US, Germany, Japan, Canada, France, India, UK, South Korea, and Italy |
|
Competitive landscape |
Leading Companies, Market Positioning of Companies, Competitive Strategies, and Industry Risks |
What are the Key Data Covered in this Stick Vacuum Cleaner Market Research and Growth Report?
- CAGR of the Stick Vacuum Cleaner industry during the forecast period
- Detailed information on factors that will drive the growth and forecasting between 2025 and 2029
- Precise estimation of the size of the market and its contribution of the industry in focus to the parent market
- Accurate predictions about upcoming growth and trends and changes in consumer behaviour
- Growth of the market across APAC, North America, Europe, South America, and Middle East and Africa
- Thorough analysis of the market's competitive landscape and detailed information about companies
- Comprehensive analysis of factors that will challenge the stick vacuum cleaner market growth and forecasting
We can help! Our analysts can customize this stick vacuum cleaner market research report to meet your requirements.