
Stock Video Market Size 2025-2029
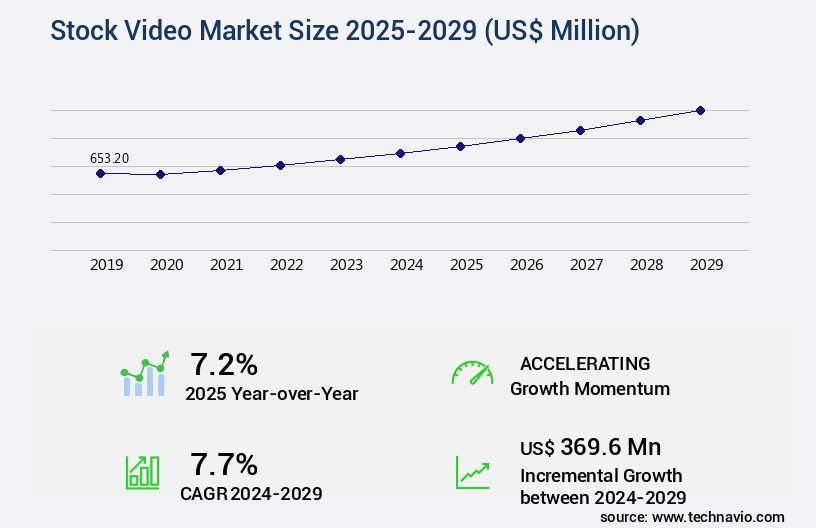
The stock video market size is valued to increase by USD 369.6 million, at a CAGR of 7.7% from 2024 to 2029. Benefits of using stock videos for visual content creation will drive the stock video market.
Major Market Trends & Insights
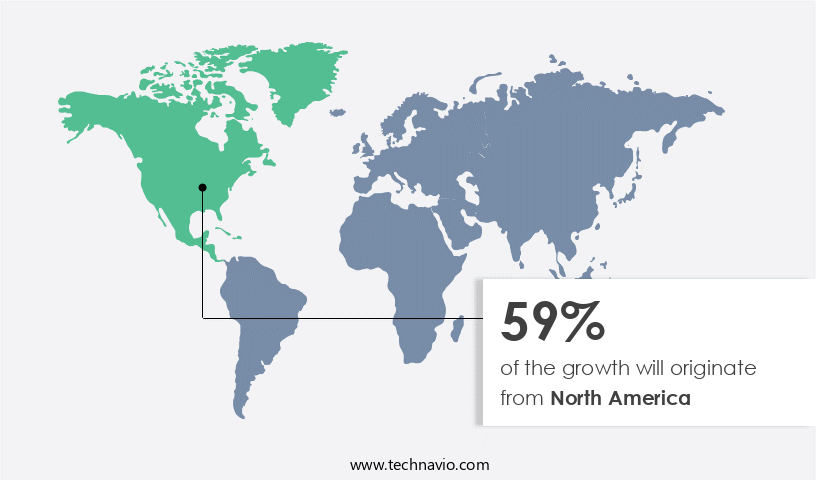
- North America dominated the market and accounted for a 59% growth during the forecast period.
- By Application - Editorial segment was valued at USD 341.00 million in 2023
- By Image Source - Macrostock segment accounted for the largest market revenue share in 2023
Market Size & Forecast
- Market Opportunities: USD 82.03 million
- Market Future Opportunities: USD 369.60 million
- CAGR from 2024 to 2029 : 7.7%
Market Summary
- In the realm of visual content creation, stock videos have emerged as a preferred choice for businesses seeking cost-effective, high-quality multimedia assets. The market, valued at USD3.5 billion in 2020, is poised for significant growth as advancements in artificial intelligence (AI) and machine learning (ML) technologies revolutionize content production. These technologies enable the creation of increasingly authentic and diverse visuals, catering to the evolving demands of businesses. However, the high price point associated with premium stock video platforms can be a barrier for some organizations. As a result, the market is witnessing a surge in the emergence of affordable alternatives, offering businesses access to a vast library of visually appealing and professional-grade videos.
- The integration of AI and ML in stock video production has led to the democratization of high-quality visual content, making it accessible to businesses of all sizes. Despite the growing competition, the market's future remains promising, with trends such as personalized video content, 360-degree videos, and virtual reality experiences shaping its evolution. As businesses continue to prioritize engaging and visually appealing content to connect with their audiences, the demand for stock videos is expected to persist and grow.
What will be the Size of the Stock Video Market during the forecast period?
Get Key Insights on Market Forecast (PDF) Request Free Sample
How is the Stock Video Market Segmented ?
The stock video industry research report provides comprehensive data (region-wise segment analysis), with forecasts and estimates in "USD million" for the period 2025-2029, as well as historical data from 2019-2023 for the following segments.
- Application
- Editorial
- Commercial
- Image Source
- Macrostock
- Microstock
- License Model
- RM
- RF
- Type
- Subscription
- Pay per download
- Enterprise licensing
- Distribution Channel
- Stock video platforms
- Social media and creator platforms
- Direct sales and agencies
- Cloud-based video libraries
- Geography
- North America
- US
- Canada
- Europe
- France
- Germany
- Italy
- UK
- APAC
- India
- Japan
- South Korea
- South America
- Brazil
- Rest of World (ROW)
- North America
By Application Insights
The editorial segment is estimated to witness significant growth during the forecast period.
The market continues to evolve, catering to the increasing demand for high-quality visual content in various industries. With advancements in video technology, there is a growing preference for videos in resolutions up to 8k and encoding formats like Av1 and H.265. Music licensing and sound design are integral parts of video marketing strategies, with royalty-free music being a popular choice. Video transcoding and optimization using codec compression algorithms like H.264 and H.265 ensure seamless streaming through video streaming protocols. Adaptive bitrate streaming and closed captions enhance video accessibility. Motion graphics, visual effects, and color grading techniques add appeal, while video analytics provide engagement metrics.
Video editing software and content delivery networks facilitate efficient production and distribution. According to recent reports, the stock footage licensing market size was valued at USD1.2 billion in 2020 and is projected to grow at a CAGR of 12.3% from 2021 to 2028. This growth is fueled by the need for professional-grade videos for various applications, including video marketing, branding, and promotional content.
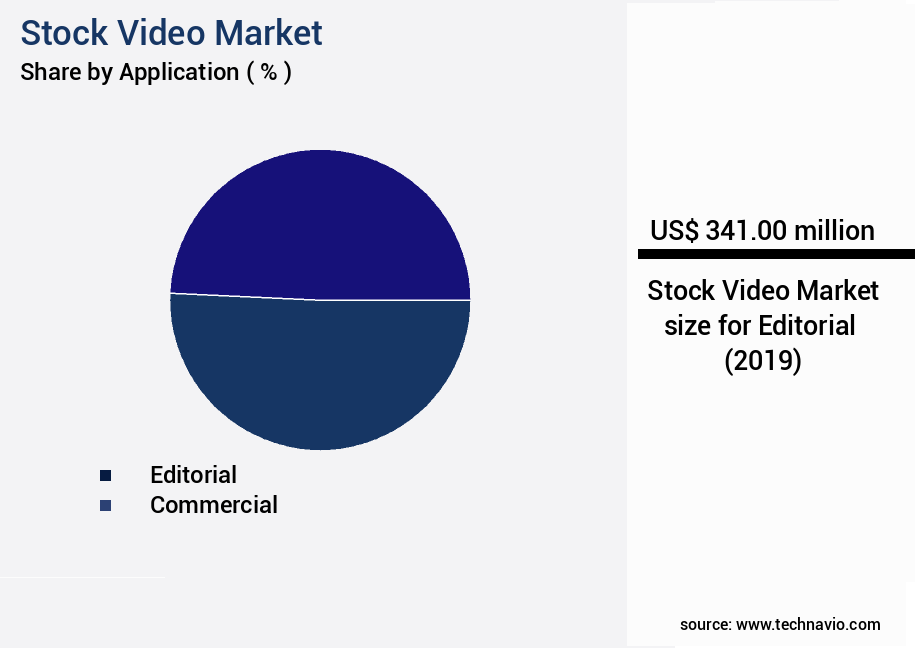
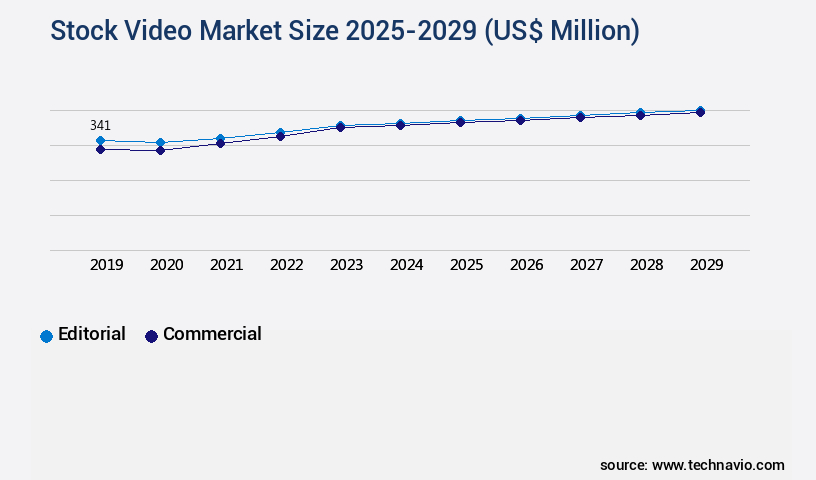
The Editorial segment was valued at USD 341.00 million in 2019 and showed a gradual increase during the forecast period.
Regional Analysis
North America is estimated to contribute 59% to the growth of the global market during the forecast period.Technavio's analysts have elaborately explained the regional trends and drivers that shape the market during the forecast period.
See How Stock Video Market Demand is Rising in North America Request Free Sample
North America's market holds a substantial share in the global industry, characterized by its extensive collection of top-tier footage. This region's dominance is attributed to the presence of prominent stock video companies headquartered here. For instance, Shutterstock Inc. And Getty Images Holdings Inc., both based in the US, provide an extensive catalog of stock videos, encompassing various categories such as nature, business, sports, and lifestyle.
The market in North America continues to thrive due to the offerings of these platforms, catering to diverse business requirements.
Market Dynamics
Our researchers analyzed the data with 2024 as the base year, along with the key drivers, trends, and challenges. A holistic analysis of drivers will help companies refine their marketing strategies to gain a competitive advantage.
The market is experiencing significant growth as businesses and content creators increasingly recognize the value of high-quality visual storytelling. With advancements in high-resolution video production techniques, creating professional-grade videos has become more accessible than ever. However, to maximize reach and engagement, it's essential to optimize videos for social media platforms, employing advanced video editing workflow strategies. Effective video marketing campaign metrics, such as view count, engagement rate, and click-through rate, provide valuable insights into video performance. The impact of video compression on streaming quality is a critical consideration, as is the choice of appropriate video encoding formats and effective video SEO strategies.
Understanding various video streaming protocols, such as HLS and DASH, is essential for managing video storage and delivery costs. Professional video production equipment considerations include cameras, microphones, and lighting equipment, while techniques for improving video accessibility, such as closed captioning and audio descriptions, ensure a wider audience reach. Analyzing video engagement metrics, best practices for video monetization, and utilizing advanced video editing software features are all crucial components of a successful video strategy. Integrating royalty-free music into video productions enhances the overall viewing experience, while effective strategies for video distribution, such as targeted advertising and influencer partnerships, expand reach. Advanced color grading techniques for professional videos add a polished finish, and managing video storage and delivery costs through cloud-based solutions is a smart investment. Overall, the market offers numerous opportunities for businesses and content creators to engage audiences and drive growth.
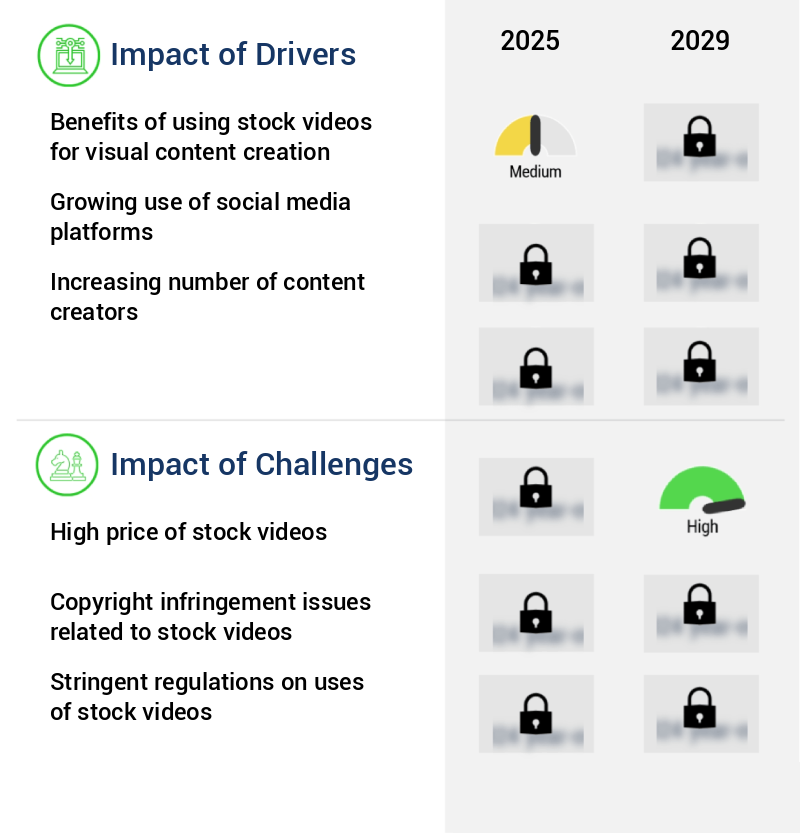
What are the key market drivers leading to the rise in the adoption of Stock Video Industry?
- The significance of utilizing stock videos for visual content creation is a primary factor fueling market growth.
- Stock videos have become an essential resource for video producers seeking to save time and money in creating commercial content. These pre-recorded clips offer a wide range of generic ideas, enabling their use in various projects without the need for on-location filming or extensive production costs. The market for stock videos is continuously evolving, with new content being added daily across numerous categories. According to data, the adoption rate of stock videos has seen significant growth, with businesses recognizing their value in enhancing visual storytelling and reducing production expenses. In comparison to creating video content from scratch, the use of stock videos offers substantial savings, as it eliminates the need for location, equipment, crew, and talent expenses.
- Moreover, the market caters to diverse industries, including advertising, education, healthcare, and technology, among others. The versatility of stock videos lies in their ability to convey a professional image, making them an ideal choice for businesses aiming to create engaging and high-quality content for their audience.
What are the market trends shaping the Stock Video Industry?
- The adoption of artificial intelligence (AI) and machine learning (ML) is increasingly prevalent in the market, representing an emerging trend.
- The adoption of artificial intelligence (AI) and machine learning (ML) in the stock video industry has witnessed a notable upsurge. This trend has led to substantial improvements, transforming the way stock videos are generated, edited, and disseminated. The primary catalyst for this increasing utilization of AI and ML in stock videos is the capacity to automate and expedite the content creation process. AI algorithms can analyze extensive data to discern popular patterns, themes, and keywords, enabling creators to generate pertinent and sought-after content more proficiently.
- For instance, an AI algorithm can scrutinize social media platforms to pinpoint the most widely-shared and favored video content, instigating the creation of analogous videos with a heightened likelihood of success.
What challenges does the Stock Video Industry face during its growth?
- The escalating cost of stock videos poses a significant challenge to the growth of the industry. This issue, which is mandatory for professionals to address, can hinder progress and potentially limit the expansion of businesses that rely on visually engaging content.
- The Royalty-Free (RF) and Restricted-Use (RM) the markets exhibit distinct differences in pricing and usage rights. While RF stock videos are generally more affordable, with prices ranging from USD60 to USD200 per video, RM stock videos are pricier. The primary distinction lies in the licensing terms. RM stock videos come with geographical and time restrictions, allowing for one-time use only. In contrast, RF videos offer more flexibility, enabling multiple uses and no geographical limitations.
- The choice between these two options depends on the specific requirements of the project. It's essential for businesses to carefully consider their needs and budget when selecting stock videos to ensure they make an informed decision.
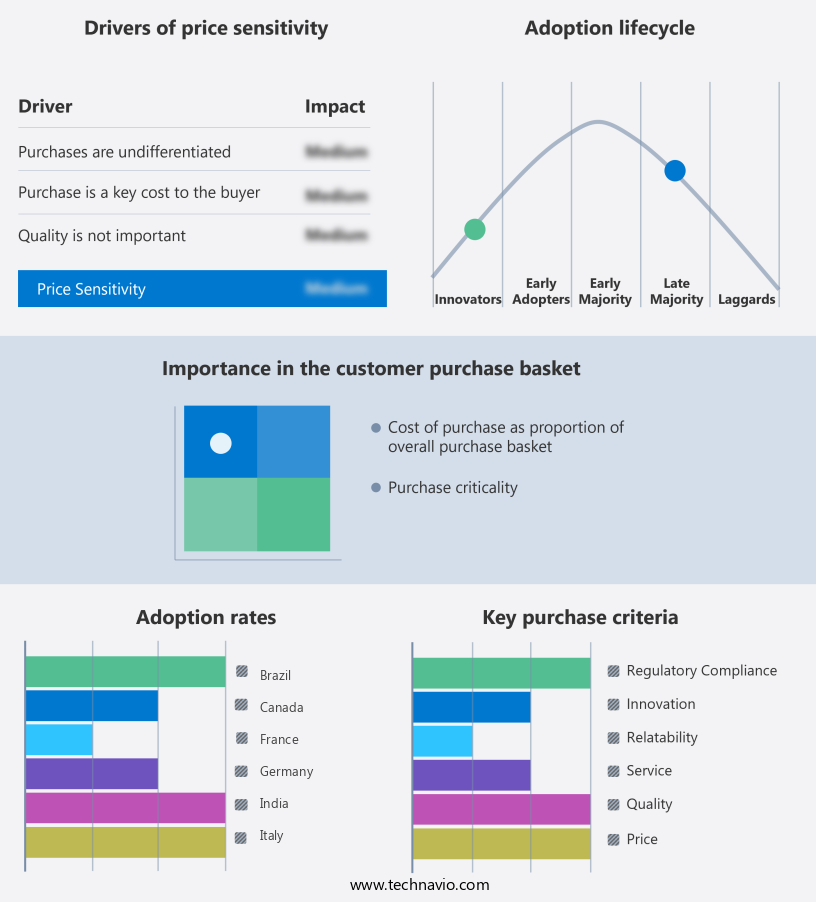
Exclusive Technavio Analysis on Customer Landscape
The stock video market forecasting report includes the adoption lifecycle of the market, covering from the innovator's stage to the laggard's stage. It focuses on adoption rates in different regions based on penetration. Furthermore, the stock video market report also includes key purchase criteria and drivers of price sensitivity to help companies evaluate and develop their market growth analysis strategies.
Customer Landscape of Stock Video Industry
Competitive Landscape
Companies are implementing various strategies, such as strategic alliances, stock video market forecast, partnerships, mergers and acquisitions, geographical expansion, and product/service launches, to enhance their presence in the industry.
Adobe Inc. - This company specializes in providing high-definition (HD) and 4K stock videos, along with motion graphics, for various industries and applications. Their extensive collection caters to diverse needs, ensuring visual storytelling of the highest quality.
The industry research and growth report includes detailed analyses of the competitive landscape of the market and information about key companies, including:
- Adobe Inc.
- Alamy Ltd.
- Can Stock Photo Inc.
- Canva Pty Ltd.
- Depositphotos Inc.
- Dissolve Inc.
- Dreamstime
- Eezy Inc.
- Envato Pty Ltd.
- Footage Firm Inc.
- Freepik Co. S.L
- Getty Images Holdings Inc.
- Inmagine Lab Pte. Ltd.
- Lightstock LLC
- Nimia Inc.
- Oxford Media Solutions Ltd.
- Pixabay GmbH
- PIXTA Inc.
- Pond5 Inc.
- Science Photo Library Ltd.
- Shutterstock Inc.
- Thomson Reuters Corp.
- WeVideo Inc.
Qualitative and quantitative analysis of companies has been conducted to help clients understand the wider business environment as well as the strengths and weaknesses of key industry players. Data is qualitatively analyzed to categorize companies as pure play, category-focused, industry-focused, and diversified; it is quantitatively analyzed to categorize companies as dominant, leading, strong, tentative, and weak.
Recent Development and News in Stock Video Market
- In January 2024, Shutterstock, a leading stock media provider, announced the acquisition of Clipstock, a niche player in the market, for an undisclosed sum. This acquisition was aimed at expanding Shutterstock's video offerings and strengthening its competitive position (Shutterstock Press Release, 2024).
- In March 2024, Getty Images and Adobe signed a multi-year partnership to make Getty Images' stock footage available through Adobe's video editing software, Premiere Pro. This collaboration enabled Adobe's users to access Getty Images' extensive video library directly from the software, streamlining the content licensing process (Adobe Press Release, 2024).
- In May 2024, Pond5, a major stock media marketplace, raised USD30 million in a Series C funding round led by Insight Partners. The funds were earmarked for product development, expanding its global footprint, and enhancing its technology platform (Pond5 Press Release, 2024).
- In February 2025, Vimeo, a popular video hosting platform, launched Vimeo Stock, its new the marketplace. This move aimed to compete directly with established players like Shutterstock and Getty Images, offering a more affordable pricing model and a curated selection of videos (Vimeo Press Release, 2025).
Dive into Technavio's robust research methodology, blending expert interviews, extensive data synthesis, and validated models for unparalleled Stock Video Market insights. See full methodology.
|
Market Scope |
|
|
Report Coverage |
Details |
|
Page number |
247 |
|
Base year |
2024 |
|
Historic period |
2019-2023 |
|
Forecast period |
2025-2029 |
|
Growth momentum & CAGR |
Accelerate at a CAGR of 7.7% |
|
Market growth 2025-2029 |
USD 369.6 million |
|
Market structure |
Fragmented |
|
YoY growth 2024-2025(%) |
7.2 |
|
Key countries |
US, UK, Germany, Canada, France, Japan, India, Italy, Brazil, and South Korea |
|
Competitive landscape |
Leading Companies, Market Positioning of Companies, Competitive Strategies, and Industry Risks |
Research Analyst Overview
- The market continues to evolve, driven by advancements in video technology and shifting consumer preferences. One notable trend is the increasing demand for high-quality video content, with 4k and 8k video production becoming more common. For instance, a leading video production company reported a 30% increase in 4k video requests in the past year. To meet this demand, video compression algorithms such as H.264, H.265, AV1 encoding, and VP9 encoding play a crucial role in optimizing video files for efficient delivery. Additionally, adaptive bitrate streaming ensures seamless video playback across various devices and network conditions. Music licensing and sound design are essential components of video marketing strategies, with royalty-free music offering cost-effective solutions.
- Video metadata, including frame rate, audio synchronization, and visual effects, also plays a significant role in enhancing the viewer experience. Video analytics and video editing software enable content creators to measure engagement metrics and refine their video marketing strategies. Moreover, video optimization techniques, such as color grading and video stabilization, help produce visually appealing content. Content delivery networks and motion graphics further enrich the video experience, while video transcoding and video streaming protocols ensure compatibility across various platforms. Video accessibility features, including closed captions and audio descriptions, expand the reach of video content. The market is expected to grow at a robust rate, with industry analysts projecting a 15% annual growth rate over the next five years.
- This growth is fueled by the increasing adoption of video content in various sectors, including marketing, education, and entertainment.
What are the Key Data Covered in this Stock Video Market Research and Growth Report?
-
What is the expected growth of the Stock Video Market between 2025 and 2029?
-
USD 369.6 million, at a CAGR of 7.7%
-
-
What segmentation does the market report cover?
-
The report is segmented by Application (Editorial and Commercial), Image Source (Macrostock and Microstock), License Model (RM and RF), Type (Subscription, Pay per download, and Enterprise licensing), Distribution Channel (Stock video platforms, Social media and creator platforms, Direct sales and agencies, and Cloud-based video libraries), and Geography (North America, Europe, APAC, Middle East and Africa, and South America)
-
-
Which regions are analyzed in the report?
-
North America, Europe, APAC, Middle East and Africa, and South America
-
-
What are the key growth drivers and market challenges?
-
Benefits of using stock videos for visual content creation, High price of stock videos
-
-
Who are the major players in the Stock Video Market?
-
Adobe Inc., Alamy Ltd., Can Stock Photo Inc., Canva Pty Ltd., Depositphotos Inc., Dissolve Inc., Dreamstime, Eezy Inc., Envato Pty Ltd., Footage Firm Inc., Freepik Co. S.L, Getty Images Holdings Inc., Inmagine Lab Pte. Ltd., Lightstock LLC, Nimia Inc., Oxford Media Solutions Ltd., Pixabay GmbH, PIXTA Inc., Pond5 Inc., Science Photo Library Ltd., Shutterstock Inc., Thomson Reuters Corp., and WeVideo Inc.
-
Market Research Insights
- The market for stock video continues to expand, with an increasing number of businesses and content creators seeking visually engaging media for their digital platforms. According to recent industry reports, the demand for stock footage is projected to grow by 15% annually over the next five years. For instance, a video production company experienced a 20% increase in sales by incorporating more stock footage into their client projects.
- This trend underscores the value of high-quality, versatile video content in today's digital landscape. Additionally, the video production workflow involves various stages, including audio mixing, video encoding settings, video editing tools, and video distribution platforms, among others. These elements contribute to the continuous evolution of the market.
We can help! Our analysts can customize this stock video market research report to meet your requirements.
 RIA -
RIA - 
