
Styrene-Butadiene-Styrene (SBS) Block Copolymer Market Size 2025-2029
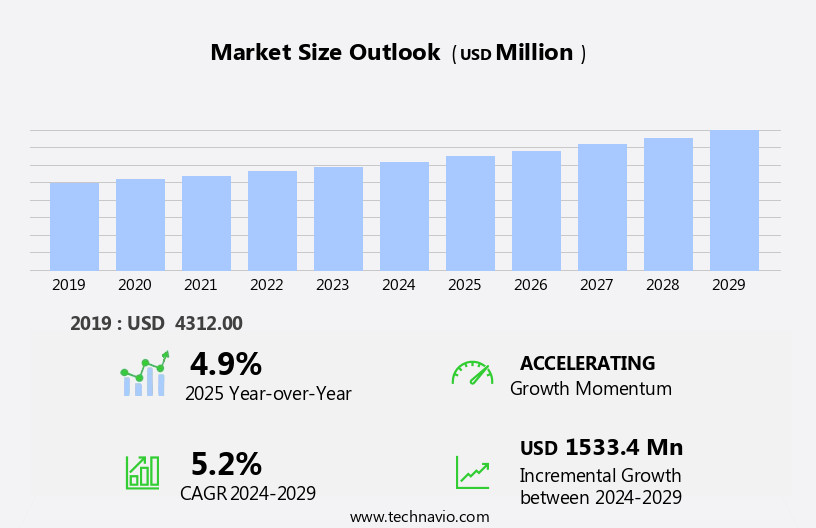
The styrene-butadiene-styrene (SBS) block copolymer market size is forecast to increase by USD 1.53 billion at a CAGR of 5.2% between 2024 and 2029.
- The market is experiencing significant growth, driven primarily by the increasing demand from the construction industry in emerging economies. This sector's expansion is attributed to the rising infrastructure development and urbanization trends in regions like Asia-Pacific and South America. Another key factor fueling market growth is the shift in feedstock type towards natural gas, which has led to a decrease in production costs and an improvement in product quality. However, the market is not without challenges. The volatility in raw material prices, particularly for butadiene and styrene, poses a significant threat to market stability. Companies operating in this space must closely monitor these price fluctuations and adapt their strategies accordingly to maintain profitability. Another trend influencing the market is the shift in feedstock type towards natural gas, which is more cost-effective and environmentally friendly compared to naphtha. However, the market faces challenges from the volatility in raw material prices, particularly for butadiene and styrene, which can impact the profitability of SBS producers.
- Additionally, the intensifying competition and the emergence of alternative materials could limit the market's growth potential. To capitalize on the opportunities and navigate these challenges effectively, market participants should focus on product innovation, cost optimization, and strategic partnerships.
What will be the Size of the Styrene-Butadiene-Styrene (SBS) Block Copolymer Market during the forecast period?
- The market in the United States is experiencing significant activity and growth, driven by various factors. Energy efficiency and the adoption of sustainable polymers are key trends, as industries seek to reduce their carbon footprint and promote environmental responsibility. Distribution networks are expanding to meet the increasing demand for these versatile polymers, enabling better customer service and application development. Performance enhancement through disruptive innovation, industry consolidation, and technology adoption are shaping the market's direction. Quality control, standards compliance, and safety standards are essential considerations, reflecting the industry's commitment to excellence. Environmental factors, including the use of renewable resources and green chemistry, are influencing the market's technological and social dynamics. The renewable energy sector is another significant end-user industry for SBS, with applications in thermoplastic elastomers (TPE) and coatings.
- Polymer chemistry, material science, and emerging technologies are driving research and development in this field, providing a competitive advantage for market participants. Molding technology, safety standards, and physical properties are critical aspects of copolymers' application in various industries. The market's growth is further influenced by economic factors, rheological behavior, product differentiation, and material engineering. As the circular economy gains momentum, the copolymer market is embracing intellectual property, technical support, compounding technology, and extrusion processing to optimize production and reduce waste. Bio-based polymers and the integration of rubber chemistry are also emerging areas of interest, contributing to the market's ongoing evolution.
How is this Styrene-Butadiene-Styrene (SBS) Block Copolymer Industry segmented?
The styrene-butadiene-styrene (SBS) block copolymer industry research report provides comprehensive data (region-wise segment analysis), with forecasts and estimates in "USD million" for the period 2025-2029, as well as historical data from 2019-2023 for the following segments.
- Application
- PMA
- ASC
- Others
- End-user
- Automobile
- Electronics
- Medical
- Construction
- Manufacturing Type
- Solution polymerization
- Emulsion polymerization
- Others
- Product Type
- Linear SBS
- Radial SBS
- Others
- Geography
- APAC
- Australia
- China
- India
- Japan
- South Korea
- North America
- US
- Canada
- Europe
- France
- Germany
- Italy
- South America
- Middle East and Africa
- APAC
By Application Insights
The PMA segment is estimated to witness significant growth during the forecast period. SBS block copolymers play a significant role in modifying the rheological properties of asphalt, which is extensively used in highway and road construction, as well as in paving and roofing applications. The escalating spending on residential and commercial construction activities is anticipated to boost the consumption of copolymers in Polymer-Modified Asphalt (PMA) applications. The application of polymers, including copolymers, ethylene vinyl acetate, styrene-butadiene rubber, and polyethylene, in asphalt modification is gaining traction due to the growing infrastructure development in emerging economies. The copolymers offer enhanced impact resistance, tear resistance, elongation at break, thermal stability, and weather resistance, making them an ideal choice for modifying asphalt. However, market fluctuations can be attributed to the volatility of crude oil prices, which impact the production costs of SB latex. Producers must navigate these challenges to maintain profitability and meet the evolving demands of consumers.
Additionally, they provide vibration damping and improve the elastomeric properties of rubber compounds used in various industries such as building and construction, footwear, and consumer goods. Furthermore, copolymers are employed in non-food packaging, injection molding, tire applications, and adhesive applications, among others, due to their chemical resistance, abrasion resistance, and tensile strength. The domain size of copolymers can be tailored to suit specific applications, providing customized solutions for various industries.

Get a glance at the market report of share of various segments Request Free Sample
The PMA segment was valued at USD 1.85 billion in 2019 and showed a gradual increase during the forecast period.
Regional Analysis
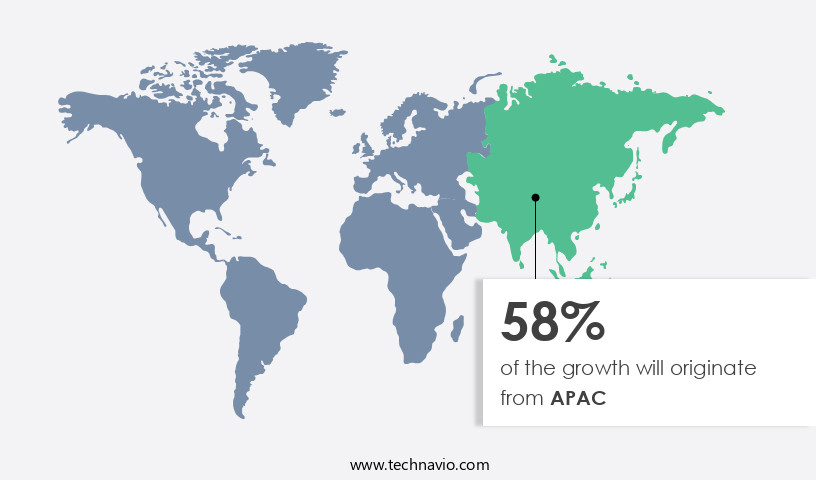
APAC is estimated to contribute 58% to the growth of the global market during the forecast period. Technavio's analysts have elaborately explained the regional trends and drivers that shape the market during the forecast period.
For more insights on the market size of various regions, Request Free Sample
The market is experiencing significant growth, particularly in the APAC region, which accounted for the largest share in 2024. The demand for copolymers is primarily driven by the increasing usage in adhesive and sealant applications across various industries such as construction, furniture, and automotive. In the automotive sector, copolymers are extensively used to manufacture adhesives and sealants due to their excellent elastomeric properties, impact resistance, and chemical resistance. The rapid expansion of the automotive industry in APAC, particularly in China, is fueling the demand for copolymers. China is currently the largest consumer of copolymers in APAC, owing to the high demand from industries including manufacturing, electronics, footwear, packaging, and automobile manufacturing. In cement, SB latex enhances compressive strength and bonding adhesion, while in tensile strength, it improves the overall stability of the material.
Additionally, copolymers are employed in various other applications such as bitumen modification, roofing membranes, film extrusion, injection molding, and tire applications, among others. The market is expected to continue its growth trajectory during the forecast period due to the increasing demand for these versatile polymers in various end-use industries.
Market Dynamics
Our researchers analyzed the data with 2024 as the base year, along with the key drivers, trends, and challenges. A holistic analysis of drivers will help companies refine their marketing strategies to gain a competitive advantage.
What are the key market drivers leading to the rise in the adoption of Styrene-Butadiene-Styrene (SBS) Block Copolymer Industry?
- Increasing demand from construction industry in emerging economies is the key driver of the market. The global infrastructure sector is witnessing a notable expansion due to the increasing number of projects driven by population growth and regulatory support from governments. In this context, advanced materials like Styrene-Butadiene-Styrene (SBS) block copolymers are gaining traction. Technological advancements, such as smart building technologies, are encouraging contractors to construct new, sophisticated structures, particularly in countries like South Africa, India, and Egypt, known for their firm structures. For instance, the Stockholm Bypass project in Europe features one of the longest road tunnels, spanning 16.5 km, and is set to be completed by 2026. China holds the largest market share for SBS block copolymers due to its significant infrastructure development and industrial growth. These advancements in infrastructure and the subsequent demand for durable materials make SBS block copolymers an essential component in various construction applications.
What are the market trends shaping the Styrene-Butadiene-Styrene (SBS) Block Copolymer Industry?
- Shift in feedstock type is the upcoming market trend. The butadiene market dynamics have experienced significant shifts in the last decade, primarily due to the transformation in feedstock production. The trend towards ethylene as the primary precursor for butadiene production has gained momentum. This transition is largely attributed to the shale revolution in the US, which has resulted in a in natural gas production. Advanced oil and gas production technologies, including horizontal drilling and hydraulic fracturing, have facilitated the extraction of vast quantities of oil and gas in the US. The shale gas boom has encouraged companies to adopt liquid cracking techniques to produce natural gas and other petroleum products, such as ethane, as an alternative to conventional ethylene. This shift in production methods has influenced the butadiene market, leading to increased availability and potential cost reductions.
What challenges does the Styrene-Butadiene-Styrene (SBS) Block Copolymer Industry face during its growth?
- Volatility in raw material prices is a key challenge affecting the industry growth. The SBS block copolymer market faces challenges due to the volatility in the cost of petroleum-based raw materials. As styrene, butadiene, additives, and resins are derived from petroleum, their prices are directly linked to crude oil prices. The declining crude oil prices in recent years have led oil and gas industry players to adopt cost-cutting measures such as workforce reductions and rig idling. This trend poses a significant challenge to the global SBS block copolymer market, as the raw material costs directly impact the final product pricing and profitability. Despite these challenges, the increasing demand for SBS block copolymers in emerging economies continues to drive market growth. These polymers are widely used in various industries, including automotive, construction, and electronics, due to their excellent properties such as high impact strength, flexibility, and resistance to heat and chemicals. Therefore, market participants are focusing on innovation and cost optimization to mitigate the impact of raw material price fluctuations and maintain competitiveness in the market.
Exclusive Customer Landscape
The styrene-butadiene-styrene (SBS) block copolymer market forecasting report includes the adoption lifecycle of the market, covering from the innovator's stage to the laggard's stage. It focuses on adoption rates in different regions based on penetration. Furthermore, the styrene-butadiene-styrene (SBS) block copolymer market report also includes key purchase criteria and drivers of price sensitivity to help companies evaluate and develop their market growth analysis strategies.

Customer Landscape
Key Companies & Market Insights
Companies are implementing various strategies, such as strategic alliances, styrene-butadiene-styrene (SBS) block copolymer market forecast, partnerships, mergers and acquisitions, geographical expansion, and product/service launches, to enhance their presence in the industry.
Asahi Kasei Corp. - The company specializes in the production and supply of styrene-butadiene-styrene block copolymers, including Asadene, Tufdene, and Asaprene.
The industry research and growth report includes detailed analyses of the competitive landscape of the market and information about key companies, including:
- Asahi Kasei Corp.
- BASF SE
- Chevron Phillips Chemical Co. LLC
- Chimei Corp.
- China Petrochemical Corp.
- DL Chemical
- The Dow Chemical Co.
- Dycon Chemicals
- En Chuan Chemical Industries Co. Ltd.
- Eni SpA
- INEOS Group Holdings S.A.
- Lanxess AG
- LCY Chemical Corp.
- LG Chem Ltd.
- Milagro Rubber Co. Inc.
- Miller Waste Mills Inc.
- Repsol SA
- Solventis Ltd.
- TotalEnergies SE
- TSRC Corp.
Qualitative and quantitative analysis of companies has been conducted to help clients understand the wider business environment as well as the strengths and weaknesses of key industry players. Data is qualitatively analyzed to categorize companies as pure play, category-focused, industry-focused, and diversified; it is quantitatively analyzed to categorize companies as dominant, leading, strong, tentative, and weak.
Research Analyst Overview
SBS block copolymers, a type of thermoplastic elastomer, have gained significant attention in various industries due to their unique properties. These copolymers are known for their ability to provide excellent elastomeric properties, impact resistance, and chemical resistance. The demand for SBS block copolymers is driven by their versatility in different applications. In the processing industry, they are extensively used as processing aids in sheet extrusion and film extrusion processes. The use of SBS block copolymers in these applications enhances the processing properties of the polymers, leading to improved product quality and reduced manufacturing costs. Moreover, SBS block copolymers find extensive applications in the sealant industry. In the coatings sector, SBL is widely used as a binder in paints and coatings due to its excellent film-forming properties and resistance to water, chemicals, and UV light.
They are used in the production of sealant applications, including asphalt modification and bitumen modification. These copolymers offer excellent adhesion properties and high tensile strength, making them an ideal choice for sealant applications. SBS block copolymers are also widely used in the rubber industry for modification purposes. Rubber modification using SBS block copolymers enhances the elastomeric properties of the rubber, leading to improved impact resistance, tear resistance, and elongation at break. These properties make SBS block copolymers an essential component in the production of synthetic rubber and rubber compounds. In the building and construction industry, SBS block copolymers are used as additives in roofing membranes. This elastomer is derived from the polymerization reaction of butadiene and styrene monomers, with the aid of an emulsifier.
They offer excellent weather resistance and thermal stability, making them an ideal choice for roofing applications. Moreover, they provide vibration damping properties, which are essential in the construction industry. SBS block copolymers also find extensive applications in non-food packaging. They offer excellent chemical resistance and are used as processing aids in injection molding processes. These copolymers are also used in the production of thermoplastic elastomers, which are widely used in tire applications, including tire tread and athletic footwear. The use of SBS block copolymers in the footwear industry is significant due to their excellent abrasion resistance and tear resistance properties. These properties make SBL-based sealants an excellent choice for sealing applications in construction, automotive, and various industrial sectors.
They are used in the production of shoe soles and athletic footwear, providing enhanced durability and comfort. The domain size of SBS block copolymers allows for phase separation, which is essential in their application as thermoplastic elastomers. This property enables the production of materials with a wide range of elastomeric properties, making them an ideal choice for various industries. SBS block copolymers are a versatile class of materials with a wide range of applications. Their unique properties, including impact resistance, chemical resistance, elastomeric properties, and processing aid properties, make them an essential component in various industries, including the processing industry, rubber industry, building and construction industry, and non-food packaging industry. The demand for SBS block copolymers is expected to continue growing due to their versatility and the increasing demand for materials with improved properties in various applications.
|
Market Scope |
|
|
Report Coverage |
Details |
|
Page number |
248 |
|
Base year |
2024 |
|
Historic period |
2019-2023 |
|
Forecast period |
2025-2029 |
|
Growth momentum & CAGR |
Accelerate at a CAGR of 5.2% |
|
Market growth 2025-2029 |
USD 1.53 billion |
|
Market structure |
Fragmented |
|
YoY growth 2024-2025(%) |
4.9 |
|
Key countries |
China, US, Japan, France, India, Canada, South Korea, Australia, Germany, and Italy |
|
Competitive landscape |
Leading Companies, Market Positioning of Companies, Competitive Strategies, and Industry Risks |
What are the Key Data Covered in this Styrene-Butadiene-Styrene (SBS) Block Copolymer Market Research and Growth Report?
- CAGR of the Styrene-Butadiene-Styrene (SBS) Block Copolymer industry during the forecast period
- Detailed information on factors that will drive the growth and forecasting between 2025 and 2029
- Precise estimation of the size of the market and its contribution of the industry in focus to the parent market
- Accurate predictions about upcoming growth and trends and changes in consumer behaviour
- Growth of the market across APAC, North America, Europe, South America, and Middle East and Africa
- Thorough analysis of the market's competitive landscape and detailed information about companies
- Comprehensive analysis of factors that will challenge the styrene-butadiene-styrene (SBS) block copolymer market growth of industry companies
We can help! Our analysts can customize this styrene-butadiene-styrene (SBS) block copolymer market research report to meet your requirements.