Sugar Confectionery Market Size 2024-2028
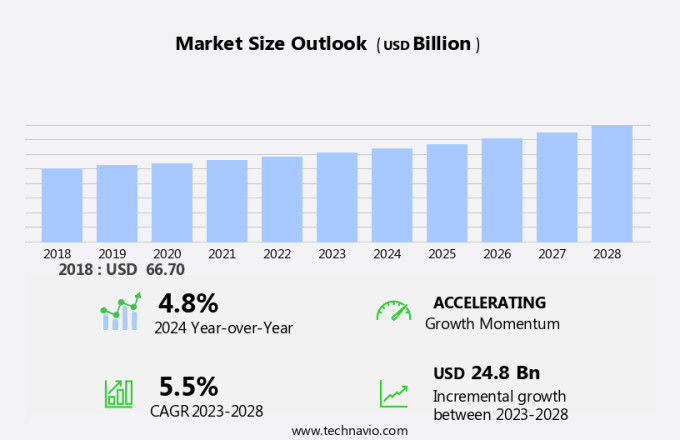
The sugar confectionery market size is forecast to increase by USD 24.8 billion, at a CAGR of 5.5% between 2023 and 2028.
- The market is witnessing significant growth, driven by the increasing number of product launches in the market. Innovative offerings, including sugar-free and organic options, are attracting a broad consumer base. However, the market faces challenges due to the rising prominence of online retailing. Consumers' shifting preferences towards e-commerce platforms are disrupting traditional sales channels, necessitating strategic adaptations. Moreover, the negative effects of sugar on health remain a persistent concern, potentially limiting market growth.
- Companies must navigate these challenges by investing in digital marketing and omnichannel strategies, while also focusing on healthier alternatives to cater to evolving consumer demands. This dynamic market presents opportunities for players to capitalize on emerging trends and consumer preferences, requiring agile and strategic business approaches.
What will be the Size of the Sugar Confectionery Market during the forecast period?
Explore in-depth regional segment analysis with market size data - historical 2018-2022 and forecasts 2024-2028 - in the full report.
Request Free Sample
The market continues to evolve, with dynamic market activities shaping its landscape. Starch syrup, a crucial ingredient, plays a significant role in maintaining the desired texture and moisture content in various confectionery products. Advanced techniques in sugar crystallization control ensure the production of high-quality gummy textures, while confectionery texture analysis provides valuable insights into product development. Chocolate mass rheology is another critical area of focus, with continuous processing systems enabling efficient production and ensuring consistent product quality. Microbial contamination control is essential to maintain food safety regulations and preserve the sensory attributes of confectionery products. Caramel production methods have evolved, with continuous processing systems and advanced techniques allowing for improved flavor development and color stability.
The ongoing quest for automation in confectionery production continues, with innovations in chocolate tempering processes, pectin gelation behavior, and hard candy formulation. Sweetener blend design and ingredient sourcing are essential aspects of confectionery manufacturing, with ongoing research into alternative sweeteners and sustainable sourcing practices. Consumer preference testing and candy viscosity measurement are integral to product development, ensuring the production of confectionery items that cater to evolving consumer demands. Continuous advancements in gummi manufacturing equipment and crystallization kinetics are driving innovation in the market. The integration of flavor encapsulation technology and sensory evaluation methods further enhances the development of new and exciting confectionery products.
How is this Sugar Confectionery Industry segmented?
The sugar confectionery industry research report provides comprehensive data (region-wise segment analysis), with forecasts and estimates in "USD billion" for the period 2024-2028, as well as historical data from 2018-2022 for the following segments.
- Product Type
- Hard boiled sweets
- Caramel and toffees
- Gums and jellies
- Medicated confectionery
- Others
- Distribution Channel
- Offline
- Online
- Consumer Segment
- Children
- Adults
- Gifting
- Type
- Sugar-Based
- Sugar-Free
- Geography
- North America
- US
- Mexico
- Europe
- France
- Germany
- Italy
- UK
- Middle East and Africa
- South Africa
- UAE
- APAC
- China
- India
- Japan
- South America
- Brazil
- Rest of World (ROW)
- North America
By Product Type Insights
The hard boiled sweets segment is estimated to witness significant growth during the forecast period.
The market showcases a vast array of products, catering to diverse consumer tastes. Hard boiled sweets, a popular segment, account for a substantial market share due to their extended shelf life and broad appeal. Manufacturing these sweets involves heating sugar and other components to a high temperature, resulting in a hard, glass-like texture. Moisture content determination is crucial in ensuring product consistency, while quality control procedures are essential to maintain the desired taste and texture. Sugar inversion control is vital in preventing the sugar from crystallizing during production, which can affect the candy's texture and appearance. Confectionery packaging design plays a significant role in preserving the product's quality and freshness.
Color stability testing is necessary to ensure the vibrancy of the sweets' colors remains intact during manufacturing and storage. Sugar coating techniques are used to add an extra layer of sweetness and protection to the candy. Batch processing techniques are employed to ensure uniformity and efficiency in the production process. Sugarcane processing efficiency is crucial to minimize waste and maintain cost-effectiveness. Starch syrup properties are essential in providing the necessary texture and binding agents for the candy. Sugar crystallization control is vital in producing the desired texture and sweetness. Gummy texture optimization is essential to cater to the growing demand for gummy candies.
Confectionery texture analysis is used to evaluate the product's quality and consistency. Chocolate mass rheology is a critical factor in producing chocolate confections, ensuring the right viscosity and flow properties. Microbial contamination control is necessary to maintain product safety and prevent spoilage. Caramel production methods require careful temperature control to prevent crystallization and ensure a smooth, creamy texture. Continuous processing systems are increasingly being adopted to improve efficiency and reduce waste. Food safety regulations are stringently enforced to ensure the production of safe and high-quality confectionery products. Sensory evaluation methods are used to assess consumer preferences and guide product development.
Sweetener blend design is crucial in creating products that cater to various dietary requirements and consumer preferences. Confectionery ingredient sourcing is essential to maintain product quality and consistency. Automation in confectionery is becoming increasingly common to improve efficiency and reduce labor costs. Chocolate tempering processes are used to ensure the chocolate's gloss and snap. Confectionery waste reduction is a growing concern, with manufacturers focusing on minimizing waste and improving efficiency. Pectin gelation behavior is essential in producing gels and jellies. Hard candy formulation requires careful consideration of sugar content, flavors, and colors to create a product that appeals to consumers.
Flavor encapsulation technology is used to enhance the taste and aroma of the sweets. Consumer preference testing is essential to guide product development and marketing strategies. Candy viscosity measurement is crucial in ensuring the right consistency for various confectionery products. Gummi manufacturing equipment is designed to produce gummy candies with the desired texture and appearance. Crystallization kinetics plays a crucial role in understanding the candy-making process and optimizing production methods.
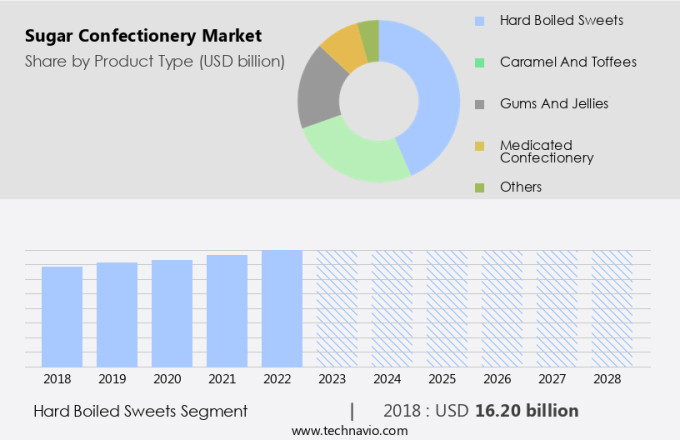
The Hard boiled sweets segment was valued at USD 16.20 billion in 2018 and showed a gradual increase during the forecast period.
Regional Analysis
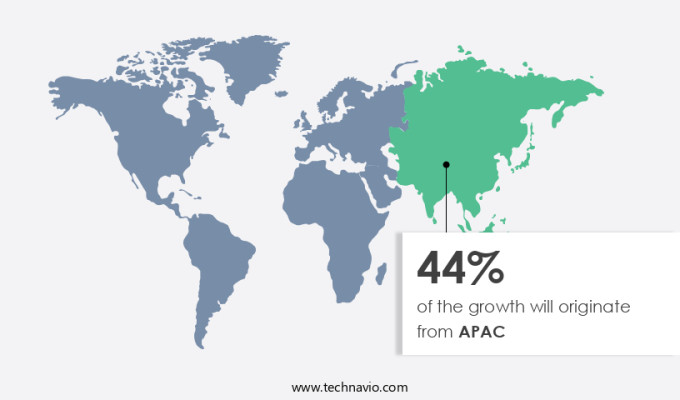
APAC is estimated to contribute 44% to the growth of the global market during the forecast period.Technavio's analysts have elaborately explained the regional trends and drivers that shape the market during the forecast period.
The market in the Asia Pacific (APAC) region is experiencing robust growth, fueled by increasing consumer preferences for diverse and innovative sweets. Moisture content determination and quality control procedures are essential in ensuring product consistency and customer satisfaction. Sugar inversion control and color stability testing are crucial for maintaining the desired texture and appearance of confectionery products. Sugar coating techniques and batch processing methods enhance the taste and appeal of confectionery items. Sugarcane processing efficiency and starch syrup properties significantly influence product quality and production costs. Sugar crystallization control and gummy texture optimization are critical for producing high-quality gummy candies.
Confectionery texture analysis, chocolate mass rheology, and microbial contamination control are essential for maintaining product safety and consumer trust. Caramel production methods and continuous processing systems streamline production and improve efficiency. Food safety regulations and sensory evaluation methods guide product development and innovation. Sweetener blend design and confectionery ingredient sourcing are vital for creating unique flavors and textures. Automation in confectionery and chocolate tempering processes increase productivity and reduce waste. Pectin gelation behavior and hard candy formulation require precise control for optimal product consistency. Flavor encapsulation technology and consumer preference testing are essential for developing new and appealing product offerings.
Candy viscosity measurement and gummi manufacturing equipment optimize production processes and improve product quality. Crystallization kinetics and pectin gelation behavior are critical for understanding the underlying processes in confectionery manufacturing.
Market Dynamics
Our researchers analyzed the data with 2023 as the base year, along with the key drivers, trends, and challenges. A holistic analysis of drivers will help companies refine their marketing strategies to gain a competitive advantage.
What are the key market drivers leading to the rise in the adoption of Sugar Confectionery Industry?
- The market's growth is primarily fueled by an escalating number of product launches.
- The market is witnessing notable growth due to the constant introduction of innovative products that cater to consumers' evolving preferences. Companies are focusing on new product launches to capture consumer attention and expand market reach. For instance, in May 2024, Perfetti Van Melle unveiled Chupa Chups Melody Pops, a lollipop that functions as a whistle, playing different notes. This product, introduced in the US market from November 2023, is available in three flavors: Strawberry, Blue Raspberry, and Watermelon. This trend signifies the convergence of confectionery and entertainment, increasing consumer engagement and boosting sales. Beyond taste, consumers are increasingly seeking products with superior quality.
- To meet these demands, companies are implementing rigorous quality control procedures, including moisture content determination, sugar inversion control, color stability testing, and sugar coating techniques. Additionally, batch processing techniques and sugarcane processing efficiency are crucial factors ensuring product consistency and meeting market expectations. Innovative packaging designs are also essential in the market, as they not only protect the product but also enhance its appeal. Companies are investing in research and development to create visually appealing and functional packaging that effectively communicates the product's unique selling points. Overall, the market is driven by the continuous quest for innovation, consumer preferences, and the need for high-quality products.
- Companies that can effectively address these trends and deliver on consumer expectations are poised for success.
What are the market trends shaping the Sugar Confectionery Industry?
- The increasing prevalence of online retailing represents a significant market trend. This shift towards e-commerce is mandatory for businesses seeking to remain competitive in today's digital economy.
- The market is witnessing a notable transition towards e-commerce sales, fueled by evolving consumer habits and advancements in online retailing technology. In the fiscal year 2023, major Fast-Moving Consumer Goods (FMCG) companies reported substantial double-digit growth in their e-commerce sales, underscoring the escalating significance of online retailing. This trend has gained momentum in the post-pandemic era, with some leading companies, such as Nestle SA, attributing up to 9-10% of their total sales to online channels. The convenience and accessibility offered by e-commerce platforms enable consumers to purchase their preferred sugar confectionery products from anywhere, at any time.
- Manufacturers are focusing on optimizing product textures, including gummy and chocolate mass rheology, to cater to consumers' evolving preferences. Starch syrup properties play a crucial role in sugar crystallization control during production, ensuring the desired texture and taste. Additionally, confectionery texture analysis is essential to maintain product consistency and quality. Microbial contamination control is another critical aspect of sugar confectionery production, requiring stringent adherence to hygiene standards and implementation of advanced processing technologies. Caramel production methods have evolved to include continuous processing systems, enhancing efficiency and reducing production costs. Overall, the market is characterized by continuous innovation, driven by consumer demand for high-quality, convenient, and healthier options.
What challenges does the Sugar Confectionery Industry face during its growth?
- The negative impacts of sugar on health pose a significant challenge to the growth of the industry. This concern, rooted in the potential health risks associated with sugar consumption, necessitates ongoing research and innovation to develop healthier alternatives or reduce the overall reliance on sugar in various products.
- The market confronts substantial challenges due to increasing health consciousness and stringent food safety regulations. Consumers are increasingly aware of the potential health risks linked to high sugar intake, which is influencing their purchasing decisions and putting pressure on industry players to adapt. Sweeteners, a significant component of confectionery products, are under scrutiny due to their association with various health issues. Free sugars, which are added during food processing or naturally occurring in certain foods, are particularly concerning. These sugars have been linked to a range of health problems, including diabetes, obesity, heart disease, and tooth decay.
- To address these concerns, confectionery manufacturers are focusing on sweetener blend design and ingredient sourcing to reduce added sugars and improve overall health profiles. Sensory evaluation methods are also being employed to ensure that reduced-sugar confectionery products maintain desirable taste and texture. Automation in confectionery production is another trend gaining traction to increase efficiency and ensure consistent product quality. Chocolate tempering, a critical process in chocolate production, is being automated to ensure proper crystallization and prevent the formation of unsightly bloom. Moreover, efforts are being made to reduce confectionery waste and optimize production processes.
- Pectin gelation behavior is being studied to improve the stability and texture of gel-based confectionery products, reducing the amount of raw materials required and minimizing waste.
Exclusive Customer Landscape
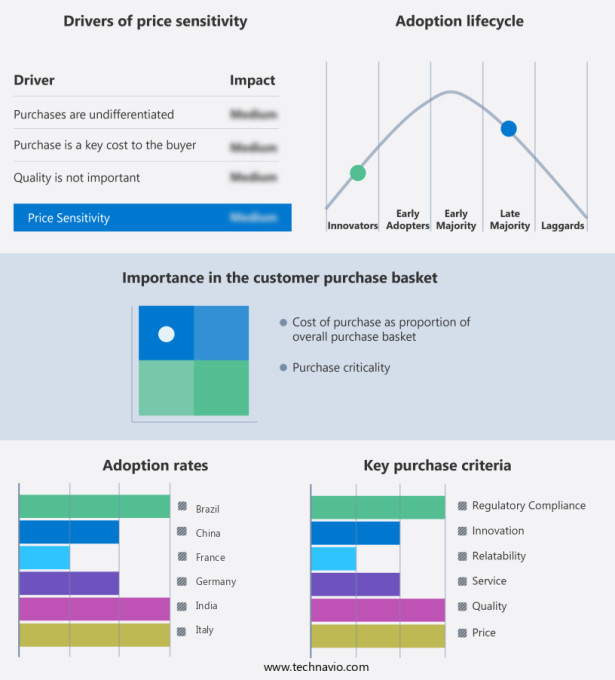
The sugar confectionery market forecasting report includes the adoption lifecycle of the market, covering from the innovator's stage to the laggard's stage. It focuses on adoption rates in different regions based on penetration. Furthermore, the sugar confectionery market report also includes key purchase criteria and drivers of price sensitivity to help companies evaluate and develop their market growth analysis strategies.
Customer Landscape
Key Companies & Market Insights
Companies are implementing various strategies, such as strategic alliances, sugar confectionery market forecast, partnerships, mergers and acquisitions, geographical expansion, and product/service launches, to enhance their presence in the industry.
Amar Bio-Organics India Pvt. Ltd. - This company specializes in producing a range of sugar confectionery, including hard-boiled candies, catering to diverse taste preferences with various flavors. Their product offerings reflect an commitment to quality and innovation in the sweet treats industry.
The industry research and growth report includes detailed analyses of the competitive landscape of the market and information about key companies, including:
- Amar Bio-Organics India Pvt. Ltd.
- Bah Humbugs
- Barry Callebaut AG
- Dhiman Foods Pvt. Ltd
- Ferrara Candy Co
- Gumlink Confectionery Company AS
- HARIBO GmbH and Co. KG
- Mars Inc.
- Melbas Australia Pty Ltd
- Mondelez International Inc.
- Nestle SA
- Perfetti Van Melle Group BV
- Prayagh Consumer Care P. Ltd.
- Saltire Candy Ltd.
- SHR TRADECORP Pvt Ltd
- Somods Bolcher
- Suncrest Food Makers
- Swan Sweets Pvt Ltd.
- The Beechworth Sweet Co.
- The Hershey Co.
Qualitative and quantitative analysis of companies has been conducted to help clients understand the wider business environment as well as the strengths and weaknesses of key industry players. Data is qualitatively analyzed to categorize companies as pure play, category-focused, industry-focused, and diversified; it is quantitatively analyzed to categorize companies as dominant, leading, strong, tentative, and weak.
Recent Development and News in Sugar Confectionery Market
- In January 2024, Mondelez International, a leading confectionery company, announced the launch of a new line of sugar-free gummi candies under its popular brand, Sour Patch Kids. The new product line, named "Sour Patch Kids Zero Sugar," aims to cater to the growing demand for sugar-free confectionery items (Mondelez International Press Release, 2024).
- In March 2024, Ferrero Group, the Italian confectionery giant, signed a strategic partnership with Nestlé to expand its presence in the European chocolate market. The collaboration involves Ferrero acquiring Nestlé's European chocolate business, including the iconic brands "Butterfinger" and "Crisp," for â¬6.8 billion (Bloomberg, 2024).
- In May 2024, Wrigley, a subsidiary of Mars, Inc., unveiled its latest innovation, "Extra Gum with Xylitol," at the National Confectioners Association's Sweets & Snacks Expo. This new product line, featuring a sugar alcohol called xylitol, is positioned to attract health-conscious consumers (Wrigley Press Release, 2024).
- In April 2025, the European Commission approved the acquisition of the British confectionery company, Swizzels Matlow, by the American multinational corporation, Hershey Company. The deal, worth approximately £150 million, is expected to strengthen Hershey's presence in the European the market (European Commission Press Release, 2025).
Research Analyst Overview
- In the dynamic the market, new product development and innovation strategies are key drivers for growth. Chocolate molding techniques continue to evolve, with a focus on improving product quality attributes through the selection of high-quality ingredients. Supply chain management plays a crucial role in ensuring the timely delivery of ingredients and candy making machinery. Quality assurance protocols are essential to maintain consumer trust, with an increasing emphasis on product safety standards. Sugar alcohol properties offer opportunities for energy efficiency improvements and cost reduction strategies. Sales strategies and marketing campaigns are tailored to various market segments, with customer loyalty programs and ingredient traceability systems enhancing brand reputation.
- Confectionery product development is guided by process optimization strategies and process automation benefits, while invertase enzyme activity is explored for enhancing candy recipes. Waste stream management and pricing strategies are critical components of sustainable business practices. Distribution channels are continually evolving, with a shift towards e-commerce and direct-to-consumer sales. Overall, the market is characterized by a focus on product innovation, process efficiency, and consumer satisfaction.
Dive into Technavio's robust research methodology, blending expert interviews, extensive data synthesis, and validated models for unparalleled Sugar Confectionery Market insights. See full methodology.
|
Market Scope |
|
|
Report Coverage |
Details |
|
Page number |
210 |
|
Base year |
2023 |
|
Historic period |
2018-2022 |
|
Forecast period |
2024-2028 |
|
Growth momentum & CAGR |
Accelerate at a CAGR of 5.5% |
|
Market growth 2024-2028 |
USD 24.8 billion |
|
Market structure |
Fragmented |
|
YoY growth 2023-2024(%) |
4.8 |
|
Key countries |
US, China, Japan, Germany, Mexico, India, UK, France, Brazil, and Italy |
|
Competitive landscape |
Leading Companies, Market Positioning of Companies, Competitive Strategies, and Industry Risks |
What are the Key Data Covered in this Sugar Confectionery Market Research and Growth Report?
- CAGR of the Sugar Confectionery industry during the forecast period
- Detailed information on factors that will drive the growth and forecasting between 2024 and 2028
- Precise estimation of the size of the market and its contribution of the industry in focus to the parent market
- Accurate predictions about upcoming growth and trends and changes in consumer behaviour
- Growth of the market across APAC, North America, Europe, Middle East and Africa, and South America
- Thorough analysis of the market's competitive landscape and detailed information about companies
- Comprehensive analysis of factors that will challenge the sugar confectionery market growth of industry companies
We can help! Our analysts can customize this sugar confectionery market research report to meet your requirements.


