
UK Superfood Powders Market Size 2025-2029
The UK superfood powders market size is forecast to increase by USD 3.8 billion at a CAGR of 9.7% between 2024 and 2029.
- The Superfood Powders Market is experiencing significant growth driven by the increasing health consciousness and demand for convenient, nutrient-dense food solutions among consumers. Superfood powders, derived from various fruits, vegetables, and other natural sources, offer numerous health benefits, including increased energy levels, improved immune function, and enhanced antioxidant intake. This trend is particularly prominent in the US market, where consumers are increasingly seeking out functional foods and beverages to support their active lifestyles. However, market growth is not without challenges. The volatile prices of raw superfoods, such as acai berries, goji berries, and chia seeds, can impact the profitability of superfood powder manufacturers. From the traditional acai and goji berries to the more recent additions like maqui berry and camu camu, the market is witnessing a rise in new product launches.
- Additionally, the market is becoming increasingly competitive, with a growing number of players entering the space. To capitalize on market opportunities and navigate these challenges effectively, companies must focus on innovation, sustainability, and cost management. By offering new and unique superfood blends, investing in sustainable sourcing and production practices, and implementing cost-effective manufacturing processes, companies can differentiate themselves in the market and meet the evolving needs of health-conscious consumers. Lastly, the volatile pricing of raw superfoods is posing a significant challenge.
What will be the size of the UK Superfood Powders Market during the forecast period?

- The superfood powders market is experiencing significant growth as consumers prioritize healthy lifestyle choices. These nutrient-dense, plant-based powders offer immunity-boosting, detoxifying, and stress-reducing benefits, making them popular options for individuals seeking to incorporate more vitamins, minerals, and antioxidants into their diets. Blueberries, goji berries, and other superfoods have gained popularity for their nutrient-rich properties, leading to the development of various superfood powders derived from these sources. Millennials, in particular, are driving market demand due to their preference for convenient, plant-based nutrient-rich options. These nutrient-dense superfoods, such as Moringa, Chia seeds, Pumpkin seeds, Sunflower seeds, and others, offer numerous health benefits, including immunity boost, detoxification, stress reduction, and inflammation control.
- Superfood powders are versatile, with applications ranging from adding them to drinks and recipes to using them as dietary supplements for weight loss, digestion, and overall health improvement. Plant-based superfood powders and vegan superfood powders are increasingly sought after as people adopt more plant-based diets. The market is expected to continue growing as consumers prioritize health and wellness. The antioxidant properties of blueberries and other superfoods help reduce inflammation and promote gut health.
How is this market segmented?
The market research report provides comprehensive data (region-wise segment analysis), with forecasts and estimates in "USD million" for the period 2025-2029, as well as historical data from 2019-2023 for the following segments.
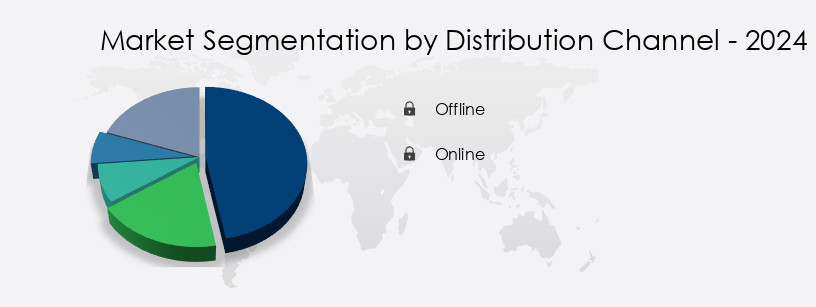
- Distribution Channel
- Offline
- Online
- Product
- Organic
- Conventional
- End-user
- Individual consumers
- Commercial users
- Application
- Food and beverages
- Cosmetics and personal care
- Geography
- UK
By Distribution Channel Insights
The offline segment is estimated to witness significant growth during the forecast period. These powders, often incorporated into smoothies, protein shakes, energy bars, and even baked goods, are favored by personal care makers and beauty brands for their organic sub-segment. Superfood powders have gained significant popularity in the healthy lifestyle market due to their nutrient-dense properties, offering immunity boost, detoxification, and stress reduction benefits. Brands and companies have capitalized on this trend, introducing a variety of superfood powders derived from Moringa, green smoothies, teas, salads, and natural foods. These functional foods provide essential vitamins, minerals, antioxidants, and beneficial substances, addressing diet-related diseases such as obesity and diabetes. Supermarkets and hypermarkets have emerged as the most preferred distribution channels for these products. The growth of the organized retail sector in developed countries has led to an increase in the number of retail outlets, providing consumers with a wide range of nutrient-rich options.
Get a glance at the market share of various segments Request Free Sample
The Offline segment was valued at USD 3.87 billion in 2019 and showed a gradual increase during the forecast period.
Market Dynamics
Our researchers analyzed the data with 2024 as the base year, along with the key drivers, trends, and challenges. A holistic analysis of drivers will help companies refine their marketing strategies to gain a competitive advantage.
What are the key market drivers leading to the rise in adoption of UK Superfood Powders Market?
- Health benefits of superfood powders is the key driver of the market. Superfood powders, derived from various nutrient-dense foods, offer numerous health benefits when incorporated into daily diets. Among these, acai berry powder stands out for its rich nutritional profile. Acai berries are highly nutritious superfruits, abundant in vitamins, minerals, fiber, and antioxidants. The antioxidant content in acai berry powder is particularly noteworthy, as it aids in preventing cell damage and disease development. Antioxidants present in this superfood powder also combat inflammation and oxidation in the brain, contributing to cognitive health. Acai berry powder's antioxidant properties have been linked to the prevention of diseases such as cancer, diabetes, and heart ailments.
- This superfood powder's potential health benefits make it an attractive addition to health-conscious consumers' diets. Convenience and affordability are major factors driving sales, with discounted prices and an enhanced shopping experience offered by these retailers. Millennials, in particular, are embracing superfood powders as part of their daily routine, with plant-based superfood powders, vegan superfood powders, adaptogenic superfood powders, and functional superfood powders gaining popularity for immune support and cognitive function.
What are the market trends shaping the UK Superfood Powders Market?
- Rise in demand for new varieties of superfoods powders is the upcoming trend in the market. Superfood powders, comprising of quinoa and chia seeds, have long been recognized for their nutritional benefits. However, the market landscape is evolving, with an increasing preference for alternative superfood powders such as turmeric, moringa, pulses, cacao, spirulina, baobab, acai, and maca powders. Turmeric, renowned for its anti-inflammatory properties, is gaining popularity in functional food and beverages that cater to individuals engaging in strenuous physical activities. Additionally, it is being incorporated into supplements designed for the aging population segment.
- Moringa powder, rich in vitamins, minerals, and phytochemicals, is another trending superfood powder. Its anti-aging properties make it an attractive ingredient for beauty food products. These trends reflect the dynamic nature of the superfood powders market, offering companies opportunities to cater to diverse consumer needs. Eco-friendly and socially responsible practices, such as organic farming, are also becoming increasingly important to consumers. Superfood powders can be incorporated into various food and beverage applications, including smoothies, protein shakes, energy bars, baked goods, personal care makers, and beauty brands. The market for superfood powders is expected to continue growing, driven by consumer demand for nutrient-dense dietary options and the increasing prevalence of chronic diseases.
What challenges does UK Superfood Powders Market face during the growth?
- Volatile price of superfoods is a key challenge affecting the market growth. The superfood powders market faces a significant challenge due to the volatile pricing of key ingredients. This price instability affects manufacturers' operations and market dynamics. The rising demand for superfoods, particularly acai berries, which are primarily sourced from the Amazon rainforest region in Brazil, outpaces the supply. As a result, raw material costs have escalated, compelling manufacturers to explore alternative, cost-effective options. These substitutes, however, may not meet consumers' expectations, potentially hindering the market's growth. Despite these challenges, the market continues to attract interest due to the perceived health benefits associated with superfood powders. Personal care makers and beauty brands are also incorporating these powders into their products.
- Moringa, chia seeds, pumpkin seeds, sunflower seeds, and other plant-based superfoods have gained prominence due to their high nutritional value. These foods are rich in vitamins, minerals, antioxidants, and other beneficial substances that contribute to overall health and wellbeing. The demand for organic superfood powders has also been on the rise, as consumers become increasingly conscious of the impact of conventional farming practices on their health and the environment. Organic farming practices, which exclude the use of chemicals, pesticides, and genetically modified organisms (GMOs), are becoming more prevalent in the production of superfood powders. The online distribution channel has played a significant role in the growth of the superfood powders market, as it offers convenience and accessibility to consumers.
How can Technavio assist you in making critical decisions?
Key Companies & Market Insights
Companies are implementing various strategies, such as strategic alliances, market forecast partnerships, mergers and acquisitions, geographical expansion, and product/service launches, to enhance their presence in the market.
Aduna:- The company offers different types of superfood powders such as hibiscus powder, baobab and moringa bundle, baobab powder, and others
The market research and growth report includes detailed analyses of the competitive landscape of the market and information about key companies, including:
- Barleans Organic Oils LLC
- Creative Nature Ltd.
- Dream Magic Superfood Powders
- Euro Taste GMBH
- Hion Ltd.
- Indigo Herbs Ltd.
- Marvellous Superfood
- Miracle Leaf Wellness Ltd.
- MySuperFoods Ltd.
- Natures Aid Ltd.
- Navi Organics Ltd.
- NutriSuperFoods
- Nutrisure Ltd.
- Nuzest Life Pty Ltd.
- PharmaCare Europe Ltd.
- Rheal Superfoods Ltd.
- Sunfood
- Unilever PLC
- Vegatox
Qualitative and quantitative analysis of companies has been conducted to help clients understand the wider business environment as well as the strengths and weaknesses of key market players. Data is qualitatively analyzed to categorize companies as pure play, category-focused, industry-focused, and diversified; it is quantitatively analyzed to categorize companies as dominant, leading, strong, tentative, and weak.
Research Analyst Overview
The superfood powders market has experienced significant growth in recent years, driven by the increasing consumer awareness and preference for nutrient-dense, natural foods. Superfoods, which are foods considered to be exceptionally rich in essential nutrients, have gained popularity due to their potential health benefits, including immunity boost, detoxification, stress reduction, and cognitive function enhancement. Brands and companies have capitalized on this trend by introducing various superfood powders, which offer convenience and versatility. These powders can be easily added to smoothies, teas, salads, and other natural foods, making it simple for consumers to incorporate these nutrient-rich options into their daily diets.
Millennials, in particular, have shown a strong preference for eco-friendly and socially responsible foods, and many brands and companies have responded by adopting sustainable and ethical practices. Functional superfood powders, which offer specific health benefits beyond basic nutrition, have also gained popularity. Adaptogenic superfood powders, for instance, help the body cope with stress, while immune support and cognitive function-enhancing superfood powders have gained traction among health-conscious consumers. The market for superfood powders is diverse and dynamic, with various sub-segments, including traditional superfoods, plant-based superfood powders, vegan superfood powders, and functional superfood powders. Brands and companies have responded to this diversity by offering a range of products catering to different consumer preferences and dietary needs.
Quality control, certifications, collaborations, and branding and marketing efforts have become essential components of the superfood powders market. Consumers are increasingly demanding transparency and authenticity, and brands and companies are responding by investing in quality control measures, obtaining certifications, and collaborating with influencers and experts to build trust and credibility. The health benefits of superfood powders extend beyond personal health, as they can also contribute to the prevention and management of diet-related diseases, such as obesity and diabetes. The market for functional foods, which include superfood powders, is expected to continue growing as consumers seek natural and nutrient-dense alternatives to processed and inflammation-producing foods.
The superfood powders market is a dynamic and growing industry, driven by consumer preferences for natural, nutrient-dense, and convenient foods. Brands and companies are responding to this trend by offering a range of organic, plant-based, and functional superfood powders, while adopting eco-friendly and ethical practices to meet the evolving demands of health-conscious consumers.
|
Market Scope |
|
|
Report Coverage |
Details |
|
Page number |
175 |
|
Base year |
2024 |
|
Historic period |
2019-2023 |
|
Forecast period |
2025-2029 |
|
Growth momentum & CAGR |
Accelerate at a CAGR of 9.7% |
|
Market growth 2025-2029 |
USD 3.80 billion |
|
Market structure |
Fragmented |
|
YoY growth 2024-2025(%) |
7.7 |
|
Competitive landscape |
Leading Companies, Market Positioning of Companies, Competitive Strategies, and Industry Risks |
What are the Key Data Covered in this Market Research Report?
- CAGR of the market during the forecast period
- Detailed information on factors that will drive the market growth and forecasting between 2025 and 2029
- Precise estimation of the size of the market and its contribution of the market in focus to the parent market
- Accurate predictions about upcoming market growth and trends and changes in consumer behaviour
- Growth of the market across UK
- Thorough analysis of the market's competitive landscape and detailed information about companies
- Comprehensive analysis of factors that will challenge the growth of market companies
We can help! Our analysts can customize this market research report to meet your requirements Get in touch