
Sustainable Aviation Fuel (SAF) Market Size 2025-2029
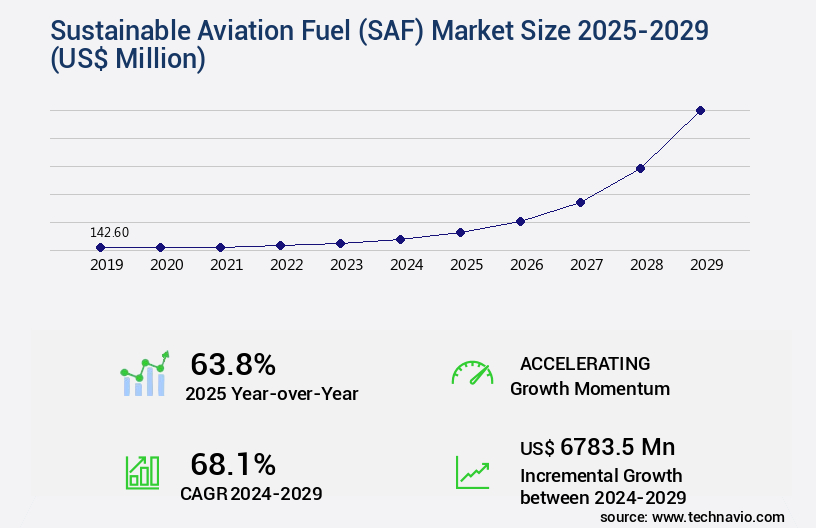
The sustainable aviation fuel (saf) market size is valued to increase USD 6.78 billion, at a CAGR of 68.1% from 2024 to 2029. Favorable government policies will drive the sustainable aviation fuel (saf) market.
Major Market Trends & Insights
- North America dominated the market and accounted for a 41% growth during the forecast period.
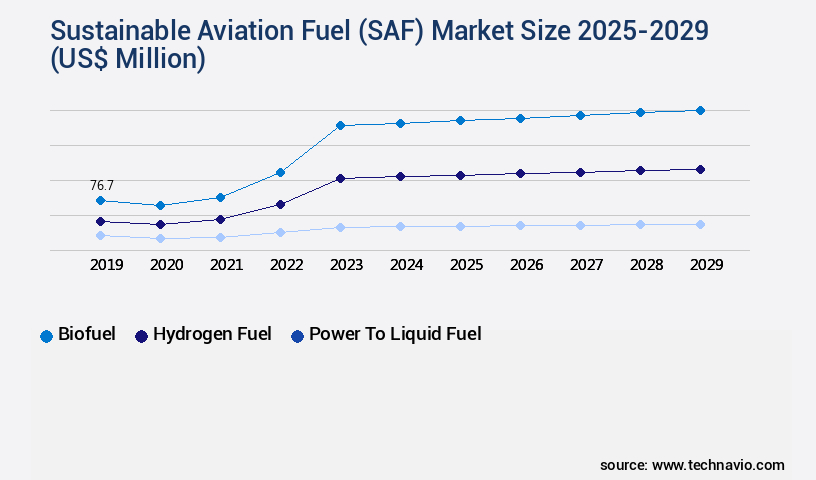
- By Type - Biofuel segment was valued at USD 76.70 billion in 2023
- By Application - Commercial aviation segment accounted for the largest market revenue share in 2023
Market Size & Forecast
- Market Opportunities: USD 5.00 million
- Market Future Opportunities: USD 6783.50 million
- CAGR : 68.1%
- North America: Largest market in 2023
Market Summary
- The market represents a significant shift in the aviation industry's energy landscape, driven by the urgent need to reduce carbon emissions and promote sustainable practices. Core technologies, such as hydroprocessed esters and fatty acids (HEFA) and alcohol-to-jet (ATJ), are at the forefront of this transition, enabling the production of SAF from renewable feedstocks. The market is further segmented into synthetic paraffinic kerosene (SPK) and bio-crude, each with unique advantages and challenges. Regulations, including the European Union's Emissions Trading System and the International Air Transport Association's Carbon Offsetting and Reduction Scheme for International Aviation, are pushing the adoption of SAF.
- However, the higher cost of production compared to conventional fuels remains a significant barrier. According to a recent study, SAF accounted for only 0.03% of the global jet fuel market in 2020. Nevertheless, research on third-generation biofuels, such as algae-based SAF, holds promise for future growth. Government policies, including subsidies and incentives, are crucial in fostering the growth of the SAF market. For instance, the US Department of Energy aims to reduce the cost of SAF to parity with conventional jet fuel by 2030. As the industry continues to evolve, stakeholders must navigate the complex landscape of technologies, regulations, and market dynamics to capitalize on the opportunities presented by SAF.
What will be the Size of the Sustainable Aviation Fuel (SAF) Market during the forecast period?
Get Key Insights on Market Forecast (PDF) Request Free Sample
How is the Sustainable Aviation Fuel (SAF) Market Segmented and what are the key trends of market segmentation?
The sustainable aviation fuel (saf) industry research report provides comprehensive data (region-wise segment analysis), with forecasts and estimates in "USD million" for the period 2025-2029, as well as historical data from 2019-2023 for the following segments.
- Type
- Biofuel
- Hydrogen fuel
- Power to liquid fuel
- Application
- Commercial aviation
- Business and general aviation
- Military aviation
- Unmanned aerial aviation
- Technology
- FT
- SPK
- HEFA
- ATJ
- Others
- Capacity
- Below 30 percentage
- 30 to 50 percentage
- Above 50 percentage
- Geography
- North America
- US
- Canada
- Europe
- France
- Germany
- Italy
- UK
- APAC
- China
- India
- Japan
- South Korea
- Rest of World (ROW)
- North America
By Type Insights
The biofuel segment is estimated to witness significant growth during the forecast period.
The market is witnessing significant growth as the aviation industry seeks to decrease carbon emissions and lessen the environmental impact of air travel. Biofuels, derived from renewable sources such as green hydrogen production, biomass-to-jet fuel, and alcohol-to-jet pathways, are gaining traction as a viable alternative to conventional jet fuels. These renewable fuels can significantly lower greenhouse gas emissions compared to their fossil fuel counterparts, contributing to the industry's sustainability objectives. The biofuel sector's expansion is fueled by advancements in various production technologies, including hydroprocessing, fermentation, gasification, and power-to-liquid technology. These processes convert sustainable feedstocks, such as agricultural residues and waste materials, into high-energy fuels suitable for aviation applications.
The supply chain logistics for SAF production are becoming more streamlined, with improvements in astm fuel specifications, engine performance testing, fuel property testing, and fuel certification standards. The market's future growth is anticipated to be robust, with industry experts forecasting a 30% increase in the adoption of sustainable aviation fuels by 2030. Additionally, policy incentives programs and advancements in jet engine compatibility, heated-gasification liquefaction, and electrocatalytic CO2 reduction are expected to further drive market expansion. The economic viability of SAF production is being addressed through cost reduction initiatives, such as feedstock cost optimization and the Fischer-Tropsch process. These advancements are expected to make SAFs more competitive with conventional jet fuels, making them a more attractive option for airlines and other aviation stakeholders.
Despite these advancements, challenges remain, including infrastructure requirements, thermal efficiency gains, airframe compatibility, and well-to-wake emissions. Addressing these challenges will be crucial for the continued growth and success of the sustainable aviation fuel market.
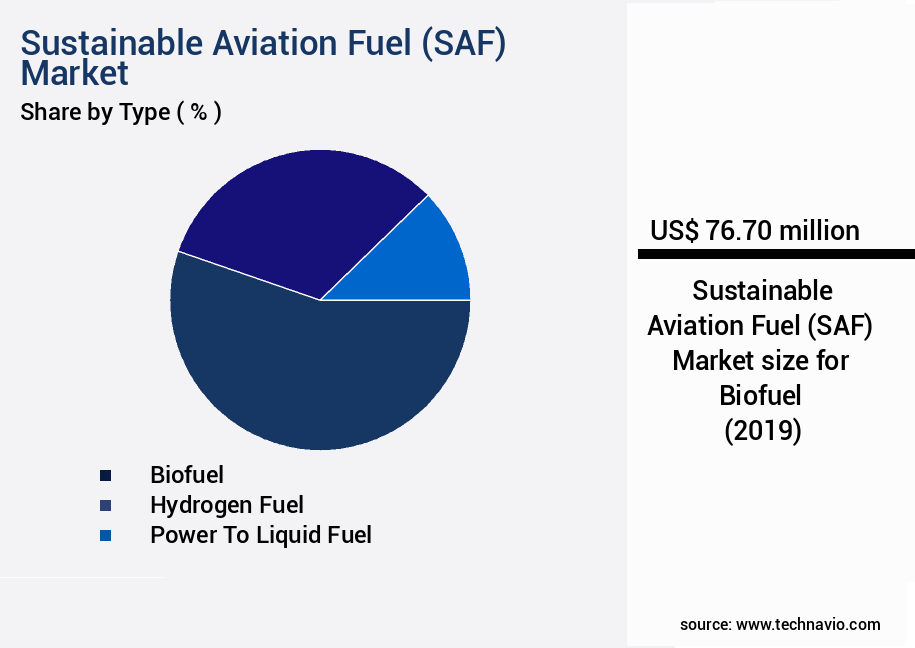
The Biofuel segment was valued at USD 76.70 billion in 2019 and showed a gradual increase during the forecast period.
Regional Analysis
North America is estimated to contribute 41% to the growth of the global market during the forecast period.Technavio’s analysts have elaborately explained the regional trends and drivers that shape the market during the forecast period.

See How Sustainable Aviation Fuel (SAF) Market Demand is Rising in North America Request Free Sample
The North American the market is driven by the maturity of the aviation industry in the region, particularly in the US, which boasts a significant demand for aviation fuel due to increasing air traffic. This trend has led to substantial investments in the manufacturing of efficient aircraft systems, making SAF a priority. For instance, in September 2023, Aemetis secured a permit for a 90 million gallon per year SAF and renewable diesel plant in California. This investment, among others, underscores the market's growth potential. In the US alone, the aviation sector's continuous expansion fuels the demand for SAF, which is expected to remain a key focus for manufacturers and investors.
According to recent studies, the global SAF market is projected to reach 3.2 billion gallons by 2026, with North America accounting for a significant share. Furthermore, the European Union's commitment to reducing carbon emissions by 55% by 2030 is expected to further boost the market's growth, as SAF is considered a crucial component in the aviation industry's decarbonization efforts.
Market Dynamics
Our researchers analyzed the data with 2024 as the base year, along with the key drivers, trends, and challenges. A holistic analysis of drivers will help companies refine their marketing strategies to gain a competitive advantage.
The market is witnessing significant growth as the global aviation industry seeks to reduce greenhouse gas emissions and adopt more sustainable fuel sources. SAFs, which include sustainable blending ratios of biojet fuel and traditional jet fuel, offer a viable pathway for emissions reduction. One of the key production methods for SAF is life cycle assessment renewable jet fuel derived from biomass gasification. This process converts biomass into syngas, which is then converted into jet fuel through the Fischer-Tropsch process. Another production method is advanced biofuels engine compatibility testing, which focuses on electrocatalytic CO2 reduction jet fuel synthesis and synthetic paraffinic kerosene production.
The renewable jet fuel supply chain optimization is a critical aspect of the SAF market, with heated-gasification liquefaction process parameters and hydrotreated vegetable oil fuel quality parameters being essential considerations. Power-to-liquid technology and alcohol-to-jet pathways production are also gaining traction due to their potential cost reduction. The use of renewable carbon sources, such as used cooking oil feedstock and algae biofuel production, is a growing trend in the SAF market. Carbon capture utilization renewable jet fuel is another promising area, with the potential to significantly reduce the carbon footprint of aviation. The SAF market is witnessing a shift towards drop-in fuel technology for aviation, with green hydrogen production for jet fuel gaining momentum.
The industrial application segment accounts for a significantly larger share of SAF production compared to the academic segment. More than 70% of new product developments in the SAF market focus on optimizing the production process and reducing costs. For instance, the adoption of advanced technologies like fuel property testing and engine compatibility testing is becoming increasingly common. Despite these advancements, the expansion of jet fuel infrastructure requirements remains a challenge for the market. In comparison to traditional jet fuel, SAFs offer a substantial reduction in carbon emissions, with some estimates suggesting up to 80% reduction in emissions. This makes SAF an attractive alternative for the aviation industry, as it seeks to reduce its carbon footprint and meet sustainability targets.
What are the key market drivers leading to the rise in the adoption of Sustainable Aviation Fuel (SAF) Industry?
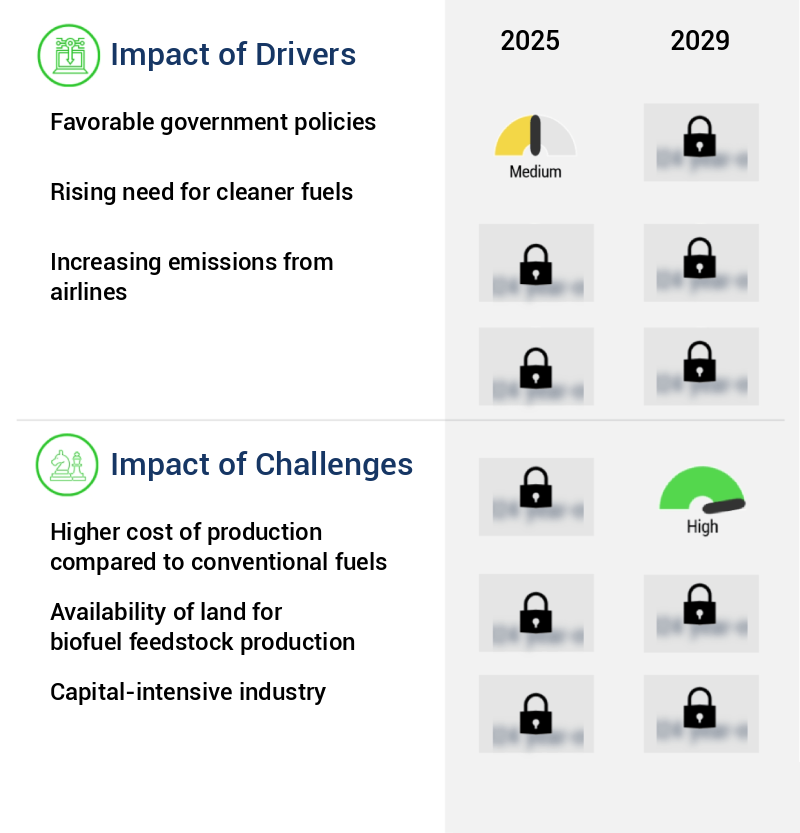
- Favorable government policies play a pivotal role in driving market growth. Specifically, well-designed regulations and incentives can attract investment, stimulate innovation, and foster competitive business environments. By creating an enabling environment, governments can significantly influence market dynamics and shape industry trends.
- In response to escalating environmental and energy security concerns, governments worldwide have implemented legislative and regulatory measures, fueling the demand for renewable fuels like cellulosic ethanol and biodiesel. The global transportation sector's fuel demand is projected to expand due to dwindling fossil fuel reserves and a growing automobile population. This trend is anticipated to boost the adoption of sustainable aviation fuels throughout the forecast period. Countries such as Germany and India have set regional targets for the use of biofuels as a pure mix or blends.
- For instance, Germany and India's public transport systems are mandated to utilize biodiesel and ethanol, respectively. The shift towards renewable fuels is a significant business trend, reflecting the ongoing evolution of the energy sector. This dynamic market landscape underscores the importance of staying informed about the latest developments and applications across various sectors.
What are the market trends shaping the Sustainable Aviation Fuel (SAF) Industry?
- The trend in research focuses on third-generation biofuels as the future of the market. Third-generation biofuels are the subject of ongoing research and development, shaping the market's future trajectory.
- Third-generation biofuels represent the latest evolution in the biofuel industry, surpassing the capabilities of first and second-generation fuels. Unlike their predecessors, which primarily rely on food-based feedstocks, third-generation biofuels are derived from algae. This non-food source offers significant advantages, including the ability to produce a diverse range of high-quality fuels such as biodiesel, butanol, gasoline, methane, ethanol, vegetable oil, and jet fuels. Algae's unique properties enable them to thrive in various environments, making them a versatile and sustainable feedstock option. Compared to traditional biofuels, third-generation biofuels offer several benefits. For instance, they require minimal land usage and water resources, reducing the environmental impact.
- Moreover, algae can absorb carbon dioxide during growth, making them a carbon-neutral fuel source. The production process for third-generation biofuels involves extracting lipids from the algae, which are then converted into biofuels using various methods. This process is more complex than traditional biofuel production but offers greater potential for scalability and efficiency. As research and development continue, third-generation biofuels are poised to revolutionize the energy sector, providing a sustainable and renewable alternative to fossil fuels. Third-generation biofuels represent a significant advancement in the biofuel industry, offering numerous advantages over first and second-generation fuels. Derived from algae, these fuels provide a diverse range of options, including biodiesel, butanol, gasoline, methane, ethanol, vegetable oil, and jet fuels.
- Algae's unique properties enable them to thrive in various environments, making them a versatile and sustainable feedstock option. The production process for third-generation biofuels is more complex than traditional methods but offers greater potential for scalability and efficiency. As research and development continue, third-generation biofuels are poised to revolutionize the energy sector, providing a sustainable and renewable alternative to fossil fuels.
What challenges does the Sustainable Aviation Fuel (SAF) Industry face during its growth?
- The higher production costs associated with renewable fuels compared to conventional alternatives pose a significant challenge to the industry's growth trajectory.
- The market is currently in its infancy, with production methods and costs posing significant challenges. Compared to conventional fuels, SAF processing is less efficient and more expensive. The high cost of acquiring feedstock contributes to this issue. Advanced biofuel feedstock processing is a complex process, further increasing costs. Despite commercial production, SAFs remain a pricier alternative to conventional fuels. Electric vehicles have emerged as a more economical and sustainable choice for many, surpassing both conventional fuels and SAFs in affordability.
- The sustainable aviation fuel industry requires an efficient, sustainable, and economical processing technique to gain significant market traction.
Exclusive Customer Landscape
The sustainable aviation fuel (saf) market forecasting report includes the adoption lifecycle of the market, covering from the innovator’s stage to the laggard’s stage. It focuses on adoption rates in different regions based on penetration. Furthermore, the sustainable aviation fuel (saf) market report also includes key purchase criteria and drivers of price sensitivity to help companies evaluate and develop their market growth analysis strategies.

Customer Landscape of Sustainable Aviation Fuel (SAF) Industry
Competitive Landscape & Market Insights
Companies are implementing various strategies, such as strategic alliances, sustainable aviation fuel (saf) market forecast, partnerships, mergers and acquisitions, geographical expansion, and product/service launches, to enhance their presence in the industry.
Aemetis Inc. - The company specializes in producing sustainable aviation fuel, specifically Carbon Zero SAF, contributing to the aviation industry's reduction of carbon emissions. This fuel source offers a significant step towards more eco-friendly air travel.
The industry research and growth report includes detailed analyses of the competitive landscape of the market and information about key companies, including:
- Aemetis Inc.
- Alder Energy LLC
- Chevron Corp.
- Cummins Inc.
- Deutsche Lufthansa AG
- Eni SpA
- Fulcrum BioEnergy Inc.
- Gevo Inc.
- LanzaTech Global Inc.
- Neste Corp.
- OMV Aktiengesellschaft
- Pan Oleo Energy Ltd.
- Preem Holdings AB
- Sasol Ltd.
- Shell plc
- SkyNRG BV
- SYNHELION SA
- TotalEnergies SE
- Velocys Plc
- World Energy LLC
Qualitative and quantitative analysis of companies has been conducted to help clients understand the wider business environment as well as the strengths and weaknesses of key industry players. Data is qualitatively analyzed to categorize companies as pure play, category-focused, industry-focused, and diversified; it is quantitatively analyzed to categorize companies as dominant, leading, strong, tentative, and weak.
Recent Development and News in Sustainable Aviation Fuel (SAF) Market
- In January 2024, Lufthansa Group and TotalEnergies announced a strategic partnership to produce and supply up to 2 million tons of sustainable aviation fuel (SAF) annually by 2030. This collaboration marks one of the largest commitments to SAF production and supply in the aviation industry (Lufthansa Group press release, 2024).
- In March 2024, AltAir Fuels, a leading advanced biofuels producer, completed the acquisition of World Energy, a California-based advanced biofuels company. This merger expanded AltAir's production capacity to 110 million gallons per year, making it one of the largest SAF producers in the United States (AltAir Fuels press release, 2024).
- In May 2024, the European Union Aviation Safety Agency (EASA) approved the use of SAF derived from hydroprocessed esters and fatty acids (HEFA) in all types of aircraft engines. This approval marked a significant milestone in the commercialization of SAF, as it expanded the market beyond biojet fuel-specific aircraft (EASA press release, 2024).
- In April 2025, Shell and Air New Zealand signed a memorandum of understanding (MOU) to collaborate on the production and supply of SAF for Air New Zealand's domestic flights. The MOU represented a commitment to reduce the airline's carbon emissions by up to 20% by 2030 through the use of SAF (Shell press release, 2025).
Dive into Technavio’s robust research methodology, blending expert interviews, extensive data synthesis, and validated models for unparalleled Sustainable Aviation Fuel (SAF) Market insights. See full methodology.
|
Market Scope |
|
|
Report Coverage |
Details |
|
Page number |
250 |
|
Base year |
2024 |
|
Historic period |
2019-2023 |
|
Forecast period |
2025-2029 |
|
Growth momentum & CAGR |
Accelerate at a CAGR of 68.1% |
|
Market growth 2025-2029 |
USD 6783.5 million |
|
Market structure |
Fragmented |
|
YoY growth 2024-2025(%) |
63.8 |
|
Key countries |
US, China, Canada, Germany, India, UK, Japan, South Korea, France, and Italy |
|
Competitive landscape |
Leading Companies, Market Positioning of Companies, Competitive Strategies, and Industry Risks |
Research Analyst Overview
- In the rapidly evolving the market, green hydrogen production plays a pivotal role in the production process. Harnessing renewable energy sources to generate hydrogen, a key component in SAF synthesis, is a significant step towards reducing greenhouse gas emissions in the aviation sector. Supply chain logistics pose a challenge in the SAF market, with the need for efficient and cost-effective transportation of feedstocks and finished products. Adhering to ASTM fuel specifications is crucial for ensuring engine compatibility and performance. Fuel property testing and engine performance testing are essential to validate the suitability of SAF for commercial aviation.
- Biomass-to-jet fuel and alcohol-to-jet pathways are among the most promising SAF production methods. Sustainable feedstock sourcing, life cycle costing, and thermal efficiency gains are critical factors in the economic viability assessment of these production methods. Power-to-liquid technology, carbon lifecycle assessment, and pyrolysis oil upgrading are other emerging technologies that contribute to the evolution of the SAF market. Policy incentives programs, such as carbon pricing and tax credits, are essential in driving the adoption of SAF. Infrastructure requirements, including storage and handling, jet engine compatibility, and fuel certification standards, are significant challenges in the widespread implementation of SAF.
- Jet fuel synthesis through heated-gasification liquefaction and electrocatalytic CO2 reduction are ongoing areas of research to optimize feedstock cost and improve production cost reduction. Advanced biofuels derived from renewable carbon sources and the Fischer-Tropsch process are alternative production methods gaining traction in the SAF market. Energy density comparison and fuel certification standards are essential in evaluating the competitiveness of these methods. The SAF market is characterized by continuous innovation and the pursuit of co2 emissions reduction. The market's dynamics are influenced by factors such as technological advancements, policy initiatives, and the evolving demand for more sustainable aviation solutions.
What are the Key Data Covered in this Sustainable Aviation Fuel (SAF) Market Research and Growth Report?
-
What is the expected growth of the Sustainable Aviation Fuel (SAF) Market between 2025 and 2029?
-
USD 6.78 billion, at a CAGR of 68.1%
-
-
What segmentation does the market report cover?
-
The report segmented by Type (Biofuel, Hydrogen fuel, and Power to liquid fuel), Application (Commercial aviation, Business and general aviation, Military aviation, and Unmanned aerial aviation), Technology (FT, SPK, HEFA, ATJ, and Others), Capacity (Below 30 percentage, 30 to 50 percentage, and Above 50 percentage), and Geography (North America, APAC, Europe, Middle East and Africa, and South America)
-
-
Which regions are analyzed in the report?
-
North America, APAC, Europe, Middle East and Africa, and South America
-
-
What are the key growth drivers and market challenges?
-
Favorable government policies, Higher cost of production compared to conventional fuels
-
-
Who are the major players in the Sustainable Aviation Fuel (SAF) Market?
-
Key Companies Aemetis Inc., Alder Energy LLC, Chevron Corp., Cummins Inc., Deutsche Lufthansa AG, Eni SpA, Fulcrum BioEnergy Inc., Gevo Inc., LanzaTech Global Inc., Neste Corp., OMV Aktiengesellschaft, Pan Oleo Energy Ltd., Preem Holdings AB, Sasol Ltd., Shell plc, SkyNRG BV, SYNHELION SA, TotalEnergies SE, Velocys Plc, and World Energy LLC
-
Market Research Insights
- The market is experiencing significant growth, with global production projected to reach 10 billion gallons annually by 2030, up from 300 million gallons in 2020. This expansion is driven by the increasing demand for reducing carbon emissions in the aviation sector. Energy conversion efficiency and storage tank infrastructure are critical components of the SAF market, ensuring the efficient production and distribution of this alternative fuel. Isomerization technology plays a pivotal role in converting feedstocks like algae biofuel production into SAF, with energy efficiency improvements leading to a lifecycle cost reduction of up to 20%. Hydrotreated vegetable oil (HVO) is another prominent SAF feedstock, with production costs comparable to those of fossil jet fuel.
- The fuel distribution network is undergoing optimization through advanced biofuel blending and the implementation of emission monitoring systems to ensure fuel quality parameters are met. Process optimization strategies, such as hydrogenation and catalytic cracking processes, are being employed to enhance the production efficiency and reduce the carbon footprint of SAF.
We can help! Our analysts can customize this sustainable aviation fuel (saf) market research report to meet your requirements.
 RIA -
RIA - 
