
Synchrophasor Market Size 2025-2029
The synchrophasor market size is forecast to increase by USD 1.51 billion, at a CAGR of 18.2% between 2024 and 2029.
- The market is experiencing significant growth due to the increasing need to reduce grid outages and enhance the reliability of power transmission systems. Smart grids, which utilize Synchrophasors for real-time monitoring and control, offer numerous benefits, including improved power system stability, enhanced grid security, and increased efficiency. However, the high cost of installing communication systems for Synchrophasor implementation poses a significant challenge for market expansion.
- This obstacle necessitates collaborative efforts between stakeholders to develop cost-effective solutions and incentivize adoption. Companies seeking to capitalize on this market's potential should focus on addressing this challenge while leveraging the advantages of Synchrophasors in smart grids to offer innovative, reliable, and cost-effective solutions to utility providers and grid operators.
What will be the Size of the Synchrophasor Market during the forecast period?

Explore in-depth regional segment analysis with market size data - historical 2019-2023 and forecasts 2025-2029 - in the full report.
Request Free Sample
The market continues to evolve, driven by the increasing demand for power system automation and grid modernization. Energy management and demand response are key applications, with data processing playing a crucial role in fault detection and load forecasting. Distributed generation and renewable energy integration require dynamic stability analysis and power flow analysis for optimal grid integration. Transient stability analysis and small-signal stability analysis are essential for maintaining frequency stability and voltage stability. Data security and data visualization are paramount in ensuring data integrity and facilitating effective decision-making. Communication networks and GPS synchronization enable real-time monitoring and dynamic state estimation.
Power system control and protection rely on time synchronization and electrical equipment data acquisition systems for effective response to power system oscillations and faults. Energy storage and wide-area control are integral to maintaining system integrity and improving power system modeling capabilities. Power system modeling, fault location, and dynamic stability analysis are essential for optimizing power system performance and enhancing network security. The market's continuous evolution reflects the dynamic nature of the power industry, with ongoing developments in power system automation, energy storage, and grid modernization.
How is this Synchrophasor Industry segmented?
The synchrophasor industry research report provides comprehensive data (region-wise segment analysis), with forecasts and estimates in "USD million" for the period 2025-2029, as well as historical data from 2019-2023 for the following segments.
- Application
- Power station
- Transforming station
- Others
- Component
- Hardware
- Software
- End-user
- Utilities
- Industrial
- Commercial
- Geography
- North America
- US
- Canada
- Mexico
- Europe
- Germany
- UK
- APAC
- China
- India
- Japan
- South America
- Brazil
- Rest of World (ROW)
- North America
By Application Insights
The power station segment is estimated to witness significant growth during the forecast period.
The market is experiencing significant growth due to the increasing demand for advanced energy management solutions in various applications. In power stations, synchrophasors play a vital role in ensuring power stability and preventing large disturbances or blackouts. By measuring the voltage, frequency, and phase angle of electrical signals with high-resolution time synchronization, synchrophasors enable early fault detection and improve overall system performance. Beyond power stations, synchrophasors are also essential for demand response programs, data processing, and grid modernization. They facilitate communication between distributed energy resources and the grid, enabling real-time monitoring, load forecasting, and dynamic state estimation. Synchrophasors also support power system control, dynamic stability analysis, and fault location, ensuring the reliability and efficiency of transmission lines and smart grids.
Moreover, synchrophasors play a crucial role in power system protection, voltage stability, and renewable energy integration. They help maintain system integrity by providing accurate and timely data for transient stability analysis, power flow analysis, and fault classification. Additionally, synchrophasors ensure frequency stability and coordinate the operation of energy storage systems and wide-area control. Data security and data visualization are critical aspects of the market. Advanced encryption techniques and secure communication networks protect sensitive data, while data historians and real-time monitoring systems enable comprehensive data archiving and analysis. The integration of GPS synchronization and IEEE C37.118 standards further enhances the accuracy and interoperability of synchrophasor systems.
In conclusion, the market is driven by the need for advanced energy management solutions in various applications, including power stations, demand response, data processing, and grid modernization. Synchrophasors' ability to ensure power stability, improve system efficiency, and facilitate communication between distributed energy resources makes them an indispensable component of modern power systems.
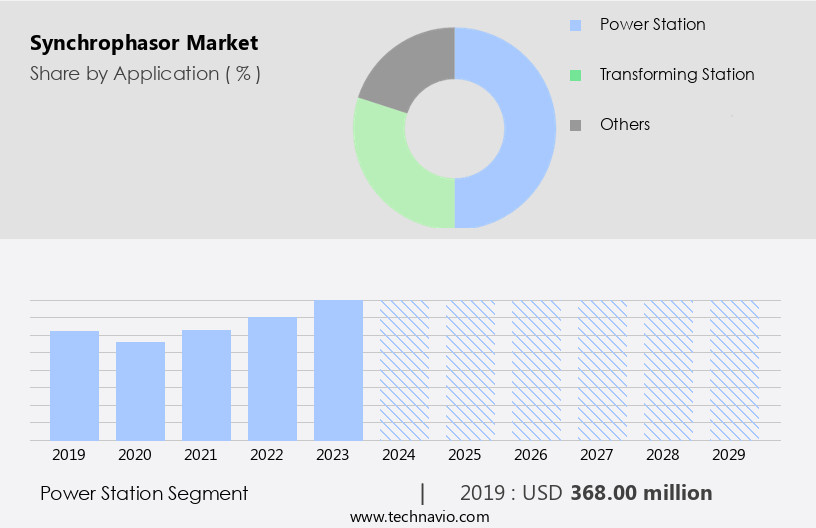
The Power station segment was valued at USD 368.00 billion in 2019 and showed a gradual increase during the forecast period.
Regional Analysis
North America is estimated to contribute 34% to the growth of the global market during the forecast period.Technavio’s analysts have elaborately explained the regional trends and drivers that shape the market during the forecast period.

The North American smart grid market is witnessing significant growth, with the US and Canada leading the way in large-scale deployments. In the US, government stimulus funding has facilitated the installation of thousands of Phasor Measurement Units (PMUs) to enhance grid reliability and monitor power systems in real-time. The North American Synchrophasor Initiative (NASPI), in collaboration with the North American Electric Reliability Corporation (NERC) and the Department of Energy (DoE), has played a pivotal role in driving these installations. In Canada, the power grid is undergoing a major transformation to accommodate smart grid technologies and services. Data processing, fault detection, and transmission are integral components of this transition, with communication networks and data security ensuring the secure transfer and analysis of vast amounts of data.
Power system control, dynamic state estimation, and frequency stability are also crucial elements, as the integration of renewable energy sources and distributed generation necessitates advanced power system modeling and analysis. The smart grid's evolution is further characterized by the adoption of energy storage, wide-area control, and power system protection, as well as the implementation of voltage stability, power quality, and transient stability analysis. Grid modernization and system integrity are paramount, with data visualization and real-time monitoring enabling effective power system oscillation detection and fault location. IEEE C37.118 standards ensure interoperability and compatibility, while data historians and data archiving facilitate data access and analysis for future load forecasting and trend identification.
Network security is a critical concern, with robust communication networks and data encryption ensuring the protection of sensitive information. The synergy of these various components is driving the North American smart grid market forward, with the potential to revolutionize energy management, demand response, and power system automation.
Market Dynamics
Our researchers analyzed the data with 2024 as the base year, along with the key drivers, trends, and challenges. A holistic analysis of drivers will help companies refine their marketing strategies to gain a competitive advantage.
The market is a dynamic and evolving sector that focuses on the implementation and utilization of synchrophasors for power system monitoring, control, and grid stability. Synchrophasors, also known as smart grid sensors, are crucial devices that provide real-time measurement and monitoring of electrical power systems. They offer advanced features such as high precision, time synchronization, and phasor measurement capabilities, enabling effective grid management and fault detection. Synchrophasor technology plays a vital role in enhancing power system reliability and efficiency by providing accurate and timely information on power system conditions. It facilitates the integration of renewable energy sources and improves the overall performance of the power grid. Furthermore, synchrophasors contribute to the development of advanced control systems, such as wide-area monitoring, protection, and control (WAMS), which enable effective grid management and response to system disturbances. In addition, synchrophasors are essential for the implementation of smart grids, which aim to optimize energy production, distribution, and consumption. They enable the integration of distributed energy resources, demand response, and energy storage systems, ensuring a more resilient and sustainable power grid. With the increasing focus on grid modernization and the integration of renewable energy sources, the market is expected to experience significant growth in the coming years. Synchrophasors also facilitate the implementation of advanced applications, such as state estimation, load flow analysis, and voltage stability assessment. They offer improved accuracy and reliability compared to traditional monitoring methods, ensuring the efficient and effective operation of power systems. Moreover, synchrophasors contribute to the enhancement of power system security and reliability by providing real-time information on system conditions and enabling effective response to system disturbances. They facilitate the implementation of advanced protection schemes and enable the rapid identification and isolation of faults, reducing the duration and impact of power outages. Furthermore, synchrophasors play a crucial role in the integration of renewable energy sources, such as wind and solar power, into the power grid. They enable the effective management and control of these intermittent sources, ensuring a stable and reliable power supply. In summary, the market is a vital sector that focuses on the implementation and utilization of synchrophasors for power system monitoring, control, and grid stability. Synchrophasors offer advanced features, such as high precision, time synchronization, and phasor measurement capabilities, enabling effective grid management and fault detection. They contribute to the development of advanced control systems, such as WAMS, and facilitate the implementation of smart grids, renewable energy integration, and advanced applications. With the increasing focus on grid modernization and the integration of renewable energy sources, the market is expected to experience significant growth in the coming years.
What are the key market drivers leading to the rise in the adoption of Synchrophasor Industry?
- The growing demand for minimizing grid outages serves as the primary market driver.
- The power industry faces numerous challenges due to the increasing strain on infrastructure caused by population growth and demand for power resources. Power outages, which can result from factors such as inclement weather, equipment failure, maintenance shutdowns, load-shedding, vandalism, and cyber-attacks, cause significant inconvenience to end-users and result in revenue loss for utilities. Moreover, power outages can impede emergency services and jeopardize national security by compromising communication systems. To mitigate these challenges, utilities are turning to smart grid technologies, including data visualization, load forecasting, data analysis, and state estimation. These technologies enable real-time monitoring and analysis of power systems, allowing utilities to identify technical issues faster and promptly restore power.
- Additionally, dynamic state estimation and small-signal stability analysis help ensure power system control and frequency stability. Communication networks play a crucial role in power system operations, and their disruption during power outages can exacerbate the situation. Therefore, investing in robust communication networks is essential for maintaining power system reliability and ensuring the timely restoration of power services. In conclusion, the power industry is facing significant challenges due to the increasing demand for power resources and the aging infrastructure. Power outages can cause significant inconvenience, revenue loss, and even compromise national security. Utilities are turning to smart grid technologies, including data visualization, load forecasting, data analysis, state estimation, and communication network investments, to improve power system reliability and ensure timely power restoration.
What are the market trends shaping the Synchrophasor Industry?
- Smart grids are experiencing significant advancements and increasing benefits, making them the current market trend in the energy sector. This trend reflects the growing importance of efficient, flexible, and sustainable power systems.
- The implementation of power system automation through smart grids is gaining momentum due to several key factors. The increasing number of power outages and the associated costs have led utilities to seek more efficient and reliable solutions. Additionally, the mandate to incorporate renewable energy sources into the power grid necessitates advanced control systems for managing variable energy sources. Moreover, the integration of computing and communication devices into the power system is becoming increasingly complex, requiring additional resources for wide-area control, power system modeling, fault location, dynamic stability analysis, and power system oscillations. The financial benefits of smart grids, including improved system integrity and reduced energy losses, outweigh the costs of transitioning from traditional power systems.
- Furthermore, the realization of the benefits of smart grids, such as real-time monitoring, improved system stability, and enhanced energy storage capabilities, has led several countries to invest in smart grid projects and infrastructure. The use of data acquisition systems, time synchronization, and electrical equipment in smart grids enables better system performance and more effective management of electrical loads. Overall, the trend towards power system automation and the benefits it offers are driving the growth of the smart grid market.
What challenges does the Synchrophasor Industry face during its growth?
- The escalating costs associated with installing communication systems pose a significant challenge and hinder the growth of the industry.
- Synchrophasor technology plays a crucial role in power system protection by providing real-time situational awareness and control of the grid system. This technology enables utilities to identify and locate disturbances across the network, enhancing grid resilience. Data from Phasor Measuring Units (PMUs) is timestamped using GPS synchronization and transmitted to Phasor Data Concentrators (PDCs). PDCs filter out bad data and send refined information to the control center via advanced telecommunication technologies like fiber optics and satellites. However, the limited communication network bandwidth and high cost of installing the necessary infrastructure pose challenges.
- Synchrophasor technology also supports voltage stability, renewable energy integration, data historians, real-time monitoring, fault classification, network security, and IEEE C37.118 compliance. Despite these benefits, the massive amount of data generated over a wide geographical area requires significant processing power and storage capacity.
Exclusive Customer Landscape
The synchrophasor market forecasting report includes the adoption lifecycle of the market, covering from the innovator’s stage to the laggard’s stage. It focuses on adoption rates in different regions based on penetration. Furthermore, the synchrophasor market report also includes key purchase criteria and drivers of price sensitivity to help companies evaluate and develop their market growth analysis strategies.

Customer Landscape
Key Companies & Market Insights
Companies are implementing various strategies, such as strategic alliances, synchrophasor market forecast, partnerships, mergers and acquisitions, geographical expansion, and product/service launches, to enhance their presence in the industry.
ABB Ltd. - The company specializes in integrating Global Positioning System GPS technology with synchrophasors for advanced monitoring of electrical power grids worldwide. This innovative solution enhances grid stability and efficiency by providing real-time data analysis and synchronization capabilities.
The industry research and growth report includes detailed analyses of the competitive landscape of the market and information about key companies, including:
- ABB Ltd.
- ALSTOM SA
- Arbiter Systems Inc.
- ElectraNet Pty Ltd.
- Electric Power Group LLC
- ERLPhase Power Technologies Ltd.
- Fortive Corp.
- General Electric Co.
- Hitachi Ltd.
- Quanta Technology LLC
- Schneider Electric SE
- Schweitzer Engineering Laboratories Inc.
- Shenzhen Nanwang Guorui Technology Co. Ltd.
- Siemens AG
- Toshiba Corp.
- Vizimax Inc.
Qualitative and quantitative analysis of companies has been conducted to help clients understand the wider business environment as well as the strengths and weaknesses of key industry players. Data is qualitatively analyzed to categorize companies as pure play, category-focused, industry-focused, and diversified; it is quantitatively analyzed to categorize companies as dominant, leading, strong, tentative, and weak.
Recent Development and News in Synchrophasor Market
- In January 2024, ABB, a leading technology provider, announced the launch of its latest synchrophasor solution, "ABB Ability SynchroGuard New Edition," at the DistribuTECH conference. This advanced solution enhances grid stability and reliability by providing real-time monitoring and control of power systems (ABB Press Release, 2024).
- In March 2024, Siemens Energy and National Grid signed a strategic partnership agreement to collaborate on the development and deployment of synchrophasor technology for enhancing grid flexibility and integrating renewable energy sources (Siemens Energy Press Release, 2024).
- In May 2024, Itron, a global technology leader, raised USD150 million in a funding round to expand its synchrophasor offerings and strengthen its position in the smart grid market (Mercom Capital Group, 2024).
- In February 2025, the North American Electric Reliability Corporation (NERC) approved the mandatory use of synchrophasor technology for all bulk electric systems in the United States and Canada, effective from 2026 (NERC Press Release, 2025). This regulatory approval is expected to significantly boost the adoption of synchrophasor technology in the region.
Research Analyst Overview
- In the electrical power systems market, communication protocols play a crucial role in enabling effective synchrophasor technology implementation. This technology, which measures the voltage magnitude, phasor angle, and current magnitude in real-time, contributes significantly to power grid stability and energy efficiency. Outage management and resource allocation are two primary areas where synchrophasor data analytics excels. By providing real-time data on voltage magnitude and frequency deviation, utilities can swiftly identify and address issues, reducing the duration and impact of power outages. SCADA systems and control systems integrate synchrophasor data to optimize energy transmission and distribution, ensuring network topology remains stable during grid operation.
- Data validation and integrity are essential to maintaining trust in the data, which is critical for predictive analytics and machine learning applications. Renewable energy sources, such as wind and solar, are increasingly integrated into the power grid, necessitating advanced control systems and real-time signal processing for effective grid operation. Fault diagnostics and mitigation strategies are also enhanced with synchrophasor technology, enabling quick response to electrical faults and improving overall system reliability. Machine learning, deep learning, and artificial intelligence algorithms are employed to analyze synchrophasor data, providing valuable insights for energy transmission, power distribution, and grid operation.
- These advanced technologies enable more efficient resource allocation, improved energy efficiency, and enhanced network performance.
Dive into Technavio’s robust research methodology, blending expert interviews, extensive data synthesis, and validated models for unparalleled Synchrophasor Market insights. See full methodology.
|
Market Scope |
|
|
Report Coverage |
Details |
|
Page number |
220 |
|
Base year |
2024 |
|
Historic period |
2019-2023 |
|
Forecast period |
2025-2029 |
|
Growth momentum & CAGR |
Accelerate at a CAGR of 18.2% |
|
Market growth 2025-2029 |
USD 1514.6 million |
|
Market structure |
Fragmented |
|
YoY growth 2024-2025(%) |
15.0 |
|
Key countries |
US, China, Canada, Mexico, Germany, India, Japan, UK, Brazil, and Saudi Arabia |
|
Competitive landscape |
Leading Companies, Market Positioning of Companies, Competitive Strategies, and Industry Risks |
What are the Key Data Covered in this Synchrophasor Market Research and Growth Report?
- CAGR of the Synchrophasor industry during the forecast period
- Detailed information on factors that will drive the growth and forecasting between 2025 and 2029
- Precise estimation of the size of the market and its contribution of the industry in focus to the parent market
- Accurate predictions about upcoming growth and trends and changes in consumer behaviour
- Growth of the market across North America, APAC, Europe, South America, and Middle East and Africa
- Thorough analysis of the market’s competitive landscape and detailed information about companies
- Comprehensive analysis of factors that will challenge the synchrophasor market growth of industry companies
We can help! Our analysts can customize this synchrophasor market research report to meet your requirements.