Synthetic Leather Market Analysis, Size, and Forecast 2024-2028: North America (US and Canada), Europe (France, Germany, Italy, and UK), Middle East and Africa (Egypt, KSA, Oman, and UAE), APAC (China, India, and Japan), South America (Argentina and Brazil), and Rest of World (ROW)

Synthetic Leather Market Analysis, Size, and Forecast 2024-2028:
North America (US and Canada), Europe (France, Germany, Italy, and UK), Middle East and Africa (Egypt, KSA, Oman, and UAE), APAC (China, India, and Japan), South America (Argentina and Brazil), and Rest of World (ROW)

Published: Aug 2024 184 Pages SKU: IRTNTR41583

Market Overview at a Glance

$25.3 B
Market Opportunity
9.42%
CAGR
8.31
YoY growth 2023-2024(%)

Synthetic Leather Market Size 2024-2028

The synthetic leather market size is valued to increase USD 25.3 billion, at a CAGR of 9.42% from 2023 to 2028. High demand from developing economies will drive the synthetic leather market.

Major Market Trends & Insights

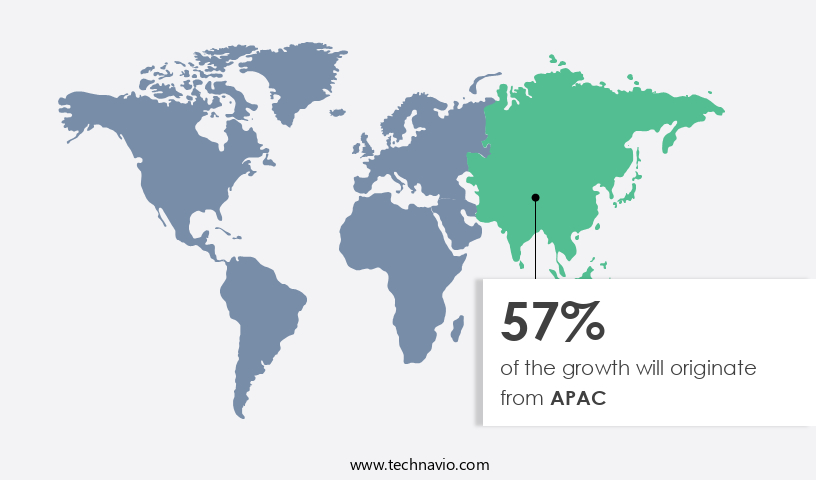
  • APAC dominated the market and accounted for a 57% growth during the forecast period.
  • By Product - PU-based segment was valued at USD 23.30 billion in 2022
  • By End-user - Footwear industry segment accounted for the largest market revenue share in 2022

Market Size & Forecast

  • Market Opportunities: USD 96.07 billion
  • Market Future Opportunities: USD 25.30 billion
  • CAGR from 2023 to 2028 : 9.42%

Market Summary

  • The market represents a dynamic and evolving industry, driven by innovations in core technologies and applications. With a growing emphasis on customization and sustainability, synthetic leather has gained significant traction, particularly in developing economies. According to industry reports, The market is projected to account for over 50% share of the leather market by 2025. However, market growth is not without challenges, including fluctuating raw material prices and regulatory compliance. Key applications include automotive, fashion, and furniture, with the automotive sector leading the market growth.
  • As of 2021, the automotive segment is estimated to hold approximately 40% market share. Despite these challenges, the market continues to unfold with new opportunities, such as advancements in biodegradable synthetic leather and increasing demand from the electronics industry.

What will be the Size of the Synthetic Leather Market during the forecast period?

Synthetic Leather Market Size

Get Key Insights on Market Forecast (PDF) Request Free Sample

How is the Synthetic Leather Market Segmented ?

The synthetic leather industry research report provides comprehensive data (region-wise segment analysis), with forecasts and estimates in "USD billion" for the period 2024-2028, as well as historical data from 2018-2022 for the following segments.

  • Product
    • PU-based
    • PVC-based
    • Bio-based
  • End-user
    • Footwear industry
    • Furnishing industry
    • Automotive industry
    • Bags industry
    • Others
  • Application
    • Footwear
    • Automotive
    • Furnishing
    • Clothing
    • Bags & Wallets
    • Sports Goods
    • Other Applications
  • Geography
    • North America
      • US
      • Canada
    • Europe
      • France
      • Germany
      • Italy
      • UK
    • Middle East and Africa
      • Egypt
      • KSA
      • Oman
      • UAE
    • APAC
      • China
      • India
      • Japan
    • South America
      • Argentina
      • Brazil
    • Rest of World (ROW)

By Product Insights

The pu-based segment is estimated to witness significant growth during the forecast period.

PU-based synthetic leather, also recognized as bi-cast or split leather, is experiencing significant market expansion due to its ease of maintenance, waterproof properties, and softness, surpassing other synthetic leather types. Weighing less than natural leather, it offers versatility in texture and color options, making it a preferred choice in footwear, clothing, and automobile industries. The increasing trend of veganism and sustainability has led many consumers to opt for synthetic leather, which resembles genuine leather. PU-based synthetic leather boasts impressive durability features, such as tear resistance and extended product lifespan, ascertained through rigorous testing like flexural strength and abrasion resistance. These attributes are crucial for industries that require high-performance materials.

Additionally, PU-based synthetic leather is resistant to UV rays, ensuring colorfastness and reducing the need for frequent replacement. Manufacturing advancements, such as microfiber manufacturing, non-woven fabrics, fiber reinforcement methods, and PU coating techniques, have contributed to the evolution of synthetic leather. Eco-friendly alternatives, like cellulose-based materials, bio-based polymers, and plant-based materials, are also gaining popularity, as sustainability certifications become increasingly important. Waste reduction strategies, such as textile recycling technologies, are also being integrated into the manufacturing process to minimize environmental impact. PU leather properties, including coating formulations, surface coating adhesion, and material tensile strength, are continually being analyzed and optimized to enhance its performance and appeal to businesses and consumers alike.

Synthetic Leather Market Size

Request Free Sample

The PU-based segment was valued at USD 23.30 billion in 2018 and showed a gradual increase during the forecast period.

Synthetic Leather Market Size

Request Free Sample

Regional Analysis

APAC is estimated to contribute 57% to the growth of the global market during the forecast period.Technavio's analysts have elaborately explained the regional trends and drivers that shape the market during the forecast period.

Synthetic Leather Market Share by Geography

See How Synthetic Leather Market Demand is Rising in APAC Request Free Sample

The market in the Asia Pacific (APAC) region is experiencing significant growth, surpassing other global markets. This expansion is primarily driven by the burgeoning industries of footwear, apparel, automotive, furnishing, and bags, which increasingly utilize synthetic leather. Key contributors to this growth include China, Japan, and India. Among these, China holds a prominent position as the leading manufacturer of synthetic leather. The shift towards eco-consciousness among Chinese consumers, who are favoring synthetic leather products over animal-hide alternatives, is a significant factor fueling the market's expansion. Additionally, the demand for affordable leather imitation products, such as bags, apparel, and automotive accessories, is another driving force.

Market Dynamics

Our researchers analyzed the data with 2023 as the base year, along with the key drivers, trends, and challenges. A holistic analysis of drivers will help companies refine their marketing strategies to gain a competitive advantage.

The global synthetic leather market is defined by continuous product innovation and shifting sourcing priorities as manufacturers balance performance, cost, and sustainability. Market participants focus on polyurethane foam density impact on durability and microfiber composition effects on tensile strength to enhance end-product longevity, while coating thickness influence on abrasion resistance and embossing roller design influence on grain pattern are central to achieving desired aesthetics and wear performance. Recycling methods for pu leather scraps and bio-based polyurethane production process reflect a broader move toward circularity and lower lifecycle environmental impact. Comparative material assessments, such as comparison of polyester and polyamide fibers in synthetic leather and comparison of pvc and polyurethane leather alternatives, inform material selection and cost optimization strategies.

Producers are also investing in testing and certification, applying assessment of flame retardant coating efficiency and testing methods for antimicrobial coating efficacy to meet stricter product safety expectations, and undertaking analysis of synthetic leather material lifespan to guide warranty and quality assurance programs. Process improvements include optimization of production process for cost reduction and methods to improve synthetic leather durability, alongside techniques for enhancing the flexibility of synthetic leather and effect of coating formulation on water resistance. Emerging research explores new approaches to create bio-based polymers and cellulose-based synthetic leather production techniques, while adoption of environmental certifications for sustainable synthetic leather supports market differentiation and supplier compliance. This multidimensional evolution positions the market toward higher value applications and more sustainable supply chains.

Synthetic Leather Market Size

What are the key market drivers leading to the rise in the adoption of Synthetic Leather Industry?

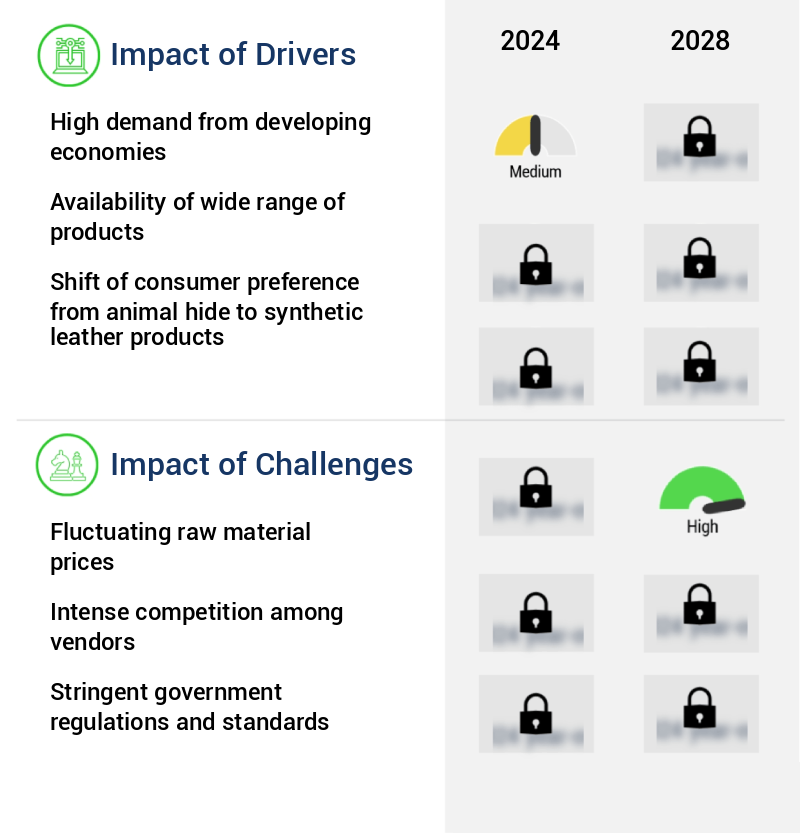
  • Developing economies' substantial demand significantly drives the market. 
  • Synthetic leather holds significant demand in emerging economies, including China, India, Brazil, South Africa, and Indonesia. This trend is predominantly driven by its extensive usage in industries such as apparel, bags, and footwear. China is a leading player in The market, fueled by the burgeoning consumer product manufacturing sectors. The escalating industries of automotive, footwear, and bags, which are propelled by increasing economic activities and rising disposable income in emerging markets, particularly China, are fueling the demand for synthetic leather.
  • For instance, the National Bureau of Statistics of China reported a 3% increase in per capita disposable income of urban residents in 2022. This growth is expected to continue, further boosting the demand for synthetic leather.

What are the market trends shaping the Synthetic Leather Industry?

  • Synthetic leather customization is gaining popularity as the latest market trend. The customization of synthetic leather is an emerging market trend.
  • The customization of synthetic leather is an evolving trend in the global market, predominantly driven by luxury consumer product manufacturers. This process involves tailoring design, color, luster, and texture to meet specific user requirements. Over the past five years, customized synthetic leather has witnessed significant adoption across various sectors, catering to the increasing demand for personalized products. companies, such as Toray, a leading player in the synthetic leather industry, offer customization options in pattern, design, luster, texture, and prints.
  • Through advanced digital techniques like laser printing and cutting, they enable traditional embossing methods. The versatility and adaptability of synthetic leather have contributed to its growing popularity, making it a preferred choice for numerous applications.

What challenges does the Synthetic Leather Industry face during its growth?

  • The volatile pricing of raw materials poses a significant challenge to the industry, impeding its growth. 
  • Synthetic leather manufacturing relies heavily on the prices of crude oil and forest products for raw materials, leading to market volatility. Polymer films and silicone are key substrates in production, but the prices of petroleum-derived raw materials like PVC and PU, which are extensively used, are directly influenced by crude oil costs. This dependence creates challenges for companies, particularly in the face of increasing competition from emerging economies.
  • The price fluctuations of these raw materials significantly impact the synthetic leather industry, requiring continuous adaptation and innovation.

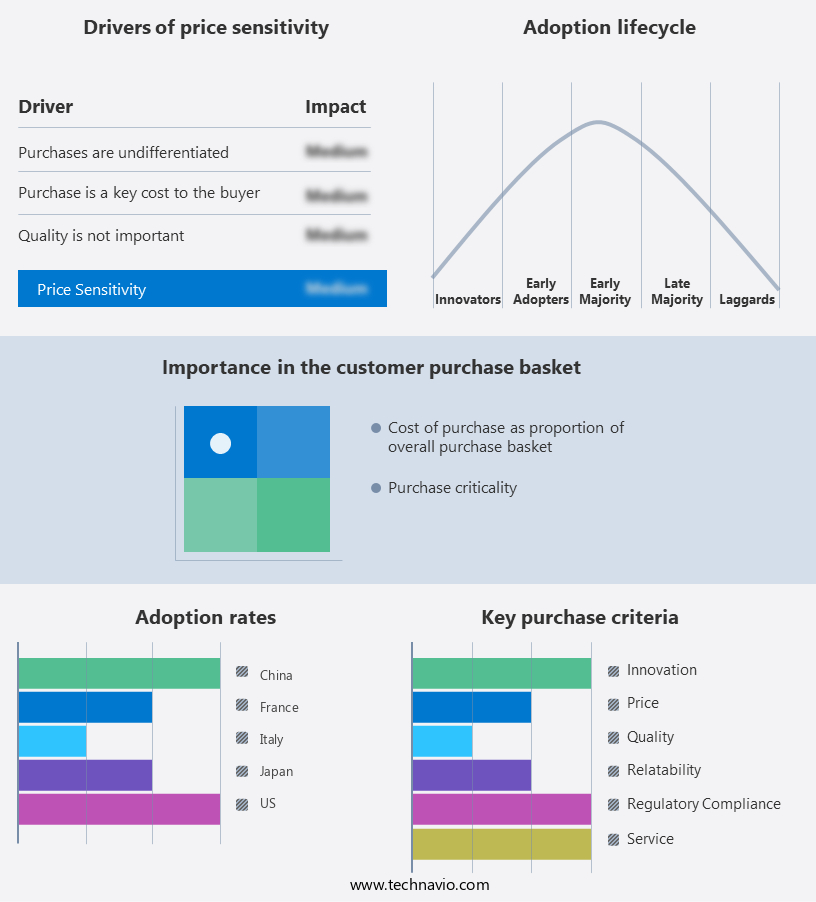
Exclusive Technavio Analysis on Customer Landscape

The synthetic leather market forecasting report includes the adoption lifecycle of the market, covering from the innovator's stage to the laggard's stage. It focuses on adoption rates in different regions based on penetration. Furthermore, the synthetic leather market report also includes key purchase criteria and drivers of price sensitivity to help companies evaluate and develop their market growth analysis strategies.

Synthetic Leather Market Share by Geography

 Customer Landscape of Synthetic Leather Industry

Competitive Landscape

Companies are implementing various strategies, such as strategic alliances, synthetic leather market forecast, partnerships, mergers and acquisitions, geographical expansion, and product/service launches, to enhance their presence in the industry.

AIR WATER INC. - The subsidiary FILWEL of this corporation specializes in providing synthetic leather solutions to various industries, utilizing advanced technology and innovative materials. FILWEL's offerings contribute significantly to the company's diversified product portfolio.

The industry research and growth report includes detailed analyses of the competitive landscape of the market and information about key companies, including:

  • AIR WATER INC.
  • Akea Srl
  • Alfatex Italia Srl
  • Anhui Anli Material Technology Co. Ltd.
  • Asahi Kasei Corp.
  • Colence Pvt. Ltd.
  • H.R. Polycoats Pvt. Ltd.
  • Kolon Industries Inc.
  • KURARAY Co. Ltd.
  • Lederplast Spa
  • Marvel Vinyls Ltd.
  • Mayur Uniquoters Ltd.
  • Nan Ya Plastic Corp.
  • San Fang Chemical Industrial Co. Ltd.
  • Teijin Ltd.
  • Toray Industries Inc.
  • Uniroyal Global Engineered Products Inc.
  • Winner Nippon Leatherette Pvt. Ltd.
  • Zhejiang Hexin Industry Group Co. Ltd.
  • Zhejiang Yongfa Synthetic Leather Co. Ltd.

Qualitative and quantitative analysis of companies has been conducted to help clients understand the wider business environment as well as the strengths and weaknesses of key industry players. Data is qualitatively analyzed to categorize companies as pure play, category-focused, industry-focused, and diversified; it is quantitatively analyzed to categorize companies as dominant, leading, strong, tentative, and weak.

Recent Development and News in Synthetic Leather Market

  • In January 2024, German synthetic leather manufacturer, Stahl, announced the launch of its new sustainable PU leather product, EcoCalf, at the International Leather Fair in Shanghai. This eco-friendly alternative, made from recycled materials, marked a significant stride in the synthetic leather industry's move towards sustainability (Stahl press release).
  • In March 2024, LG Chem, a leading global chemical company, and Adidas, the renowned sports footwear brand, joined forces to develop and commercialize high-performance synthetic leather for footwear. This strategic partnership aimed to create eco-friendly, durable, and lightweight materials for athletic shoes (Adidas press release).
  • In May 2024, Toray Industries, a Japanese chemical and textile company, announced a USD300 million investment in its synthetic leather production facility in Thailand. This expansion was expected to increase the company's global synthetic leather production capacity by 30% (Toray Industries press release).
  • In February 2025, the European Union passed the Single Use Plastics Directive, banning the use of single-use plastics in various sectors, including fashion and footwear, by 2025. This regulatory move created a surge in demand for synthetic leather alternatives, as they are often considered more sustainable than their real leather counterparts (European Parliament press release).

Dive into Technavio's robust research methodology, blending expert interviews, extensive data synthesis, and validated models for unparalleled Synthetic Leather Market insights. See full methodology.

Market Scope

Report Coverage

Details

Page number

184

Base year

2023

Historic period

2018-2022

Forecast period

2024-2028

Growth momentum & CAGR

Accelerate at a CAGR of 9.42%

Market growth 2024-2028

USD 25.3 billion

Market structure

Fragmented

YoY growth 2023-2024(%)

8.31

Key countries

US, Canada, Germany, UK, Italy, France, China, India, Japan, Brazil, Egypt, UAE, Oman, Argentina, KSA, UAE, Brazil, and Rest of World (ROW)

Competitive landscape

Leading Companies, Market Positioning of Companies, Competitive Strategies, and Industry Risks

Request Free Sample

Research Analyst Overview

  • Synthetic leather, a versatile and resilient alternative to natural leather, continues to gain traction in various industries due to its numerous advantages. One significant development in this market is the emphasis on enhancing tear resistance and product lifespan through rigorous testing, such as tear resistance testing and flexural strength analysis. Moreover, eco-friendly alternatives are increasingly popular, with life cycle assessments driving the adoption of cellulose-based materials, microfiber manufacturing, and non-woven fabrics. Fiber reinforcement methods, like fiberglass and Carbon Fiber, and PU coating techniques contribute to the durability and surface coating adhesion of synthetic leather. Manufacturers are also exploring innovative PU leather properties, such as bio-based polymers and PVC leather alternatives, to reduce waste and improve sustainability.
  • Sustainability certifications, like GOTS and OEKO-TEX, are gaining importance in the market, reflecting the industry's commitment to eco-friendly practices. Water resistance ratings and abrasion resistance are essential performance indicators, with advancements in textile recycling technologies and chemical composition analysis enabling the production of high-performance synthetic leather. The manufacturing process optimization of fibers like polyester, polyamide, polyurethane, acrylic, and bio-based materials continues to drive innovation in the synthetic leather industry. Comparatively, the adoption of surface coating adhesion technologies has led to improvements in colorfastness assessment and synthetic leather durability, ensuring high-quality products that meet the evolving demands of consumers and industries.
  • The ongoing research and development in this sector underscore the dynamic and continuously unfolding nature of the market.

What are the Key Data Covered in this Synthetic Leather Market Research and Growth Report?

  • What is the expected growth of the Synthetic Leather Market between 2024 and 2028?

    • USD 25.3 billion, at a CAGR of 9.42%

  • What segmentation does the market report cover?

    • The report is segmented by Product (PU-based, PVC-based, and Bio-based), End-user (Footwear industry, Furnishing industry, Automotive industry, Bags industry, and Others), Geography (APAC, North America, Europe, South America, and Middle East and Africa), and Application (Footwear, Automotive, Furnishing, Clothing, Bags & Wallets, Sports Goods, and Other Applications)

  • Which regions are analyzed in the report?

    • APAC, North America, Europe, South America, and Middle East and Africa

  • What are the key growth drivers and market challenges?

    • High demand from developing economies, Fluctuating raw material prices

  • Who are the major players in the Synthetic Leather Market?

    • AIR WATER INC., Akea Srl, Alfatex Italia Srl, Anhui Anli Material Technology Co. Ltd., Asahi Kasei Corp., Colence Pvt. Ltd., H.R. Polycoats Pvt. Ltd., Kolon Industries Inc., KURARAY Co. Ltd., Lederplast Spa, Marvel Vinyls Ltd., Mayur Uniquoters Ltd., Nan Ya Plastic Corp., San Fang Chemical Industrial Co. Ltd., Teijin Ltd., Toray Industries Inc., Uniroyal Global Engineered Products Inc., Winner Nippon Leatherette Pvt. Ltd., Zhejiang Hexin Industry Group Co. Ltd., and Zhejiang Yongfa Synthetic Leather Co. Ltd.

Market Research Insights

  • The market encompasses a diverse range of processes and techniques, including finishing processes, production efficiency enhancements, and various embossing techniques. According to industry data, the global synthetic leather production reached 1.5 million metric tons in 2020, with an estimated growth rate of 5% per annum. This expansion is driven by advancements in production methods, such as PU foam processing, which increases material consistency and reduces waste. Additionally, the market prioritizes quality control metrics, with texture analysis and dimensional stability assessment playing crucial roles.
  • Environmental impact assessments are also integral, leading to the adoption of sustainable production methods and the integration of antimicrobial and flame retardant coatings. Cost optimization and performance testing are ongoing priorities, with heat resistance, pigment dispersion, and wear resistance key performance indicators. Regulatory compliance, including dyeing techniques and chemical resistance, is another critical aspect of the market's evolution.

We can help! Our analysts can customize this synthetic leather market research report to meet your requirements.

Get in touch

1 Executive Summary

  • 1.1 Market overview
    • Executive Summary - Chart on Market Overview
    • Executive Summary - Data Table on Market Overview
    • Executive Summary - Chart on Global Market Characteristics
    • Executive Summary - Chart on Market by Geography
    • Executive Summary - Chart on Market Segmentation by Product
    • Executive Summary - Chart on Market Segmentation by End-user
    • Executive Summary - Chart on Incremental Growth
    • Executive Summary - Data Table on Incremental Growth
    • Executive Summary - Chart on Company Market Positioning

2 Market Landscape

  • 2.1 Market ecosystem
    • Parent Market
    • Data Table on - Parent Market
  • 2.2 Market characteristics
    • Market characteristics analysis
  • 2.3 Value chain analysis
    • Value Chain Analysis

3 Market Sizing

  • 3.1 Market definition
    • Offerings of companies included in the market definition
  • 3.2 Market segment analysis
    • Market segments
  • 3.3 Market size 2023
    • 3.4 Market outlook: Forecast for 2023-2028
      • Chart on Global - Market size and forecast 2023-2028 ($ billion)
      • Data Table on Global - Market size and forecast 2023-2028 ($ billion)
      • Chart on Global Market: Year-over-year growth 2023-2028 (%)
      • Data Table on Global Market: Year-over-year growth 2023-2028 (%)

    4 Historic Market Size

    • 4.1 Global Synthetic Leather Market 2018 - 2022
      • Historic Market Size - Data Table on Global Synthetic Leather Market 2018 - 2022 ($ billion)
    • 4.2 Product segment analysis 2018 - 2022
      • Historic Market Size - Product Segment 2018 - 2022 ($ billion)
    • 4.3 End-user segment analysis 2018 - 2022
      • Historic Market Size - End-user Segment 2018 - 2022 ($ billion)
    • 4.4 Geography segment analysis 2018 - 2022
      • Historic Market Size - Geography Segment 2018 - 2022 ($ billion)
    • 4.5 Country segment analysis 2018 - 2022
      • Historic Market Size - Country Segment 2018 - 2022 ($ billion)

    5 Five Forces Analysis

    • 5.1 Five forces summary
      • Five forces analysis - Comparison between 2023 and 2028
    • 5.2 Bargaining power of buyers
      • Bargaining power of buyers - Impact of key factors 2023 and 2028
    • 5.3 Bargaining power of suppliers
      • Bargaining power of suppliers - Impact of key factors in 2023 and 2028
    • 5.4 Threat of new entrants
      • Threat of new entrants - Impact of key factors in 2023 and 2028
    • 5.5 Threat of substitutes
      • Threat of substitutes - Impact of key factors in 2023 and 2028
    • 5.6 Threat of rivalry
      • Threat of rivalry - Impact of key factors in 2023 and 2028
    • 5.7 Market condition
      • Chart on Market condition - Five forces 2023 and 2028

    6 Market Segmentation by Product

    • 6.1 Market segments
      • Chart on Product - Market share (2023-2028) (%)
      • Data Table on Product - Market share (2023-2028) (%)
    • 6.2 Comparison by Product
      • Chart on Comparison by Product
      • Data Table on Comparison by Product
    • 6.3 PU-based - Market size and forecast (2023-2028)
      • Chart on PU-based - Market size and forecast (2023-2028) ($ billion)
      • Data Table on PU-based - Market size and forecast (2023-2028) ($ billion)
      • Chart on PU-based - Year-over-year growth (2023-2028) (%)
      • Data Table on PU-based - Year-over-year growth (2023-2028) (%)
    • 6.4 PVC-based - Market size and forecast (2023-2028)
      • Chart on PVC-based - Market size and forecast (2023-2028) ($ billion)
      • Data Table on PVC-based - Market size and forecast (2023-2028) ($ billion)
      • Chart on PVC-based - Year-over-year growth (2023-2028) (%)
      • Data Table on PVC-based - Year-over-year growth (2023-2028) (%)
    • 6.5 Bio-based - Market size and forecast (2023-2028)
      • Chart on Bio-based - Market size and forecast (2023-2028) ($ billion)
      • Data Table on Bio-based - Market size and forecast (2023-2028) ($ billion)
      • Chart on Bio-based - Year-over-year growth (2023-2028) (%)
      • Data Table on Bio-based - Year-over-year growth (2023-2028) (%)
    • 6.6 Market opportunity by Product
      • Market opportunity by Product ($ billion)
      • Data Table on Market opportunity by Product ($ billion)

    7 Market Segmentation by End-user

    • 7.1 Market segments
      • Chart on End-user - Market share (2023-2028) (%)
      • Data Table on End-user - Market share (2023-2028) (%)
    • 7.2 Comparison by End-user
      • Chart on Comparison by End-user
      • Data Table on Comparison by End-user
    • 7.3 Footwear industry - Market size and forecast (2023-2028)
      • Chart on Footwear industry - Market size and forecast (2023-2028) ($ billion)
      • Data Table on Footwear industry - Market size and forecast (2023-2028) ($ billion)
      • Chart on Footwear industry - Year-over-year growth (2023-2028) (%)
      • Data Table on Footwear industry - Year-over-year growth (2023-2028) (%)
    • 7.4 Furnishing industry - Market size and forecast (2023-2028)
      • Chart on Furnishing industry - Market size and forecast (2023-2028) ($ billion)
      • Data Table on Furnishing industry - Market size and forecast (2023-2028) ($ billion)
      • Chart on Furnishing industry - Year-over-year growth (2023-2028) (%)
      • Data Table on Furnishing industry - Year-over-year growth (2023-2028) (%)
    • 7.5 Automotive industry - Market size and forecast (2023-2028)
      • Chart on Automotive industry - Market size and forecast (2023-2028) ($ billion)
      • Data Table on Automotive industry - Market size and forecast (2023-2028) ($ billion)
      • Chart on Automotive industry - Year-over-year growth (2023-2028) (%)
      • Data Table on Automotive industry - Year-over-year growth (2023-2028) (%)
    • 7.6 Bags industry - Market size and forecast (2023-2028)
      • Chart on Bags industry - Market size and forecast (2023-2028) ($ billion)
      • Data Table on Bags industry - Market size and forecast (2023-2028) ($ billion)
      • Chart on Bags industry - Year-over-year growth (2023-2028) (%)
      • Data Table on Bags industry - Year-over-year growth (2023-2028) (%)
    • 7.7 Others - Market size and forecast (2023-2028)
      • Chart on Others - Market size and forecast (2023-2028) ($ billion)
      • Data Table on Others - Market size and forecast (2023-2028) ($ billion)
      • Chart on Others - Year-over-year growth (2023-2028) (%)
      • Data Table on Others - Year-over-year growth (2023-2028) (%)
    • 7.8 Market opportunity by End-user
      • Market opportunity by End-user ($ billion)
      • Data Table on Market opportunity by End-user ($ billion)

    8 Market Segmentation by Application

    • 8.1 Market segments
      • Chart on Application - Market share (2023-2028) (%)
      • Data Table on Application - Market share (2023-2028) (%)
      • Market opportunity by Application ($ billion)
      • Data Table on Market opportunity by Application ($ billion)
    • 8.2 Comparison by Application
      • Chart on Comparison by Application
      • Data Table on Comparison by Application
    • 8.3 Footwear - Market size and forecast (2023-2028)
      • Chart on Footwear - Market size and forecast (2023-2028) ($ billion)
      • Data Table on Footwear - Market size and forecast (2023-2028) ($ billion)
      • Chart on Footwear - Year-over-year growth (2023-2028) (%)
      • Data Table on Footwear - Year-over-year growth (2023-2028) (%)
    • 8.4 Automotive - Market size and forecast (2023-2028)
      • Chart on Automotive - Market size and forecast (2023-2028) ($ billion)
      • Data Table on Automotive - Market size and forecast (2023-2028) ($ billion)
      • Chart on Automotive - Year-over-year growth (2023-2028) (%)
      • Data Table on Automotive - Year-over-year growth (2023-2028) (%)
    • 8.5 Furnishing - Market size and forecast (2023-2028)
      • Chart on Furnishing - Market size and forecast (2023-2028) ($ billion)
      • Data Table on Furnishing - Market size and forecast (2023-2028) ($ billion)
      • Chart on Furnishing - Year-over-year growth (2023-2028) (%)
      • Data Table on Furnishing - Year-over-year growth (2023-2028) (%)
    • 8.6 Clothing - Market size and forecast (2023-2028)
      • Chart on Clothing - Market size and forecast (2023-2028) ($ billion)
      • Data Table on Clothing - Market size and forecast (2023-2028) ($ billion)
      • Chart on Clothing - Year-over-year growth (2023-2028) (%)
      • Data Table on Clothing - Year-over-year growth (2023-2028) (%)
    • 8.7 Bags & Wallets - Market size and forecast (2023-2028)
      • Chart on Bags & Wallets - Market size and forecast (2023-2028) ($ billion)
      • Data Table on Bags & Wallets - Market size and forecast (2023-2028) ($ billion)
      • Chart on Bags & Wallets - Year-over-year growth (2023-2028) (%)
      • Data Table on Bags & Wallets - Year-over-year growth (2023-2028) (%)
    • 8.8 Sports Goods - Market size and forecast (2023-2028)
      • Chart on Sports Goods - Market size and forecast (2023-2028) ($ billion)
      • Data Table on Sports Goods - Market size and forecast (2023-2028) ($ billion)
      • Chart on Sports Goods - Year-over-year growth (2023-2028) (%)
      • Data Table on Sports Goods - Year-over-year growth (2023-2028) (%)
    • 8.9 Other Applications - Market size and forecast (2023-2028)
      • Chart on Other Applications - Market size and forecast (2023-2028) ($ billion)
      • Data Table on Other Applications - Market size and forecast (2023-2028) ($ billion)
      • Chart on Other Applications - Year-over-year growth (2023-2028) (%)
      • Data Table on Other Applications - Year-over-year growth (2023-2028) (%)

    9 Customer Landscape

    • 9.1 Customer landscape overview
      • Analysis of price sensitivity, lifecycle, customer purchase basket, adoption rates, and purchase criteria

    10 Geographic Landscape

    • 10.1 Geographic segmentation
      • Chart on Market share by geography 2023-2028 (%)
      • Data Table on Market share by geography 2023-2028 (%)
    • 10.2 Geographic comparison
      • Chart on Geographic comparison
      • Data Table on Geographic comparison
    • 10.3 APAC - Market size and forecast 2023-2028
      • Chart on APAC - Market size and forecast 2023-2028 ($ billion)
      • Data Table on APAC - Market size and forecast 2023-2028 ($ billion)
      • Chart on APAC - Year-over-year growth 2023-2028 (%)
      • Data Table on APAC - Year-over-year growth 2023-2028 (%)
    • 10.4 North America - Market size and forecast 2023-2028
      • Chart on North America - Market size and forecast 2023-2028 ($ billion)
      • Data Table on North America - Market size and forecast 2023-2028 ($ billion)
      • Chart on North America - Year-over-year growth 2023-2028 (%)
      • Data Table on North America - Year-over-year growth 2023-2028 (%)
    • 10.5 Europe - Market size and forecast 2023-2028
      • Chart on Europe - Market size and forecast 2023-2028 ($ billion)
      • Data Table on Europe - Market size and forecast 2023-2028 ($ billion)
      • Chart on Europe - Year-over-year growth 2023-2028 (%)
      • Data Table on Europe - Year-over-year growth 2023-2028 (%)
    • 10.6 South America - Market size and forecast 2023-2028
      • Chart on South America - Market size and forecast 2023-2028 ($ billion)
      • Data Table on South America - Market size and forecast 2023-2028 ($ billion)
      • Chart on South America - Year-over-year growth 2023-2028 (%)
      • Data Table on South America - Year-over-year growth 2023-2028 (%)
    • 10.7 Middle East and Africa - Market size and forecast 2023-2028
      • Chart on Middle East and Africa - Market size and forecast 2023-2028 ($ billion)
      • Data Table on Middle East and Africa - Market size and forecast 2023-2028 ($ billion)
      • Chart on Middle East and Africa - Year-over-year growth 2023-2028 (%)
      • Data Table on Middle East and Africa - Year-over-year growth 2023-2028 (%)
    • 10.8 China - Market size and forecast 2023-2028
      • Chart on China - Market size and forecast 2023-2028 ($ billion)
      • Data Table on China - Market size and forecast 2023-2028 ($ billion)
      • Chart on China - Year-over-year growth 2023-2028 (%)
      • Data Table on China - Year-over-year growth 2023-2028 (%)
    • 10.9 US - Market size and forecast 2023-2028
      • Chart on US - Market size and forecast 2023-2028 ($ billion)
      • Data Table on US - Market size and forecast 2023-2028 ($ billion)
      • Chart on US - Year-over-year growth 2023-2028 (%)
      • Data Table on US - Year-over-year growth 2023-2028 (%)
    • 10.10 France - Market size and forecast 2023-2028
      • Chart on France - Market size and forecast 2023-2028 ($ billion)
      • Data Table on France - Market size and forecast 2023-2028 ($ billion)
      • Chart on France - Year-over-year growth 2023-2028 (%)
      • Data Table on France - Year-over-year growth 2023-2028 (%)
    • 10.11 Italy - Market size and forecast 2023-2028
      • Chart on Italy - Market size and forecast 2023-2028 ($ billion)
      • Data Table on Italy - Market size and forecast 2023-2028 ($ billion)
      • Chart on Italy - Year-over-year growth 2023-2028 (%)
      • Data Table on Italy - Year-over-year growth 2023-2028 (%)
    • 10.12 Japan - Market size and forecast 2023-2028
      • Chart on Japan - Market size and forecast 2023-2028 ($ billion)
      • Data Table on Japan - Market size and forecast 2023-2028 ($ billion)
      • Chart on Japan - Year-over-year growth 2023-2028 (%)
      • Data Table on Japan - Year-over-year growth 2023-2028 (%)
    • 10.13 Market opportunity by geography
      • Market opportunity by geography ($ billion)
      • Data Tables on Market opportunity by geography ($ billion)
    • 10.14 Canada - Market size and forecast (2023-2028)
      • Chart on Canada - Market size and forecast (2023-2028) ($ billion)
      • Data Table on Canada - Market size and forecast (2023-2028) ($ billion)
      • Chart on Canada - Year-over-year growth (2023-2028) (%)
      • Data Table on Canada - Year-over-year growth (2023-2028) (%)
    • 10.15 Germany - Market size and forecast (2023-2028)
      • Chart on Germany - Market size and forecast (2023-2028) ($ billion)
      • Data Table on Germany - Market size and forecast (2023-2028) ($ billion)
      • Chart on Germany - Year-over-year growth (2023-2028) (%)
      • Data Table on Germany - Year-over-year growth (2023-2028) (%)
    • 10.16 UK - Market size and forecast (2023-2028)
      • Chart on UK - Market size and forecast (2023-2028) ($ billion)
      • Data Table on UK - Market size and forecast (2023-2028) ($ billion)
      • Chart on UK - Year-over-year growth (2023-2028) (%)
      • Data Table on UK - Year-over-year growth (2023-2028) (%)
    • 10.17 India - Market size and forecast (2023-2028)
      • Chart on India - Market size and forecast (2023-2028) ($ billion)
      • Data Table on India - Market size and forecast (2023-2028) ($ billion)
      • Chart on India - Year-over-year growth (2023-2028) (%)
      • Data Table on India - Year-over-year growth (2023-2028) (%)
    • 10.18 Brazil - Market size and forecast (2023-2028)
      • Chart on Brazil - Market size and forecast (2023-2028) ($ billion)
      • Data Table on Brazil - Market size and forecast (2023-2028) ($ billion)
      • Chart on Brazil - Year-over-year growth (2023-2028) (%)
      • Data Table on Brazil - Year-over-year growth (2023-2028) (%)
    • 10.19 Egypt - Market size and forecast (2023-2028)
      • Chart on Egypt - Market size and forecast (2023-2028) ($ billion)
      • Data Table on Egypt - Market size and forecast (2023-2028) ($ billion)
      • Chart on Egypt - Year-over-year growth (2023-2028) (%)
      • Data Table on Egypt - Year-over-year growth (2023-2028) (%)
    • 10.20 UAE - Market size and forecast (2023-2028)
      • Chart on UAE - Market size and forecast (2023-2028) ($ billion)
      • Data Table on UAE - Market size and forecast (2023-2028) ($ billion)
      • Chart on UAE - Year-over-year growth (2023-2028) (%)
      • Data Table on UAE - Year-over-year growth (2023-2028) (%)
    • 10.21 Oman - Market size and forecast (2023-2028)
      • Chart on Oman - Market size and forecast (2023-2028) ($ billion)
      • Data Table on Oman - Market size and forecast (2023-2028) ($ billion)
      • Chart on Oman - Year-over-year growth (2023-2028) (%)
      • Data Table on Oman - Year-over-year growth (2023-2028) (%)
    • 10.22 Argentina - Market size and forecast (2023-2028)
      • Chart on Argentina - Market size and forecast (2023-2028) ($ billion)
      • Data Table on Argentina - Market size and forecast (2023-2028) ($ billion)
      • Chart on Argentina - Year-over-year growth (2023-2028) (%)
      • Data Table on Argentina - Year-over-year growth (2023-2028) (%)
    • 10.23 KSA - Market size and forecast (2023-2028)
      • Chart on KSA - Market size and forecast (2023-2028) ($ billion)
      • Data Table on KSA - Market size and forecast (2023-2028) ($ billion)
      • Chart on KSA - Year-over-year growth (2023-2028) (%)
      • Data Table on KSA - Year-over-year growth (2023-2028) (%)
    • 10.24 Rest of World (ROW) - Market size and forecast (2023-2028)
      • Chart on Rest of World (ROW) - Market size and forecast (2023-2028) ($ billion)
      • Data Table on Rest of World (ROW) - Market size and forecast (2023-2028) ($ billion)
      • Chart on Rest of World (ROW) - Year-over-year growth (2023-2028) (%)
      • Data Table on Rest of World (ROW) - Year-over-year growth (2023-2028) (%)

    11 Drivers, Challenges, and Opportunity/Restraints

    • 11.1 Market drivers
      • 11.2 Market challenges
        • 11.3 Impact of drivers and challenges
          • Impact of drivers and challenges in 2023 and 2028
        • 11.4 Market opportunities/restraints

          12 Competitive Landscape

          • 12.1 Overview
            • 12.2 Competitive Landscape
              • Overview on criticality of inputs and factors of differentiation
            • 12.3 Landscape disruption
              • Overview on factors of disruption
            • 12.4 Industry risks
              • Impact of key risks on business

            13 Competitive Analysis

            • 13.1 Companies profiled
              • Companies covered
            • 13.2 Market positioning of companies
              • Matrix on companies position and classification
            • 13.3 AIR WATER INC.
              • AIR WATER INC. - Overview
              • AIR WATER INC. - Business segments
              • AIR WATER INC. - Key offerings
              • AIR WATER INC. - Segment focus
            • 13.4 Alfatex Italia Srl
              • Alfatex Italia Srl - Overview
              • Alfatex Italia Srl - Product / Service
              • Alfatex Italia Srl - Key offerings
            • 13.5 Anhui Anli Material Technology Co. Ltd.
              • Anhui Anli Material Technology Co. Ltd. - Overview
              • Anhui Anli Material Technology Co. Ltd. - Product / Service
              • Anhui Anli Material Technology Co. Ltd. - Key offerings
            • 13.6 Asahi Kasei Corp.
              • Asahi Kasei Corp. - Overview
              • Asahi Kasei Corp. - Business segments
              • Asahi Kasei Corp. - Key news
              • Asahi Kasei Corp. - Key offerings
              • Asahi Kasei Corp. - Segment focus
            • 13.7 KURARAY Co. Ltd.
              • KURARAY Co. Ltd. - Overview
              • KURARAY Co. Ltd. - Business segments
              • KURARAY Co. Ltd. - Key news
              • KURARAY Co. Ltd. - Key offerings
              • KURARAY Co. Ltd. - Segment focus
            • 13.8 Lederplast Spa
              • Lederplast Spa - Overview
              • Lederplast Spa - Product / Service
              • Lederplast Spa - Key offerings
            • 13.9 Marvel Vinyls Ltd.
              • Marvel Vinyls Ltd. - Overview
              • Marvel Vinyls Ltd. - Product / Service
              • Marvel Vinyls Ltd. - Key offerings
            • 13.10 Mayur Uniquoters Ltd.
              • Mayur Uniquoters Ltd. - Overview
              • Mayur Uniquoters Ltd. - Product / Service
              • Mayur Uniquoters Ltd. - Key offerings
            • 13.11 Nan Ya Plastic Corp.
              • Nan Ya Plastic Corp. - Overview
              • Nan Ya Plastic Corp. - Business segments
              • Nan Ya Plastic Corp. - Key offerings
              • Nan Ya Plastic Corp. - Segment focus
            • 13.12 San Fang Chemical Industrial Co. Ltd.
              • San Fang Chemical Industrial Co. Ltd. - Overview
              • San Fang Chemical Industrial Co. Ltd. - Product / Service
              • San Fang Chemical Industrial Co. Ltd. - Key offerings
            • 13.13 Teijin Ltd.
              • Teijin Ltd. - Overview
              • Teijin Ltd. - Business segments
              • Teijin Ltd. - Key news
              • Teijin Ltd. - Key offerings
              • Teijin Ltd. - Segment focus
            • 13.14 Toray Industries Inc.
              • Toray Industries Inc. - Overview
              • Toray Industries Inc. - Business segments
              • Toray Industries Inc. - Key news
              • Toray Industries Inc. - Key offerings
              • Toray Industries Inc. - Segment focus
            • 13.15 Uniroyal Global Engineered Products Inc.
              • Uniroyal Global Engineered Products Inc. - Overview
              • Uniroyal Global Engineered Products Inc. - Product / Service
              • Uniroyal Global Engineered Products Inc. - Key offerings
            • 13.16 Zhejiang Hexin Industry Group Co. Ltd.
              • Zhejiang Hexin Industry Group Co. Ltd. - Overview
              • Zhejiang Hexin Industry Group Co. Ltd. - Product / Service
              • Zhejiang Hexin Industry Group Co. Ltd. - Key offerings
            • 13.17 Zhejiang Yongfa Synthetic Leather Co. Ltd.
              • Zhejiang Yongfa Synthetic Leather Co. Ltd. - Overview
              • Zhejiang Yongfa Synthetic Leather Co. Ltd. - Product / Service
              • Zhejiang Yongfa Synthetic Leather Co. Ltd. - Key offerings

            14 Appendix

            • 14.1 Scope of the report
              • 14.2 Inclusions and exclusions checklist
                • Inclusions checklist
                • Exclusions checklist
              • 14.3 Currency conversion rates for US$
                • Currency conversion rates for US$
              • 14.4 Research methodology
                • Research methodology
              • 14.5 Data procurement
                • Information sources
              • 14.6 Data validation
                • Data validation
              • 14.7 Validation techniques employed for market sizing
                • Validation techniques employed for market sizing
              • 14.8 Data synthesis
                • Data synthesis
              • 14.9 360 degree market analysis
                • 360 degree market analysis
              • 14.10 List of abbreviations
                • List of abbreviations

              Research Methodology

              Technavio presents a detailed picture of the market by way of study, synthesis, and summation of data from multiple sources. The analysts have presented the various facets of the market with a particular focus on identifying the key industry influencers. The data thus presented is comprehensive, reliable, and the result of extensive research, both primary and secondary.

              INFORMATION SOURCES

              Primary sources

              • Manufacturers and suppliers
              • Channel partners
              • Industry experts
              • Strategic decision makers

              Secondary sources

              • Industry journals and periodicals
              • Government data
              • Financial reports of key industry players
              • Historical data
              • Press releases

              DATA ANALYSIS

              Data Synthesis

              • Collation of data
              • Estimation of key figures
              • Analysis of derived insights

              Data Validation

              • Triangulation with data models
              • Reference against proprietary databases
              • Corroboration with industry experts

              REPORT WRITING

              Qualitative

              • Market drivers
              • Market challenges
              • Market trends
              • Five forces analysis

              Quantitative

              • Market size and forecast
              • Market segmentation
              • Geographical insights
              • Competitive landscape

              Interested in this report?

              Get your sample now to see our research methodology and insights!

              Download Now

              Frequently Asked Questions

              Synthetic Leather market growth will increase by $ 25.3 bn during 2024-2028.

              The Synthetic Leather market is expected to grow at a CAGR of 9.42% during 2024-2028.

              Synthetic Leather market is segmented by Product( PU-based, PVC-based, Bio-based) End-user( Footwear industry, Furnishing industry, Automotive industry, Bags industry, Others)

              AIR WATER INC., Akea Srl, Alfatex Italia Srl, Anhui Anli Material Technology Co. Ltd., Asahi Kasei Corp., Colence Pvt. Ltd., H.R. Polycoats Pvt. Ltd., Kolon Industries Inc., KURARAY Co. Ltd., Lederplast Spa, Marvel Vinyls Ltd., Mayur Uniquoters Ltd., Nan Ya Plastic Corp., San Fang Chemical Industrial Co. Ltd., Teijin Ltd., Toray Industries Inc., Uniroyal Global Engineered Products Inc., Winner Nippon Leatherette Pvt. Ltd., Zhejiang Hexin Industry Group Co. Ltd., Zhejiang Yongfa Synthetic Leather Co. Ltd. are a few of the key vendors in the Synthetic Leather market.

              APAC will register the highest growth rate of 57% among the other regions. Therefore, the Synthetic Leather market in APAC is expected to garner significant business opportunities for the vendors during the forecast period.

              US, Canada, Germany, UK, Italy, France, China, India, Japan, Brazil, Egypt, UAE, Oman, Argentina, KSA, UAE, Brazil, Rest of World (ROW)

              • High demand from developing economiesThere is a high demand for synthetic leather in emerging economies such as China is the driving factor this market.
              • India is the driving factor this market.
              • Brazil is the driving factor this market.
              • South Africa is the driving factor this market.
              • and Indonesia is the driving factor this market.
              • primarily due to its application in industries such as apparel is the driving factor this market.
              • bags is the driving factor this market.
              • and footwear. China is the major contributor to the global synthetic leather market is the driving factor this market.
              • led by the high demand from consumer product manufacturing industries. The rapid growth of industries such as automotive is the driving factor this market.
              • footwear is the driving factor this market.
              • and bags is the driving factor this market.
              • which is driven by rising disposable income and increasing economic activities in emerging markets such as China is the driving factor this market.
              • is boosting the demand for synthetic leather. For instance is the driving factor this market.
              • according to the National Bureau of Statistics of China is the driving factor this market.
              • in 2022 is the driving factor this market.
              • the per capita disposable income of urban residents increased by 3.9% (unless otherwise specified below is the driving factor this market.
              • it was a year-on-year nominal increase) is the driving factor this market.
              • and the actual increase was 1.9% after deducting price factors. The per capita disposable income of rural residents increased by 6.3% is the driving factor this market.
              • and the actual increase after deducting price factors was 4.2%. This growth in disposable income is fueling the repeat purchase of fashion products such as apparel is the driving factor this market.
              • footwear is the driving factor this market.
              • and bags is the driving factor this market.
              • as well as automotive accessories is the driving factor this market.
              • including seat covers and steering covers. This will consecutively drive the demand for synthetic leather in China. Trends such as the increasing need for high productivity to cater to the demands of the growing population are expected to fuel the global synthetic leather market. Furthermore is the driving factor this market.
              • rapid industrialization in economies such as Brazil is the driving factor this market.
              • Russia is the driving factor this market.
              • India is the driving factor this market.
              • China is the driving factor this market.
              • and South Africa (BRICS) is creating considerable demand for synthetic leather. Growing investments in the manufacturing sector is the driving factor this market.
              • which includes manufacturers from industries in developing countries is the driving factor this market.
              • are increasing the consumption of synthetic leather. Hence is the driving factor this market.
              • rapid industrialization is expected to drive the demand for synthetic leather during the forecast period. Other regions is the driving factor this market.
              • such as South America and MEA is the driving factor this market.
              • are witnessing growth in manufacturing activities is the driving factor this market.
              • particularly in the consumer products sector. Synthetic leather is used in different manufacturing sectors; therefore is the driving factor this market.
              • the synthetic leather market in emerging countries has high growth potential during the forecast period. is the driving factor this market.

              The Synthetic Leather market vendors should focus on grabbing business opportunities from the PU-based segment as it accounted for the largest market share in the base year.