
Systemic Mastocytosis Treatment Market Size 2025-2029
The systemic mastocytosis treatment market size is forecast to increase by USD 173.8 million at a CAGR of 6.5% between 2024 and 2029.
- The market is experiencing significant growth due to the increasing aging population, as this demographic is more susceptible to developing the disease. Advancements in diagnostic technologies are also driving market expansion, enabling earlier detection and more effective management of systemic mastocytosis. However, the high cost associated with treatment poses a substantial challenge for both patients and healthcare systems. Pharmaceutical companies seeking to capitalize on this market must address affordability concerns while continuing to invest in research and development to improve treatment efficacy and patient outcomes.
- Navigating this complex landscape requires a deep understanding of the evolving diagnostic landscape and the ability to offer cost-effective, innovative solutions. Companies that successfully address these challenges will be well-positioned to capture market share and drive growth in the market. Healthcare providers and patient education are integral components of effective systemic mastocytosis management. Molecular biology and diagnostic imaging provide valuable insights into the disease and its progression.
What will be the Size of the Systemic Mastocytosis Treatment Market during the forecast period?

Explore in-depth regional segment analysis with market size data - historical 2019-2023 and forecasts 2025-2029 - in the full report.
Request Free Sample
- In the market, healthcare economics plays a significant role in shaping clinical practice and research. Network analysis of treatment guidelines reveals intricate relationships between various therapeutic approaches and clinical outcomes. Scientific publications and medical journals serve as vital resources for staying informed about the latest clinical research and advancements in drug development. Cytokine release and regulatory approval are critical factors influencing treatment decisions and patient outcomes. Research funding and data mining are essential for driving innovation and improving survival rates. Systems biology and statistical modeling contribute to a deeper understanding of disease mechanisms and prognostic factors.
- Radiation therapy and patient outcomes are subjects of ongoing investigation, with the potential to expand treatment options. Public health initiatives aim to address the disease burden and improve overall patient care. Clinical practice and healthcare policy are interconnected, with data analysis and policy decisions shaping the future of systemic mastocytosis treatment. Monoclonal antibodies and other novel therapies hold promise for enhancing treatment efficacy and patient quality of life. The dynamic interplay between these factors underscores the complexity and evolving nature of the systemic mastocytosis treatment landscape.
How is this Systemic Mastocytosis Treatment Industry segmented?
The systemic mastocytosis treatment industry research report provides comprehensive data (region-wise segment analysis), with forecasts and estimates in "USD million" for the period 2025-2029, as well as historical data from 2019-2023 for the following segments.
- Type
- AK-002
- BLU-285
- Brentuximab vedotin
- Crenolanib besylate
- Others
- Route Of Administration
- Oral
- Injectables
- Topical
- End-user
- Hospitals
- Specialty clinics
- Research and academic institutes
- Others
- Geography
- North America
- US
- Canada
- Mexico
- Europe
- France
- Germany
- Italy
- UK
- APAC
- China
- India
- Japan
- Rest of World (ROW)
- North America
By Type Insights
The AK-002 segment is estimated to witness significant growth during the forecast period. The market encompasses various therapeutic approaches, with a notable advancement being the monoclonal antibody therapy, AK-002 (lirentelimab). This therapy specifically binds to CD117, a cell surface receptor essential for mast cell growth and activation. The abnormal activation of CD117, also known as c-Kit, contributes to the overproduction and accumulation of mast cells, leading to symptoms such as skin lesions, gastrointestinal issues, and anaphylactic reactions. AK-002 inhibits CD117, thereby reducing mast cell proliferation and activation, which aims to alleviate symptoms and enhance patients' quality of life. This targeted therapy also considers disease mechanisms, including genetic predisposition and environmental factors, which can influence disease progression.
Clinical trials, bone marrow transplantation, and stem cell transplantation are ongoing to further explore the potential of AK-002. Additionally, diagnostic tools like flow cytometry, peripheral blood smear analysis, and bone marrow biopsy aid in early diagnosis. Other treatment options include targeted therapies like tyrosine kinase inhibitors and leukotriene inhibitors, as well as symptom management strategies. Patient support groups and longitudinal studies play a crucial role in disease awareness and understanding. Adverse effects, drug interactions, and disease mechanisms continue to be areas of research interest. Overall, the market is evolving, with a focus on personalized medicine and improving patient outcomes.
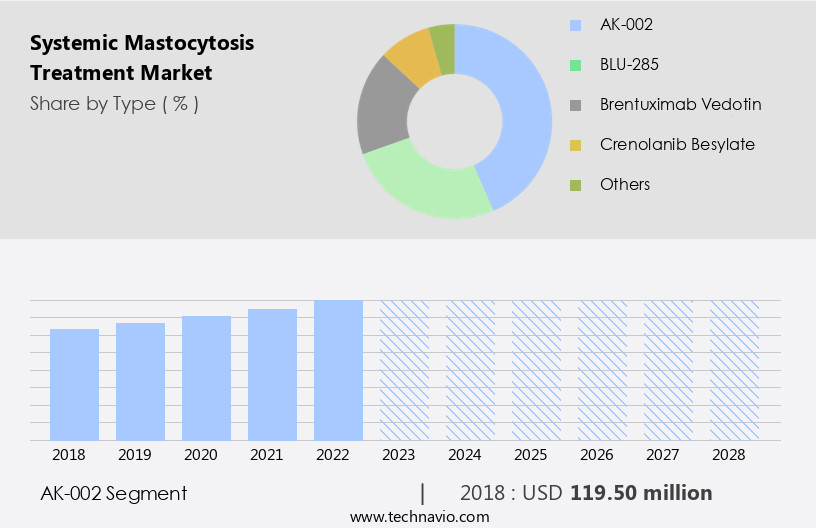
The AK-002 segment was valued at USD 126.20 million in 2019 and showed a gradual increase during the forecast period.
Regional Analysis
North America is estimated to contribute 44% to the growth of the global market during the forecast period. Technavio's analysts have elaborately explained the regional trends and drivers that shape the market during the forecast period.
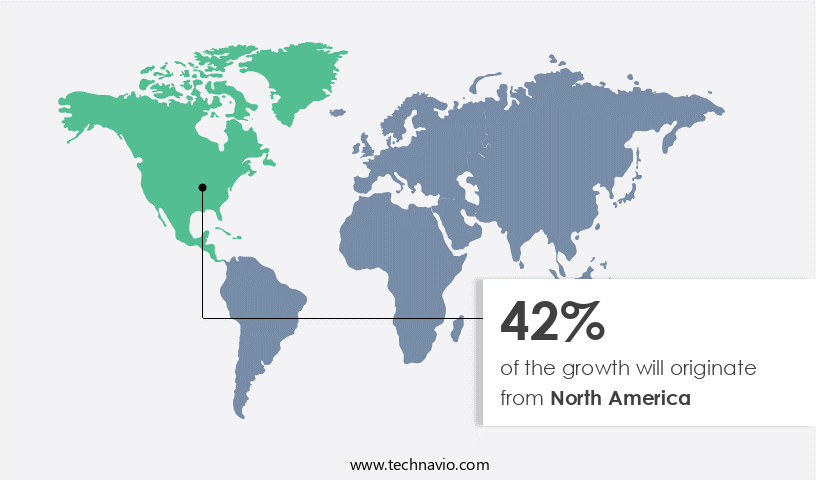
The market in North America is experiencing notable growth due to several factors. The aging population, estimated to reach 82 million by 2050, is a significant driver. Older adults, who make up 17% of the population currently, are more susceptible to various health conditions, including systemic mastocytosis. This demographic shift is accompanied by increasing healthcare expenditure, further fueling market expansion. Advancements in treatment modalities, such as targeted therapy, bone marrow transplantation, and stem cell transplantation, offer promising solutions for patients. However, these treatments come with potential drug interactions and adverse effects, necessitating rigorous clinical trials and genetic testing for personalized medicine.
Skin lesions and bone pain are common symptoms, impacting patients' quality of life. Molecular biology and flow cytometry are essential tools in diagnosing and monitoring disease progression, while patient support groups and longitudinal studies facilitate disease awareness and treatment response. Environmental factors and disease mechanisms, including genetic predisposition and mast cell degranulation, are crucial areas of ongoing research. Early diagnosis through diagnostic imaging and peripheral blood smear analysis is essential for effective symptom management. Leukotriene inhibitors are among the treatments used to manage symptoms, while tyrosine kinase inhibitors represent a promising therapeutic approach. Disease awareness and symptom management are crucial for improving patient outcomes and overall quality of life.
Market Dynamics
Our researchers analyzed the data with 2024 as the base year, along with the key drivers, trends, and challenges. A holistic analysis of drivers will help companies refine their marketing strategies to gain a competitive advantage.
What are the Systemic Mastocytosis Treatment market drivers leading to the rise in the adoption of Industry?
- The aging population's growth serves as the primary catalyst for market expansion. The market is experiencing significant growth due to the increasing aging population worldwide. According to the World Health Organization (WHO), the global population aged 60 years and above is projected to nearly double by 2050, rising from 12% in 2015 to 22%. This demographic shift is particularly notable in Asian countries such as China, India, and Indonesia, as well as in North American countries including the US, Canada, and Mexico. The disease, characterized by the overproduction and abnormal function of mast cells, can result in symptoms such as bone pain, itching, and flushing. Targeted therapies, including those based on molecular biology and flow cytometry, are increasingly being used to improve treatment response.
- Environmental factors and disease progression are key considerations in the development of new treatments. Longitudinal studies are essential to understanding the disease's natural history and evaluating the effectiveness of various treatment approaches. The market dynamics are driven by the increasing prevalence of systemic mastocytosis, advances in molecular biology and targeted therapies, and the growing geriatric population. The market is witnessing significant growth with the integration of gene therapy and biotech advancements, offering innovative treatments that target the genetic mutations associated with these tumors and improving patient outcomes.
What are the Systemic Mastocytosis Treatment market trends shaping the Industry?
- The trend in systemic mastocytosis management is centered around advancements in diagnostic technologies. These innovations play a crucial role in enhancing diagnostic accuracy and facilitating early intervention. The market is experiencing notable progress, with diagnostic technologies playing a crucial role in transforming disease management. Genetic testing is a key diagnostic tool, particularly in identifying KIT mutations, which are common in systemic mastocytosis. The detection of specific genetic abnormalities, such as KIT D816V mutations, is essential for accurate diagnosis. This advancement facilitates personalized treatment approaches, enabling a deeper understanding of disease progression and prognosis.
- Patient support groups and healthcare professionals collaborate to ensure early diagnosis and appropriate management of this complex disease. Bone marrow biopsy and diagnostic imaging continue to be essential diagnostic tools, complementing genetic testing in the diagnostic process. Overall, the integration of these advanced diagnostic technologies is revolutionizing the systemic mastocytosis treatment landscape. Moreover, the integration of advanced diagnostic technologies has expanded the identification of mutational profiles beyond KIT D816V mutations. This comprehensive genomic understanding of systemic mastocytosis is vital in guiding the development of targeted therapies and refining prognostic assessments.
How does Systemic Mastocytosis Treatment market face challenges during its growth?
- The high cost of treating systemic mastocytosis represents a significant challenge to the industry's growth trajectory. Systemic mastocytosis, a complex and often chronic condition, requires extensive and costly therapies to manage its symptoms effectively. This financial burden poses a significant hurdle for both patients and healthcare systems, potentially limiting access to necessary treatments and hindering the industry's expansion. The market is characterized by the high cost of managing this complex condition. Diagnostic procedures, including peripheral blood smear analysis and genetic and molecular testing, are essential for accurate diagnosis and personalized treatment. These tests can be costly, contributing to the overall expense of care.
- The individualized nature of systemic mastocytosis management necessitates extensive testing and the use of specialized care, making cost containment a critical concern. Symptom management remains a priority in the absence of a cure, necessitating ongoing care and treatment. Disease awareness and education efforts are essential to improve patient outcomes and reduce the financial burden on individuals and healthcare systems. The use of advanced therapeutic modalities, such as leukotriene inhibitors and targeted therapies like tyrosine kinase inhibitors (TKIs) and monoclonal antibodies, further increases the financial burden. While these novel agents offer promising treatment options, their high price tags make them a significant challenge for patients and healthcare systems. For instance, midostaurin, a TKI used at a standard dose of 100 mg twice daily, carries an annual cost of approximately USD 192,000.
Exclusive Customer Landscape
The systemic mastocytosis treatment market forecasting report includes the adoption lifecycle of the market, covering from the innovator's stage to the laggard's stage. It focuses on adoption rates in different regions based on penetration. Furthermore, the systemic mastocytosis treatment market report also includes key purchase criteria and drivers of price sensitivity to help companies evaluate and develop their market growth analysis strategies.

Customer Landscape
Key Companies & Market Insights
Companies are implementing various strategies, such as strategic alliances, systemic mastocytosis treatment market forecast, partnerships, mergers and acquisitions, geographical expansion, and product/service launches, to enhance their presence in the industry.
AB Science SA - The company specializes in Systemic Mastocytosis Treatment and is currently developing masitinib, a late-stage clinical trial candidate targeting tyrosine kinase inhibition for advanced systemic mastocytosis treatment.
The industry research and growth report includes detailed analyses of the competitive landscape of the market and information about key companies, including:
- AB Science SA
- AdvaCare Pharma
- Cogent Biosciences, Inc.
- Dr Reddys Laboratories Ltd.
- Glenmark Pharmaceuticals Ltd.
- Lupin Ltd.
- Novartis AG
- Pfizer Inc.
- Sanofi SA
Qualitative and quantitative analysis of companies has been conducted to help clients understand the wider business environment as well as the strengths and weaknesses of key industry players. Data is qualitatively analyzed to categorize companies as pure play, category-focused, industry-focused, and diversified; it is quantitatively analyzed to categorize companies as dominant, leading, strong, tentative, and weak.
Recent Development and News in Systemic Mastocytosis Treatment Market
- In January 2024, Novartis AG announced the approval of Maspan® (midostaurin) tablets in the European Union for the treatment of adult patients with aggressive systemic mastocytosis (ASM), a rare and often life-threatening disease. Maspan® is the first and only approved treatment for ASM in Europe (Novartis AG press release, 2024).
- In March 2024, Incyte Corporation and The Leukemia & Lymphoma Society (LLS) announced a strategic collaboration to advance research in systemic mastocytosis. The partnership aimed to accelerate the development of new treatments for this rare disease (Incyte Corporation press release, 2024).
- In May 2024, Roche Holding AG received approval from the U.S. Food and Drug Administration (FDA) for the expanded indication of its medication, Sprycel® (dasatinib), for the treatment of adult patients with advanced systemic mastocytosis (Roche Holding AG press release, 2024).
- In April 2025, Sanofi and Regeneron Pharmaceuticals, Inc. announced the initiation of a Phase 3 clinical trial for their monoclonal antibody, Dupilumab, in combination with JAK inhibitor, Ruxolitinib, for the treatment of systemic mastocytosis. The trial, named MAST-1, is expected to enroll approximately 150 patients (Sanofi press release, 2025).
Research Analyst Overview
The market is a dynamic and evolving landscape, characterized by ongoing research and development in various sectors. Patient support groups play a crucial role in raising disease awareness and advocating for improved diagnostic tools and effective treatments. Systemic mastocytosis, a complex disease with diverse manifestations, is driven by genetic predisposition and environmental factors. Diagnostic tools, such as bone marrow biopsy and diagnostic imaging, continue to advance, enabling earlier identification of the disease. Tyrosine kinase inhibitors have emerged as a promising therapeutic option, targeting the underlying disease mechanisms. However, the complex nature of systemic mastocytosis necessitates a personalized approach to treatment, taking into account individual genetic predispositions and disease progression.
Molecular biology and flow cytometry are essential in understanding the disease mechanisms and monitoring treatment response. Skin lesions and bone pain are common symptoms, requiring effective symptom management strategies. Leukotriene inhibitors and targeted therapy offer potential solutions to mitigate these symptoms. Continuous research and longitudinal studies are essential to unraveling the intricacies of systemic mastocytosis and improving patient outcomes. The market dynamics are shaped by ongoing clinical trials, exploring new treatment modalities and drug interactions. The ultimate goal is to provide effective, safe, and personalized treatment options for patients, enhancing their quality of life.
Dive into Technavio's robust research methodology, blending expert interviews, extensive data synthesis, and validated models for unparalleled Systemic Mastocytosis Treatment Market insights. See full methodology.
|
Market Scope |
|
|
Report Coverage |
Details |
|
Page number |
214 |
|
Base year |
2024 |
|
Historic period |
2019-2023 |
|
Forecast period |
2025-2029 |
|
Growth momentum & CAGR |
Accelerate at a CAGR of 6.5% |
|
Market growth 2025-2029 |
USD 173.8 million |
|
Market structure |
Concentrated |
|
YoY growth 2024-2025(%) |
6.1 |
|
Key countries |
US, China, Canada, Germany, UK, Japan, France, Mexico, Italy, and India |
|
Competitive landscape |
Leading Companies, Market Positioning of Companies, Competitive Strategies, and Industry Risks |
What are the Key Data Covered in this Systemic Mastocytosis Treatment Market Research and Growth Report?
- CAGR of the Systemic Mastocytosis Treatment industry during the forecast period
- Detailed information on factors that will drive the growth and forecasting between 2025 and 2029
- Precise estimation of the size of the market and its contribution of the industry in focus to the parent market
- Accurate predictions about upcoming growth and trends and changes in consumer behaviour
- Growth of the market across North America, Europe, Asia, and Rest of World (ROW)
- Thorough analysis of the market's competitive landscape and detailed information about companies
- Comprehensive analysis of factors that will challenge the systemic mastocytosis treatment market growth of industry companies
We can help! Our analysts can customize this systemic mastocytosis treatment market research report to meet your requirements.