India Tableware Market Size 2025-2029
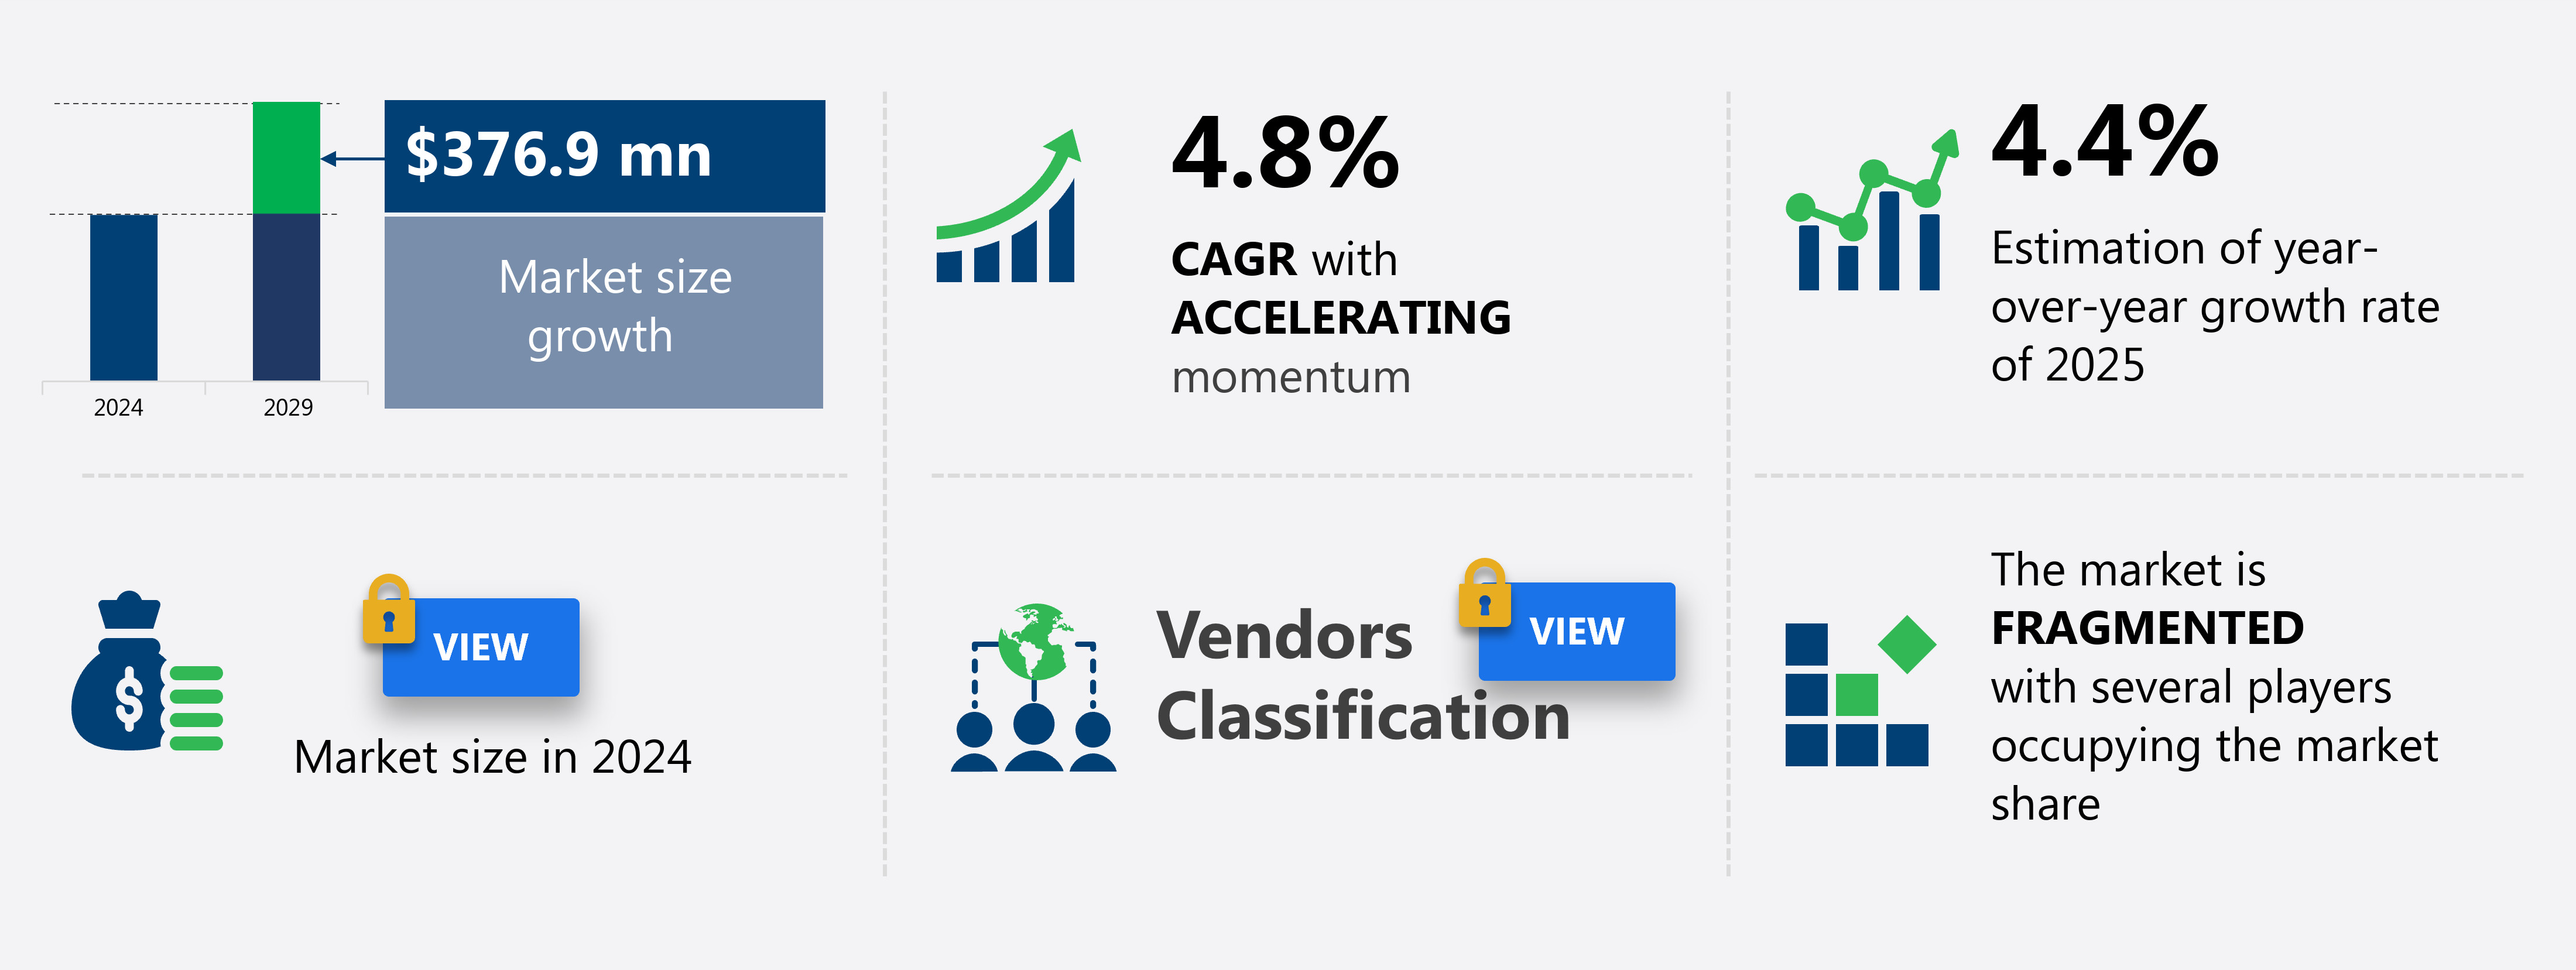
The India tableware market size is forecast to increase by USD 376.9 million at a CAGR of 4.8% between 2024 and 2029.
- The market is experiencing significant growth, driven by the increasing number of households and the rising trend of consumers preferring high-quality tableware for their homes. Additionally, market players are embracing the omnichannel strategy, incorporating smartphones and innovative packaging solutions to cater to the diverse needs of consumers, providing them with a seamless shopping experience. However, the market faces challenges from unorganized players who offer lower prices, posing a threat to the market's growth. Despite these challenges, the tableware market is expected to continue its growth trajectory, driven by consumer preferences for durability, design, and functionality. Companies that can effectively address these trends and challenges while providing competitive pricing and quality products will thrive in this market.
What will be the Size of the market During the Forecast Period?
- The market encompasses the production and distribution of dishes, glasses, and utensils for use in various settings, including residential and commercial. This market exhibits steady growth, driven by increasing consumer demand for aesthetically pleasing and functional tableware. Trends In the industry include the integration of technology, such as augmented reality and speech recognition, to enhance the dining experience. Health-conscious consumers are also driving demand for tableware that caters to their wellness needs, such as those designed to promote healthy eating habits or monitor sleep patterns and exercise.
- Safety concerns have led to the development of tableware with reduced health risks, such as lead-free and BPA-free options. Coexistence testing ensures the compatibility of new tableware designs with existing table settings. The tableware market's evolution can be traced back to ancient civilizations, with influences from various cultures throughout history. Despite advancements in technology, the fundamental purpose of tableware remains the same: to provide a functional and enjoyable dining experience.
How is this market segmented and which is the largest segment?
The market research report provides comprehensive data (region-wise segment analysis), with forecasts and estimates in "USD million" for the period 2025-2029, as well as historical data from 2019-2023 for the following segments.
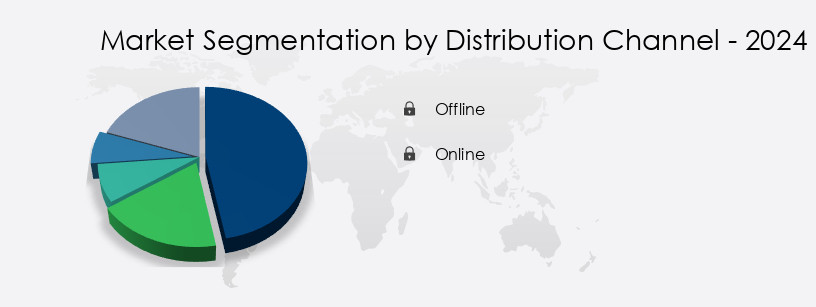
- Distribution Channel
- Offline
- Online
- Product
- Metalware
- Ceramicware
- Glassware
- Others
- End-user
- Residential
- Commercial
- Geography
- India
By Distribution Channel Insights
- The offline segment is estimated to witness significant growth during the forecast period.
The market primarily consists of offline and online distribution channels. Offline retailers, including shops and department stores, held a significant market share in 2024 due to their extensive product portfolios and the ability to offer a tangible shopping experience. Department stores, hypermarkets, and supermarkets are the largest distribution channels, as they provide consumers with a wide range of options, closer product evaluation, and expert assistance. Consumers prefer these establishments for their comprehensive tableware offerings and the support they offer during the purchasing process.
Get a glance at the market report of share of various segments Request Free Sample
Market Dynamics
Our market researchers analyzed the data with 2024 as the base year, along with the key drivers, trends, and challenges. A holistic analysis of drivers will help companies refine their marketing strategies to gain a competitive advantage.
What are the key market drivers leading to the rise in the adoption of India Tableware Market?
Increasing number of households is the key driver of the market.
- Tableware market growth is driven by the expansion of households in India, which is projected to house the third-largest number of high-income households worldwide by 2030. Residential construction activities are on the rise due to government support through initiatives like the Pradhan Mantri Awas Yojana (PMAY), aimed at providing affordable housing to urban poor through financial assistance. This trend is expected to fuel the demand for tableware products. The human-computer interaction technology industry, including wearable devices such as smartwatches and jewelry with integrated technology, is also experiencing significant growth. Wearable technology, including devices like smartwatches with features such as speech recognition, virtual reality, and augmented reality, is becoming increasingly popular.
- Wearable devices like Google Glass, pain management devices, and vibrating bracelets offer health benefits, including tracking sleep patterns, exercise, heart rate, and weight. However, concerns regarding bulkiness, display heat, fire hazards, and safety health risks necessitate coexistence testing. The history of tableware evolution includes the abacus, WW1 cameras, pigeon posts, calculator watches, portable radios, Walkman, wrist computers, video games, cell phones, sneaker phones, and reminders. The future of tableware lies In the integration of technology, including augmented memory technology, sound shirts, portable translators, and body cameras with GPS for personal tasks and daily workloads.
What are the market trends shaping the India Tableware Market?
The growing use of omnichannel strategy by market companies is the upcoming trend In the market.
- The tableware market has experienced significant shifts in recent years, with the rise of e-commerce platforms driving increased accessibility for consumers. Ceramic tableware, in particular, has seen a rise in demand, leading manufacturers to sell their products exclusively online to broaden their reach. As the market becomes increasingly competitive, companies are exploring innovative ways to enhance their service delivery and differentiate themselves. In the coming years, it is anticipated that more organizations will distribute and sell their tableware through various e-commerce channels to cater to a wider consumer base. This trend is expected to continue as technology advances and human-computer interaction becomes more integrated into daily life.
- While tableware itself may not be subject to the latest technological innovations, the way it is marketed and sold is evolving rapidly. From Wrist Watches to Necklaces and Lanyards, devices such as Google Glass and wearable technology are blurring the lines between fashion and function. Augmented reality and virtual reality are also transforming industries like healthcare, military, policing, and personal tasks, offering new opportunities for tableware manufacturers to explore. As technology continues to advance, manufacturers need to stay informed about the latest trends and consumer preferences to remain competitive In the market. While the history of tableware dates back to ancient civilizations, its evolution has been marked by significant advancements in technology.
What challenges does India Tableware Market face during the growth?
Threat from unorganized market players is a key challenge affecting the market growth.
- The market experiences intense competition from both global and regional players, as well as unorganized manufacturers, particularly those based in China. The latter significantly impacts the market revenue due to their abundant raw materials and low-cost production. Unorganized Chinese players dominate the market's low-end product segment, offering prices below competitive standards. Technological advancements, such as augmented reality (AR) and virtual reality (VR) devices, have started influencing the tableware industry. Wearable technology, including smartwatches and fitness trackers, has gained popularity among consumers for its health monitoring features. Devices like Google Glass, Quell pain management devices, and Ringly offer notifications for personal tasks, daily workloads, and health metrics, such as sleep patterns, exercise, heart rate, and weight.
- However, the adoption of these advanced technologies in tableware is limited due to concerns over bulkiness, display heat, fire hazards, and health risks. Coexistence testing is crucial to ensure the safe and efficient operation of these devices alongside traditional tableware. The history of tableware evolution includes the abacus, cameras, calculator watches, portable radios, Walkman, wrist computers, video game watches, cell phones, sneaker phones, and reminders. Today, tableware is not just a necessity but also a fashion statement, with jewelry-like lanyards, necklaces, and wristwatches becoming popular accessories. Clothing items like sound shirts and vibrating bracelets further integrate technology into daily life.
Exclusive Customer Landscape
The market forecasting report includes the adoption lifecycle of the market, covering from the innovator's stage to the laggard's stage. It focuses on adoption rates in different regions based on penetration. Furthermore, the market report also includes key purchase criteria and drivers of price sensitivity to help companies evaluate and develop their market growth analysis strategies.
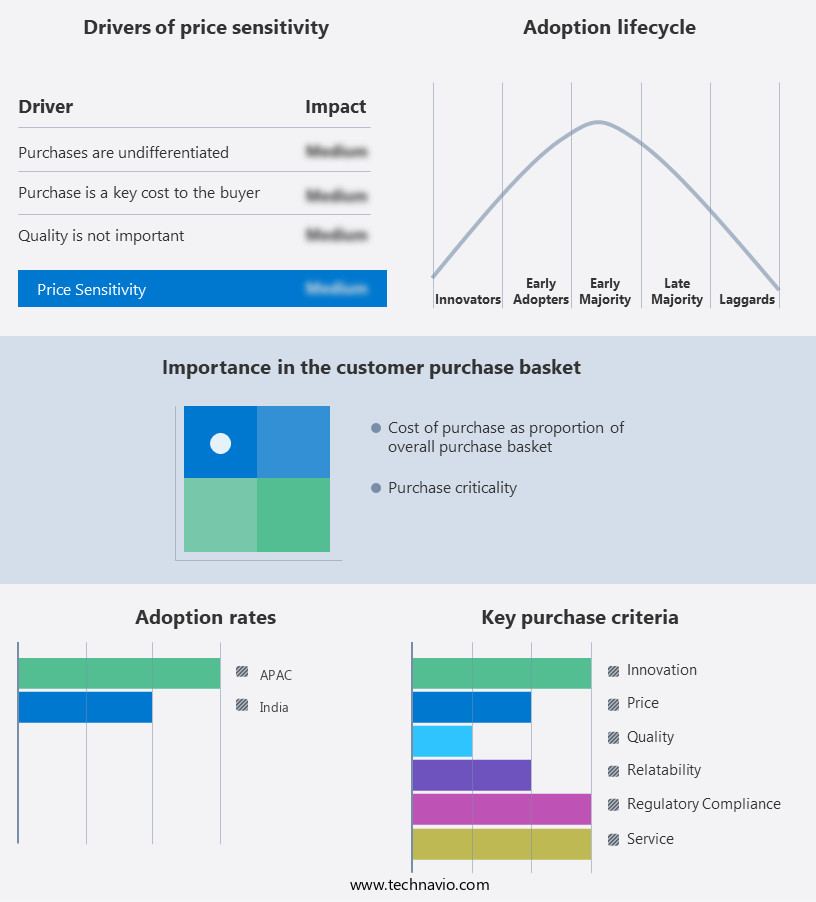
Customer Landscape
Key Companies & Market Insights
Companies are implementing various strategies, such as strategic alliances, market forecast , partnerships, mergers and acquisitions, geographical expansion, and product/service launches, to enhance their presence In the market.
Anil Ceramic - The company specializes in providing a range of non-stackable tableware options, including Flat Plates and Conical Mugs.
The market research and growth report includes detailed analyses of the competitive landscape of the market and information about key companies, including:
- Anil Ceramic
- Ariane Fine Porcelain
- Azcor Tableware India Pvt. Ltd.
- Borosil Ltd.
- Cello World Pvt. Ltd.
- Clay Craft India Pvt. Ltd.
- Corelle Brands LLC
- Cuisinart
- Fabindia Overseas Pvt. Ltd.
- Hamilton Housewares Pvt. Ltd.
- Inter IKEA Holding BV
- LaOpala RG Ltd.
- Madhur Ceramics Pvt. Ltd.
- Meyer Corp.
- Nishita Design
- Pepperfry Pvt. Ltd.
- S K Manekia
- S Tirupati Balaji Glass Industries
- Servewell Household Appliances
- White Hill Studio
Qualitative and quantitative analysis of companies has been conducted to help clients understand the wider business environment as well as the strengths and weaknesses of key market players. Data is qualitatively analyzed to categorize companies as pure play, category-focused, industry-focused, and diversified; it is quantitatively analyzed to categorize companies as dominant, leading, strong, tentative, and weak.
Research Analyst Overview
The market encompasses a wide range of products designed for serving and presenting food and beverages. This market is driven by various factors, including changing consumer preferences, advancements in technology, and evolving trends In the food industry. Consumer preferences have shifted towards functional and aesthetically pleasing tableware. The demand for eco-friendly and sustainable tableware has also increased, as consumers become more conscious of their environmental impact. This has led to the growth of the biodegradable and recycled tableware segments. Advancements in technology have also influenced the tableware market.
Moreover, the integration of technology into tableware has resulted In the development of smart tableware, which can monitor food temperature, detect spills, and even provide nutritional information. This technology can enhance the dining experience and make mealtime more convenient and efficient. The food industry is another key driver of the tableware market. The growing popularity of food delivery services and the rise of fine dining establishments have increased the demand for high-quality tableware. Additionally, the trend towards experiential dining and food presentation has led to the development of innovative and unique tableware designs. The tableware market is also influenced by various trends.
Furthermore, one trend is the move towards minimalist and functional designs. Another trend is the incorporation of technology into tableware, such as QR code labels for nutritional information and interactive tableware that can be controlled via smartphones. The tableware market is diverse and dynamic, with various segments and sub-segments. These include ceramics, glassware, plastic tableware, and cutlery. Each segment has its unique characteristics and growth drivers. Ceramics, for instance, are popular due to their durability and classic appeal. Glassware, on the other hand, is preferred for its transparency and elegance. Additionally, the market is subject to various challenges, such as competition from alternative food packaging solutions and changing consumer preferences. Plastic tableware is known for its affordability and versatility, while cutlery is essential for a complete dining experience.
|
Market Scope |
|
|
Report Coverage |
Details |
|
Page number |
159 |
|
Base year |
2024 |
|
Historic period |
2019-2023 |
|
Forecast period |
2025-2029 |
|
Growth momentum & CAGR |
Accelerate at a CAGR of 4.8% |
|
Market Growth 2025-2029 |
USD 376.9 million |
|
Market structure |
Fragmented |
|
YoY growth 2024-2025(%) |
4.4 |
|
Competitive landscape |
Leading Companies, Market Positioning of Companies, Competitive Strategies, and Industry Risks |
What are the Key Data Covered in this Market Research and Growth Report?
- CAGR of the market during the forecast period
- Detailed information on factors that will drive the market growth and forecasting between 2025 and 2029
- Precise estimation of the size of the market and its contribution of the market in focus to the parent market
- Accurate predictions about upcoming market growth and trends and changes in consumer behaviour
- Growth of the market across India
- Thorough analysis of the market's competitive landscape and detailed information about companies
- Comprehensive analysis of factors that will challenge the growth of market companies
We can help! Our analysts can customize this market research report to meet your requirements. Get in touch