Tangential Flow Filtration Market Size 2024-2028
The tangential flow filtration market size is forecast to increase by USD 587.2 million, at a CAGR of 9.4% between 2023 and 2028.
- The Tangential Flow Filtration (TFF) market is experiencing significant growth, driven primarily by its increasing adoption in the biopharmaceutical sector. This sector's strategic initiatives to enhance production efficiency and improve product quality are fueling the demand for advanced filtration technologies like TFF. However, the high cost of TFF systems poses a significant challenge for market growth. Despite this obstacle, companies can capitalize on the market's potential by focusing on cost reduction strategies, such as optimizing filtration processes, enhancing system design, and exploring alternative materials.
- Additionally, collaborations and partnerships with key industry players could help in technology innovation and market expansion. Overall, the TFF market's dynamics reflect a strategic landscape, where companies must navigate cost challenges while seizing opportunities in the burgeoning biopharmaceutical sector.
What will be the Size of the Tangential Flow Filtration Market during the forecast period?
Explore in-depth regional segment analysis with market size data - historical 2018-2022 and forecasts 2024-2028 - in the full report.
Request Free Sample
Tangential flow filtration (TFF), also known as crossflow filtration, is a versatile membrane separation technology that continues to evolve in response to the dynamic needs of various industries. This technique employs a transverse flow of the feed stream across the membrane surface, enabling the continuous removal of targeted components while minimizing concentration polarization and membrane fouling. Pore size distribution and feed stream characterization are crucial factors in optimizing TFF performance. Membrane fouling, a persistent challenge, can be mitigated through backwash cycles and shear rate control. TFF finds extensive applications in protein purification and concentration, biopharmaceutical production, and continuous processing.
Membrane separation technologies, including TFF, are instrumental in bacteria removal and virus filtration, ensuring the production of safe and efficacious products. Permeate flux rate, filtration efficiency, and process scalability are essential considerations in TFF applications, with transmembrane pressure and membrane lifespan playing significant roles in optimizing module design and bioreactor integration. TFF is also employed in water purification, pharmaceutical manufacturing, food processing, and wastewater treatment, among other sectors. Its ability to recycle retentate and optimize flow rates makes it an attractive choice for industries seeking to minimize waste and improve overall process efficiency. Turbulence reduction and pressure-driven filtration further enhance TFF's versatility, making it a continually evolving and indispensable technology in various industries.
How is this Tangential Flow Filtration Industry segmented?
The tangential flow filtration industry research report provides comprehensive data (region-wise segment analysis), with forecasts and estimates in "USD million" for the period 2024-2028, as well as historical data from 2018-2022 for the following segments.
- Product
- Single-use systems
- Reusable systems
- Geography
- North America
- US
- Canada
- Europe
- France
- Germany
- Italy
- UK
- APAC
- China
- India
- Japan
- South Korea
- Rest of World (ROW)
- North America
By Product Insights
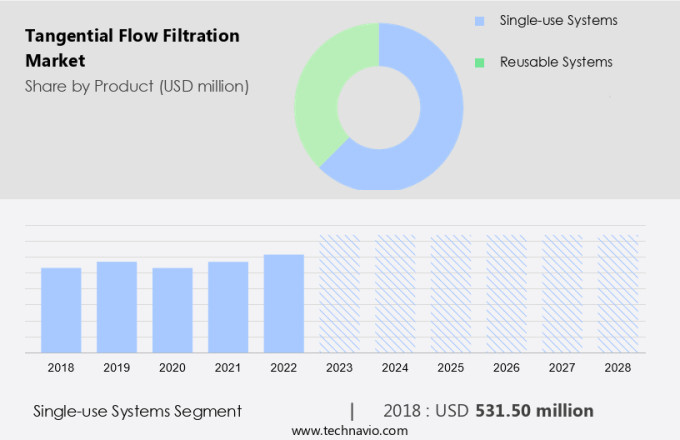
The single-use systems segment is estimated to witness significant growth during the forecast period.
Tangential flow filtration plays a crucial role in the production of biopharmaceuticals, particularly in the downstream processing stage. Single-use tangential flow filtration systems have gained significant traction due to their advantages over reusable systems. These systems minimize labor requirements, buffer, and water usage. The preference for single-use systems is driven by their ability to reduce cross-contamination and processing time. Furthermore, they offer simplified validation and cleaning requirements. Advanced technology in single-use systems allows for the adoption of fully automated, disposable systems, accelerating their adoption. Membrane separation technologies, such as ultrafiltration and microfiltration, are integral to tangential flow filtration.
Membrane fouling and concentration polarization are challenges addressed by backwash cycles and shear rate control. In food processing, particle retention and bacteria removal are essential, while in pharmaceutical manufacturing, virus removal and filtration efficiency are key. The scalability of the process is essential for continuous production, and transmembrane pressure and flow rate optimization are critical factors. Bioreactor integration and membrane lifespan are also crucial considerations. Tangential flow filtration is also employed in water purification and wastewater treatment. The ongoing advancements in membrane technology continue to drive market growth.
The Single-use systems segment was valued at USD 531.50 million in 2018 and showed a gradual increase during the forecast period.
Regional Analysis
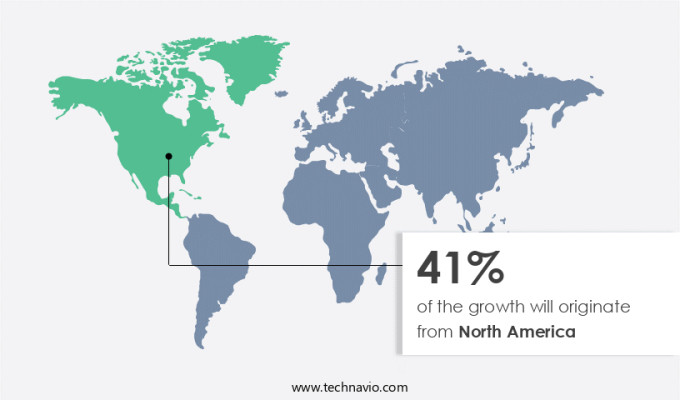
North America is estimated to contribute 41% to the growth of the global market during the forecast period.Technavio’s analysts have elaborately explained the regional trends and drivers that shape the market during the forecast period.
The market in North America is experiencing significant growth due to the region's robust biopharmaceutical industry, advances in bioprocessing technology, and substantial investment in healthcare research and development. Tangential flow filtration, a membrane separation technique, is increasingly utilized for protein purification, cell harvesting, and vaccine production, making it indispensable for producing monoclonal antibodies, gene therapies, and other biologics. The US, as a hub for biotechnology innovation and biomanufacturing, plays a pivotal role in the adoption of this technology. Key players and research institutions are focusing on creating scalable and cost-effective tangential flow filtration systems to boost manufacturing efficiency, a crucial factor for high-demand products such as biosimilars and vaccines.
This filtration method, which employs a crossflow mechanism, allows for continuous processing, minimizing downtime and improving process scalability. Membrane fouling, concentration polarization, and flux decline are challenges that the industry addresses through cleaning-in-place (CIP) procedures, shear rate control, and filtration efficiency optimization. Tangential flow filtration is also applied in food processing for bacteria removal and particle retention, as well as in water purification and wastewater treatment. Pressure-driven filtration, including ultrafiltration and microfiltration processes, are integral to this technology, with membrane lifespan and module design being essential considerations. Turbulence reduction and flow rate optimization are critical aspects of tangential flow filtration, ensuring sterile filtration and maintaining transmembrane pressure.
In summary, the North American the market is thriving due to its application in biopharmaceutical production, food processing, and water treatment, with a focus on enhancing manufacturing efficiency, scalability, and cost-effectiveness.
Market Dynamics
Our researchers analyzed the data with 2023 as the base year, along with the key drivers, trends, and challenges. A holistic analysis of drivers will help companies refine their marketing strategies to gain a competitive advantage.
What are the key market drivers leading to the rise in the adoption of Tangential Flow Filtration Industry?
- The biopharmaceutical sector's expanding acceptance is the primary catalyst fueling market growth.
- Tangential flow filtration systems have gained significant traction in the water purification industry, particularly within the biotechnology and pharmaceutical sectors. These systems employ pressure-driven filtration technology to optimize flow rates, making them ideal for applications in water purification, wastewater treatment, and pharmaceutical manufacturing. Biotechnology companies utilize tangential flow filtration systems for molecular biotechnology research, including studies in molecular biology, microbiology, biochemistry, immunology, genetics, and cell biology. The systems facilitate the separation and purification of proteins, nucleic acids, and other biomolecules, enabling the development of novel medicines and effective treatments. Pharmaceutical companies, in turn, leverage tangential flow filtration systems for various applications, such as monoclonal antibodies, viral vector/gene therapy, and the purification of protein-based COVID-19 vaccines.
- The focus on these applications is driven by the need for high-purity components and consistent product quality in the production of pharmaceuticals. Module design plays a crucial role in the longevity and efficiency of tangential flow filtration systems. Proper design considerations, such as material selection and flow geometry, can maximize membrane lifespan and minimize fouling, ensuring the systems maintain optimal performance over extended periods.
What are the market trends shaping the Tangential Flow Filtration Industry?
- Market trends indicate a focus on strategic initiatives by companies in various markets. This professional and knowledgeable approach is becoming increasingly common.
- The market is characterized by intense competition among companies, driving them to innovate and expand their product offerings. Market participants employ strategies such as collaborations, partnerships, mergers and acquisitions, and capacity expansions to strengthen their market position. companies focus on developing advanced filtration systems with optimized pore size distributions to cater to various applications, particularly in protein purification and concentration polarization mitigation. Membrane fouling remains a significant challenge, leading companies to invest in research and development to improve filtration membranes and minimize fouling. Additionally, companies prioritize cleaning-in-place (CIP) systems to ensure efficient operation and maintain product quality. Crossflow filtration, a type of tangential flow filtration, is gaining popularity due to its ability to handle high flow rates and large volumes, making it suitable for large-scale applications.
- companies are expanding their geographic reach to cater to the growing demand for tangential flow filtration systems. Key players in the market include GE Healthcare, Sartorius AG, Danaher Corporation, Novasep, and Repligen Corporation.
What challenges does the Tangential Flow Filtration Industry face during its growth?
- The high cost of tangential flow filtration systems poses a significant challenge to the industry's growth trajectory. This expense represents a substantial investment for organizations, potentially limiting the adoption and expansion of applications that rely on this technology.
- Tangential flow filtration (TFF) is a membrane separation technology widely used in various industries, including biopharmaceutical production and food processing, for bacteria removal and particle retention. This technique enables continuous processing, which is essential for large-scale operations. However, medium- and small-scale laboratories and research institutes often face affordability constraints when procuring TFF systems. In developing regions, where many small- and medium-scale labs exist, collaboration with other institutions is a common approach due to budget limitations. While this method can be effective, it may lead to potential errors or misinterpreted results. Traditional TFF systems are complex and expensive, making them impractical for individual labs.
- To address this challenge, advancements in TFF technology have led to the development of more cost-effective and user-friendly systems. These innovations enable smaller labs to perform membrane filtration processes in-house, reducing the need for external collaborations and ensuring data accuracy. Additionally, retentate recycling and virus removal are other critical applications of TFF, contributing to its increasing demand across various industries.
Exclusive Customer Landscape
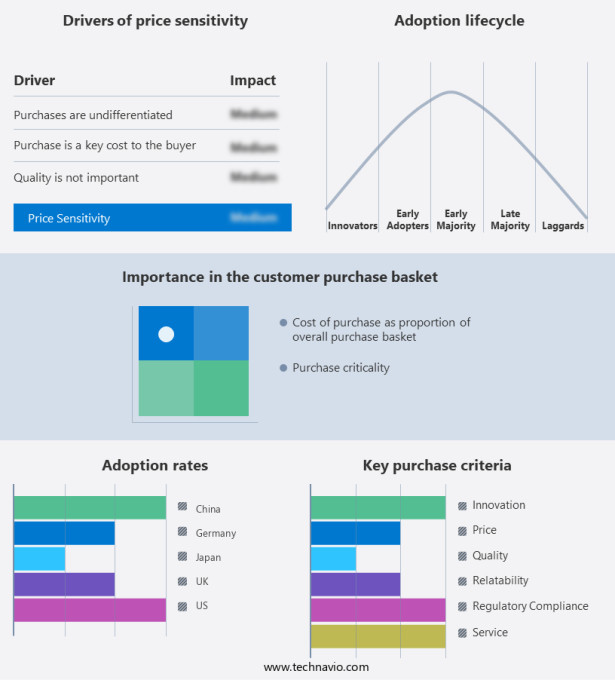
The tangential flow filtration market forecasting report includes the adoption lifecycle of the market, covering from the innovator’s stage to the laggard’s stage. It focuses on adoption rates in different regions based on penetration. Furthermore, the tangential flow filtration market report also includes key purchase criteria and drivers of price sensitivity to help companies evaluate and develop their market growth analysis strategies.
Customer Landscape
Key Companies & Market Insights
Companies are implementing various strategies, such as strategic alliances, tangential flow filtration market forecast, partnerships, mergers and acquisitions, geographical expansion, and product/service launches, to enhance their presence in the industry.
Alfa Laval AB - The Alfa Laval ALMEM-UF system represents a leading-edge automatic and continuous membrane filtration solution for effective ultrafiltration processes. Widely adopted in the food, pharmaceutical, and biotech industries, this tangential flow filtration system delivers optimal results for various applications. Its advanced design ensures uninterrupted operation and high productivity, making it a preferred choice for companies seeking efficient and reliable filtration solutions.
The industry research and growth report includes detailed analyses of the competitive landscape of the market and information about key companies, including:
- Alfa Laval AB
- Andritz AG
- Cole Parmer
- Danaher Corp.
- Donaldson Co. Inc.
- Evoqua Water Technologies LLC
- GEA Group AG
- General Electric Co.
- Koch Industries Inc.
- Merck KGaA
- Novasep Holding SAS
- OSMO Membrane Systems GmbH
- Parker Hannifin Corp.
- PendoTECH
- Repligen Corp.
- Sartorius AG
- Synder Filtration Inc.
- TAMI Industries SAS
- Thermo Fisher Scientific Inc.
- Veolia Environnement SA
Qualitative and quantitative analysis of companies has been conducted to help clients understand the wider business environment as well as the strengths and weaknesses of key industry players. Data is qualitatively analyzed to categorize companies as pure play, category-focused, industry-focused, and diversified; it is quantitatively analyzed to categorize companies as dominant, leading, strong, tentative, and weak.
Recent Development and News in Tangential Flow Filtration Market
- In January 2024, Pall Corporation, a leading filtration solutions provider, announced the launch of its new Tangential Flow Filtration (TFF) system, the AKTA pure TFF 25+, designed for large-scale biopharmaceutical applications (Pall Corporation press release). This innovative system offers increased capacity and improved productivity.
- In March 2024, Merck KGaA and Sartorius AG, two major players in the market, entered into a strategic partnership to jointly develop and commercialize a new range of TFF systems for the biopharmaceutical industry (Merck KGaA press release). This collaboration combines Merck KGaA's expertise in life science research and Sartorius AG's strength in laboratory and industrial filtration.
- In May 2024, GE Healthcare, a global healthcare company, completed the acquisition of Cytiva, a leading provider of technology and services for the life sciences industry, including Tangential Flow Filtration systems (GE Healthcare press release). This acquisition significantly expanded GE Healthcare's presence in the life sciences sector and strengthened its TFF product portfolio.
- In April 2025, Sartorius Stedim Biotech, a Sartorius AG subsidiary, received regulatory approval from the U.S. Food and Drug Administration (FDA) for its new TFF system, the Stedim Biotech Lab TFF 15+ (Sartorius Stedim Biotech press release). This approval marked the entry of the system into the U.S. Market, expanding Sartorius Stedim Biotech's global reach.
Research Analyst Overview
- In the market, system automation plays a pivotal role in enhancing flow dynamics and optimizing filtration capacity. A data acquisition system enables real-time monitoring of energy consumption, solids concentration, and hydraulic retention time, contributing to sustainable technology and product quality. Waste minimization is a significant trend, with process control strategies aimed at reducing energy consumption and improving recovery yield. Membrane material selection, cleaning validation, and particle size analysis are crucial aspects of process validation and optimization.
- Regulatory compliance, membrane integrity, and design parameters are essential considerations for scale-up challenges. Operational cost and environmental impact are key factors influencing market growth, with a focus on process simulation and membrane integrity testing to ensure efficient and eco-friendly filtration processes.
Dive into Technavio’s robust research methodology, blending expert interviews, extensive data synthesis, and validated models for unparalleled Tangential Flow Filtration Market insights. See full methodology.
|
Market Scope |
|
|
Report Coverage |
Details |
|
Page number |
165 |
|
Base year |
2023 |
|
Historic period |
2018-2022 |
|
Forecast period |
2024-2028 |
|
Growth momentum & CAGR |
Accelerate at a CAGR of 9.4% |
|
Market growth 2024-2028 |
USD 587.2 million |
|
Market structure |
Fragmented |
|
YoY growth 2023-2024(%) |
8.5 |
|
Key countries |
US, China, UK, Germany, Japan, Canada, India, South Korea, France, and Italy |
|
Competitive landscape |
Leading Companies, Market Positioning of Companies, Competitive Strategies, and Industry Risks |
What are the Key Data Covered in this Tangential Flow Filtration Market Research and Growth Report?
- CAGR of the Tangential Flow Filtration industry during the forecast period
- Detailed information on factors that will drive the growth and forecasting between 2024 and 2028
- Precise estimation of the size of the market and its contribution of the industry in focus to the parent market
- Accurate predictions about upcoming growth and trends and changes in consumer behaviour
- Growth of the market across North America, Europe, Asia, and Rest of World (ROW)
- Thorough analysis of the market’s competitive landscape and detailed information about companies
- Comprehensive analysis of factors that will challenge the tangential flow filtration market growth of industry companies
We can help! Our analysts can customize this tangential flow filtration market research report to meet your requirements.


