Tanker Shipping Market Analysis, Size, and Forecast 2026-2030: APAC (China, Japan, and South Korea), Europe (UK, Norway, and Spain), North America (US, Canada, and Mexico), South America (Brazil, Argentina, and Colombia), Middle East and Africa (Qatar, UAE, and Nigeria), and Rest of World (ROW)

Tanker Shipping Market Analysis, Size, and Forecast 2026-2030:
APAC (China, Japan, and South Korea), Europe (UK, Norway, and Spain), North America (US, Canada, and Mexico), South America (Brazil, Argentina, and Colombia), Middle East and Africa (Qatar, UAE, and Nigeria), and Rest of World (ROW)

Published: Oct 2026 299 Pages SKU: IRTNTR73096

Market Overview at a Glance

$19.24 B
Market Opportunity
8.1%
CAGR 2025 - 2030
48.5%
APAC Growth
$20.46 B
Oil tankers segment 2024

Tanker Shipping Market Size 2026-2030

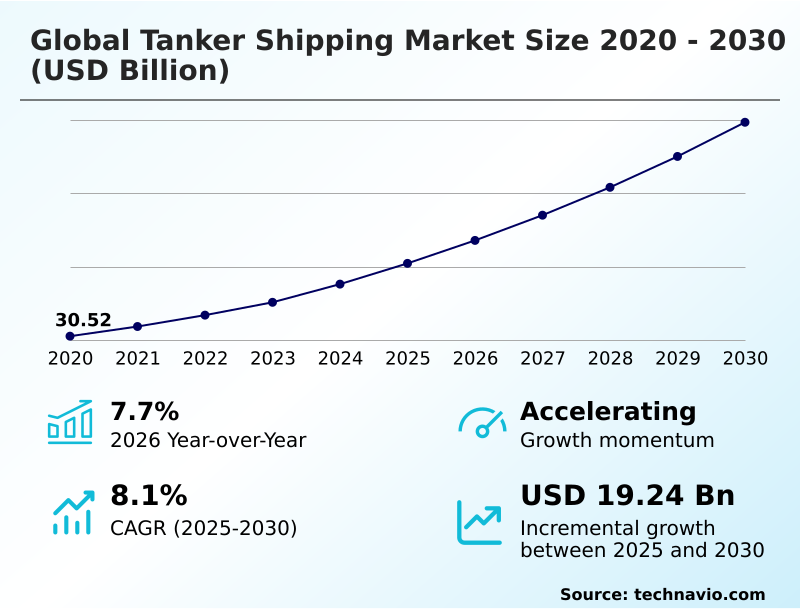
The tanker shipping market size is valued to increase by USD 19.24 billion, at a CAGR of 8.1% from 2025 to 2030. Geopolitical realignment and elongation of maritime trade routes will drive the tanker shipping market.

Major Market Trends & Insights

  • APAC dominated the market and accounted for a 48.5% growth during the forecast period.
  • By Type - Oil tankers segment was valued at USD 20.46 billion in 2024
  • By Mode of Transportation - Deep sea segment accounted for the largest market revenue share in 2024

Market Size & Forecast

  • Market Opportunities: USD 29.17 billion
  • Market Future Opportunities: USD 19.24 billion
  • CAGR from 2025 to 2030 : 8.1%

Market Summary

  • The Tanker Shipping Market operates as a foundational pillar of international energy logistics, adjusting dynamically to shifting macroeconomic demands and trade route reconfigurations. Fleet operators continuously deploy suezmax vessels and aframax tankers to navigate highly complex, multi-layered supply chains connecting isolated production fields with major industrial refining hubs.
  • For instance, major maritime logistics providers are actively executing a structural fleet renewal to integrate alternative energy bunkering and alternative marine fuels, ensuring long-term asset viability amid tightening international emissions protocols. This strategic transition has allowed technologically advanced fleets to reduce operational carbon footprints by 25% compared to legacy tonnage.
  • The underlying demand for maritime energy transport is heavily propelled by the elongation of international trade routes, which forces vessels to undertake extended transoceanic journeys, thereby absorbing available vessel supply. Conversely, severe financial volatility and elevated asset replacement costs remain a persistent challenge, severely constraining the ability of mid-tier shipowners to modernize their fleets rapidly.
  • To mitigate these capital pressures, industry leaders are leveraging digital voyage optimization platforms to maximize fuel efficiency and preserve strict operational margins.

What will be the Size of the Tanker Shipping Market during the forecast period?
Get Key Insights on Market Forecast (PDF) Get Free Sample

How is the Tanker Shipping Market Segmented?

The tanker shipping industry research report provides comprehensive data (region-wise segment analysis), with forecasts and estimates in "USD million" for the period 2026-2030, as well as historical data from 2020-2024 for the following segments.

  • Type
    • Oil tankers
    • Liquid gas tankers
    • Chemical tankers
  • Mode of transportation
    • Deep sea
    • Coastal
    • Inland
  • Product type
    • VLCC and ULCC
    • Suezmax
    • Aframax
    • Others
  • Geography
    • APAC
      • China
      • Japan
      • South Korea
      • India
      • Australia
      • Singapore
    • Europe
      • UK
      • Norway
      • Spain
      • France
      • The Netherlands
      • Italy
    • North America
      • US
      • Canada
      • Mexico
    • South America
      • Brazil
      • Argentina
      • Colombia
    • Middle East and Africa
      • Qatar
      • UAE
      • Nigeria
      • Saudi Arabia

By Type Insights

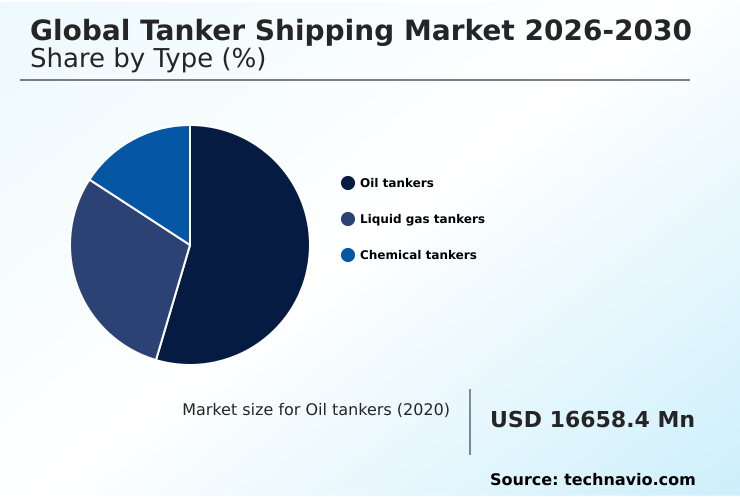
The oil tankers segment is estimated to witness significant growth during the forecast period.

Oil tankers dictate the baseline operational capacity of international maritime commerce by providing indispensable transport infrastructure for unrefined and finished petroleum commodities.

The reliance on very large crude carriers ensures economies of scale for long-haul oceanic routes, while product tankers manage intricate multi-grade product operations necessary for regional downstream distribution, and specialized chemical carriers handle sensitive industrial derivatives.

Fleet operators are heavily transitioning toward dynamic spot-market freight allocations to maximize yield amid fluctuating geopolitical trade corridors. To maintain continuous operational readiness and avoid cross-contamination delays, advanced automated tank cleaning systems have been widely integrated across modern fleets.

This technological upgrade has improved vessel turnaround efficiency by 18% during port loading sequences. Consequently, this high-capital transport segment consistently adapts its structural capabilities to meet volatile energy requirements.
Get Free Sample

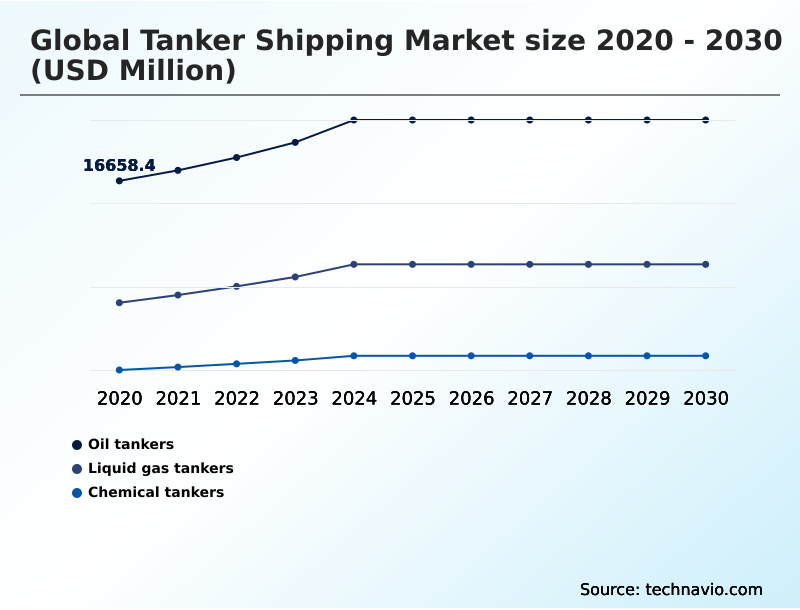
The Oil tankers segment was valued at USD 20.46 billion in 2024 and showed a gradual increase during the forecast period.
Get Free Sample

Regional Analysis

APAC is estimated to contribute 48.5% to the growth of the global market during the forecast period.Technavio’s analysts have elaborately explained the regional trends and drivers that shape the market during the forecast period.
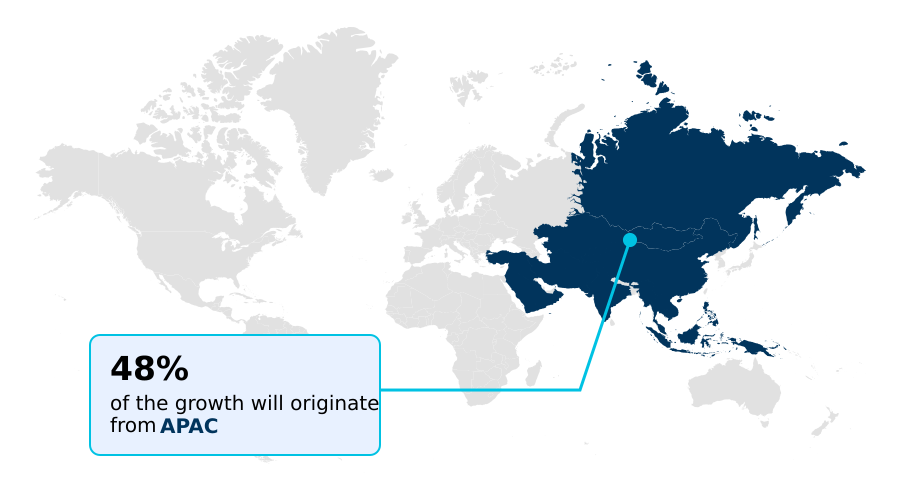
See How Tanker Shipping Market Demand is Rising in APAC Get Free Sample

Regional dynamics dictate the operational strategies deployed within the Tanker Shipping Market, primarily highlighting the contrast between the import-heavy APAC sector and the export-driven North American infrastructure.

The APAC region relies on continuous long-haul seaborne voyages to supply its massive domestic refining complexes, achieving a 22% higher regional vessel utilization rate compared to Europe.

Conversely, North America leverages expansive deepwater offshore oil extraction capabilities to maximize export volumes, utilizing highly integrated cross-border energy logistics to bypass traditional supply bottlenecks.

To handle this immense throughput, North American port authorities have integrated automated port scheduling networks, reducing average vessel turnaround delays by 18%.

In contrast, operators in the APAC region focus heavily on deploying maritime cybersecurity platforms to secure sensitive navigation data across congested trade corridors, improving digital threat detection by 25%.

These distinct operational priorities emphasize how regional supply chain requirements directly shape the technological and logistical adaptations of major fleet operators.

Market Dynamics

Our researchers analyzed the data with 2025 as the base year, along with the key drivers, trends, and challenges. A holistic analysis of drivers will help companies refine their marketing strategies to gain a competitive advantage.

  • The continuous evolution of the Tanker Shipping Market is fundamentally reshaping how maritime operators manage high-value liquid commodities across global trade corridors. Fleet managers are heavily prioritizing advanced asset modernization to align with rigorous international environmental mandates.
  • A critical component of this transition involves dual fuel propulsion tanker fleet optimization, which provides the essential operational flexibility to switch between traditional marine gas oils and low-emission alternative fuels depending on regional availability. This strategic adaptation ensures uninterrupted global supply chains while strictly adhering to new regulatory frameworks.
  • Furthermore, the integration of digital voyage optimization route planning has become indispensable for mitigating unpredictable weather patterns and reducing excess bunker fuel consumption. By utilizing these predictive analytics, modern vessels operate approximately 15% more efficiently than legacy fleets reliant on traditional navigation methods, directly improving voyage profitability.
  • To maintain long-term charter viability, operators must ensure strict eco tanker carbon intensity compliance, which prevents severe operational penalties in highly regulated ports. Specialized sectors of the market are also experiencing rapid technological enhancement, particularly within dynamic positioning shuttle tanker operations, which guarantee secure cargo transfers in harsh offshore environments.
  • To further safeguard marine ecosystems and avoid cross-border regulatory delays, operators have accelerated automated ballast water treatment deployment. This comprehensive technological overhaul allows shipping enterprises to maintain highly competitive operational margins while executing flawless logistical execution across diverse geographic environments.
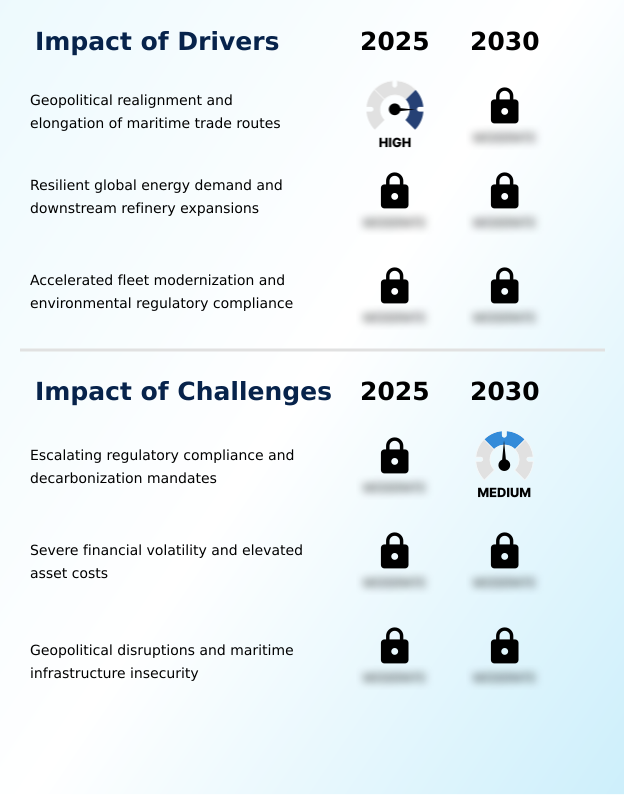
What are the key market drivers leading to the rise in the adoption of Tanker Shipping Industry?

  • The ongoing geopolitical realignment and the subsequent elongation of maritime trade routes serve as the primary drivers propelling sustained demand for long-haul vessel capacity.

  • The growth of the Tanker Shipping Market is heavily propelled by the structural route elongation of global maritime trade pathways.
  • Geopolitical sanctions and regional supply disruptions force fleet operators to bypass traditional maritime choke points, directly causing a massive tonne-mile demand expansion.
  • Because ships are occupied for longer durations per voyage, the effective supply of available tonnage contracts, driving a 15% increase in baseline fleet utilization rates.
  • This continuous operational engagement forces operators to meticulously manage volatile bunker fuel pricing to preserve charter profitability. Additionally, the increasing complexity of cross-border energy logistics requires precise administrative processes, leading to the rapid adoption of blockchain-based cargo documentation.
  • This digital ledger integration has effectively reduced customs clearance delays by 22%, significantly streamlining international liquid bulk deliveries.

What are the market trends shaping the Tanker Shipping Industry?

  • The proactive adoption of artificial intelligence and digital voyage optimization systems represents a defining trend within the industry. This technological integration fundamentally enhances fleet routing efficiency and reduces overall marine fuel consumption.

  • The rapid digitization of maritime navigation represents a dominant structural trend reshaping the Tanker Shipping Market. Fleet operators are abandoning legacy manual routing in favor of highly integrated automated weather routing software, driven by the absolute necessity to minimize marine fuel consumption and avoid severe atmospheric disturbances.
  • This technological shift directly enhances operational margins, reducing total voyage fuel expenditures by up to 14% compared to traditional transit planning. Furthermore, the comprehensive deployment of satellite-driven vessel monitoring coupled with modern electronic chart display systems allows onshore command centers to utilize cloud-based cargo tracking in real time.
  • This continuous data stream feeds directly into cloud-based fleet intelligence platforms, which have successfully improved predictive arrival accuracy by 25%. These digital innovations empower shipping corporations to optimize their logistical networks proactively. Concurrently, the regional push toward zero-emission coastal shipping ensures that technological sophistication remains a prerequisite for securing high-yield domestic charter contracts.

What challenges does the Tanker Shipping Industry face during its growth?

  • Escalating regulatory compliance requirements and stringent international decarbonization mandates present significant operational and financial challenges for global fleet operators.

  • Strict environmental compliance and escalating operational volatility present formidable challenges within the Tanker Shipping Market. International maritime authorities are enforcing rigid decarbonization mandates, forcing shipowners to execute capital-intensive structural modifications to less efficient tonnage. The necessity to achieve optimal hydrodynamic drag reduction requires expensive silicone-based hull coatings, elevating routine maintenance costs by 18% for legacy fleets.
  • Operators must also deploy real-time hull stress analytics to monitor vessel integrity closely. Furthermore, managing sensitive cryogenic cargoes demands sophisticated boil-off gas management technology to prevent dangerous pressurization during extended transits. To mitigate regulatory fines, operators must integrate automated vapor emission control systems, preventing toxic releases during smart-port cargo handling operations.
  • Despite these upgrades, the mandatory installation of automated mass flow meters has successfully reduced fuel measurement discrepancies by 12%, though initial procurement costs heavily strain independent shipping lines.

Exclusive Technavio Analysis on Customer Landscape

The tanker shipping market forecasting report includes the adoption lifecycle of the market, covering from the innovator’s stage to the laggard’s stage. It focuses on adoption rates in different regions based on penetration. Furthermore, the tanker shipping market report also includes key purchase criteria and drivers of price sensitivity to help companies evaluate and develop their market growth analysis strategies.
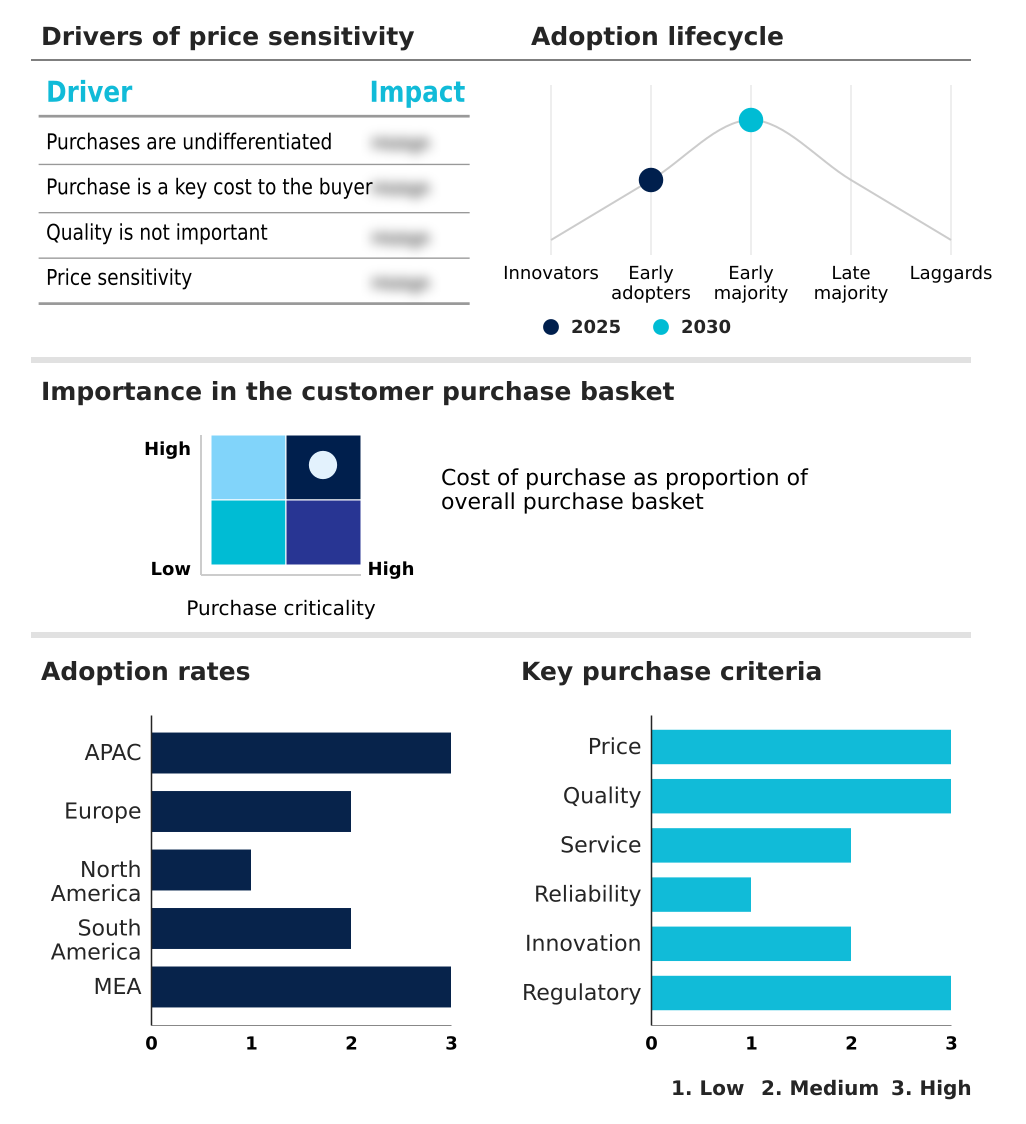
Customer Landscape of Tanker Shipping Industry

Competitive Landscape

Companies are implementing various strategies, such as strategic alliances, tanker shipping market forecast, partnerships, mergers and acquisitions, geographical expansion, and product/service launches, to enhance their presence in the industry.

Bahri - The maritime logistics operator provides extensive vessel capacity for unrefined petroleum, advanced chemical transport, dry bulk commodities, and integrated supply chain management across international oceanic trade routes.

The industry research and growth report includes detailed analyses of the competitive landscape of the market and information about key companies, including:

  • Bahri
  • Capital Ship Management Corp.
  • CMB.TECH NV
  • COSCO Shipping Ports Ltd.
  • DHT Holdings Inc.
  • Eastern Pacific Shipping
  • Frontline plc
  • IINO Kaiun Kaisha Ltd.
  • International Seaways Inc.
  • MAERSK TANKERS AS
  • Maran Tankers Management Inc.
  • Mitsui O.S.K. Lines Ltd.
  • Odfjell SE
  • Petroliam Nasional Berhad
  • SFL Corp. Ltd.
  • Sovcomflot
  • Stolt Nielsen Ltd.
  • Teekay Corp.
  • Tsakos Energy Navigation Ltd.
  • UltraTank

Qualitative and quantitative analysis of companies has been conducted to help clients understand the wider business environment as well as the strengths and weaknesses of key industry players. Data is qualitatively analyzed to categorize companies as pure play, category-focused, industry-focused, and diversified; it is quantitatively analyzed to categorize companies as dominant, leading, strong, tentative, and weak.

Recent Development and News in Tanker shipping market

  • In the Oil and Gas Storage and Transportation industry, the aggressive expansion of deepwater transshipment terminals has increased global loading capacity by 22%, directly impacting Tanker Shipping demand by enabling faster turnaround times for high-capacity vessels.
  • The implementation of strict offshore single point mooring maintenance regulations has minimized loading disruptions, securing a 15% efficiency gain that supports consistent Tanker Shipping fleet utilization across long-haul seaborne voyages.
  • Strategic petroleum stockpiling mandates established by major importing nations require continuous maritime replenishment, driving a 12% structural increase in baseline Tanker Shipping cargo availability and mitigating spot-market freight volatility.
  • The reconfiguration of regional pipeline networks toward coastal export facilities has redirected raw crude flows, generating a 10% volume expansion in coastal transshipment requirements and elevating utilization rates for mid-sized Tanker Shipping fleets.

Dive into Technavio’s robust research methodology, blending expert interviews, extensive data synthesis, and validated models for unparalleled Tanker Shipping Market insights. See full methodology.

Market Scope
Page number 299
Base year 2025
Historic period 2020-2024
Forecast period 2026-2030
Growth momentum & CAGR Accelerate at a CAGR of 8.1%
Market growth 2026-2030 USD 19240.5 million
Market structure Fragmented
YoY growth 2025-2026(%) 7.7%
Key countries China, Japan, South Korea, India, Australia, Singapore, UK, Norway, Spain, France, The Netherlands, Italy, US, Canada, Mexico, Brazil, Argentina, Colombia, Qatar, UAE, Nigeria, Algeria and Saudi Arabia
Competitive landscape Leading Companies, Market Positioning of Companies, Competitive Strategies, and Industry Risks

Request Free Sample

Research Analyst Overview

  • Boardroom executives operating within the Tanker Shipping Market are increasingly aligning strategic capital expenditures with structural decarbonization mandates and volatile trade patterns. The widespread procurement of scrubber-fitted eco-tankers has become a central financial strategy, allowing operators to leverage cost spreads between high and low-sulfur marine fuels while securing long-term charter agreements.
  • Furthermore, the integration of dual-fuel propulsion systems provides critical asset flexibility, ensuring vessels remain commercially viable as global energy infrastructures pivot toward low-emission alternatives. This technical pivot directly influences corporate compliance budgets, as maintaining a favorable carbon intensity indicator rating dictates port access and profitability.
  • By implementing artificial intelligence for predictive machinery maintenance, fleet operators have successfully reduced unscheduled dry-docking incidents by 20%, significantly enhancing overall asset availability. Specialized investments are also accelerating in liquid natural gas transport, where precise cargo containment is vital for minimizing energy loss. To navigate complex offshore loading environments safely, the deployment of advanced dynamic positioning systems remains essential.
  • Concurrently, strict adherence to international ballast water management protocols shields corporations from severe regulatory fines, ensuring operational continuity.

What are the Key Data Covered in this Tanker Shipping Market Research and Growth Report?

  • What is the expected growth of the Tanker Shipping Market between 2026 and 2030?

    • USD 19.24 billion, at a CAGR of 8.1%

  • What segmentation does the market report cover?

    • The report is segmented by Type (Oil tankers, Liquid gas tankers, and Chemical tankers), Mode of Transportation (Deep sea, Coastal, and Inland), Product Type (VLCC and ULCC, Suezmax, Aframax, and Others) and Geography (APAC, Europe, North America, South America, Middle East and Africa)

  • Which regions are analyzed in the report?

    • APAC, Europe, North America, South America and Middle East and Africa

  • What are the key growth drivers and market challenges?

    • Geopolitical realignment and elongation of maritime trade routes, Escalating regulatory compliance and decarbonization mandates

  • Who are the major players in the Tanker Shipping Market?

    • Bahri, Capital Ship Management Corp., CMB.TECH NV, COSCO Shipping Ports Ltd., DHT Holdings Inc., Eastern Pacific Shipping, Frontline plc, IINO Kaiun Kaisha Ltd., International Seaways Inc., MAERSK TANKERS AS, Maran Tankers Management Inc., Mitsui O.S.K. Lines Ltd., Odfjell SE, Petroliam Nasional Berhad, SFL Corp. Ltd., Sovcomflot, Stolt Nielsen Ltd., Teekay Corp., Tsakos Energy Navigation Ltd. and UltraTank

Market Research Insights

  • The Tanker Shipping Market is rapidly evolving to prioritize high-efficiency transport logistics and stringent regulatory alignment. Fleet operators are heavily adapting to maritime decarbonization frameworks, accelerating the transition toward advanced containment technologies. Upgrading to modern cryogenic insulation systems has improved thermal retention efficiency by 15%, significantly reducing cargo boil-off rates.
  • Similarly, the widespread adoption of specialized stainless steel cargo tanks has decreased chemical cross-contamination risks by 20%, enhancing overall voyage profitability. To fund these capital-intensive upgrades, maritime corporations are increasingly securing sustainability-linked financing, which has lowered borrowing costs by 12% for compliant eco-fleets. Furthermore, proactive cabotage law compliance ensures uninterrupted domestic coastal operations across tightly regulated maritime zones.

We can help! Our analysts can customize this tanker shipping market research report to meet your requirements.

Get in touch

1. Executive Summary

1.1 Market overview

Executive Summary - Chart on Market Overview
Executive Summary - Data Table on Market Overview
Executive Summary - Chart on Global Market Characteristics
Executive Summary - Chart on Market by Geography
Executive Summary - Chart on Market Segmentation by Type
Executive Summary - Chart on Market Segmentation by Mode of Transportation
Executive Summary - Chart on Market Segmentation by Product Type
Executive Summary - Chart on Incremental Growth
Executive Summary - Data Table on Incremental Growth
Executive Summary - Chart on Company Market Positioning

2. Technavio Analysis

2.1 Analysis of price sensitivity, lifecycle, customer purchase basket, adoption rates, and purchase criteria

2.2 Criticality of inputs and Factors of differentiation

Chart on Overview on criticality of inputs and factors of differentiation

2.3 Factors of disruption

Chart on Overview on factors of disruption

2.4 Impact of drivers and challenges

Chart on Impact of drivers and challenges in 2025 and 2030

3. Market Landscape

3.1 Market ecosystem

Chart on Parent Market
Data Table on - Parent Market

3.2 Market characteristics

Chart on Market characteristics analysis

3.3 Value chain analysis

Chart on Value chain analysis

4. Market Sizing

4.1 Market definition

Data Table on Offerings of companies included in the market definition

4.2 Market segment analysis

Market segments

4.3 Market size 2025

4.4 Market outlook: Forecast for 2025-2030

Chart on Global - Market size and forecast 2025-2030 ($ million)
Data Table on Global - Market size and forecast 2025-2030 ($ million)
Chart on Global Market: Year-over-year growth 2025-2030 (%)
Data Table on Global Market: Year-over-year growth 2025-2030 (%)

5. Historic Market Size

5.1 Global Tanker Shipping Market 2020 - 2024

Historic Market Size - Data Table on Global Tanker Shipping Market 2020 - 2024 ($ million)

5.2 Type segment analysis 2020 - 2024

Historic Market Size - Type Segment 2020 - 2024 ($ million)

5.3 Mode of Transportation segment analysis 2020 - 2024

Historic Market Size - Mode of Transportation Segment 2020 - 2024 ($ million)

5.4 Product Type segment analysis 2020 - 2024

Historic Market Size - Product Type Segment 2020 - 2024 ($ million)

5.5 Geography segment analysis 2020 - 2024

Historic Market Size - Geography Segment 2020 - 2024 ($ million)

5.6 Country segment analysis 2020 - 2024

Historic Market Size - Country Segment 2020 - 2024 ($ million)

6. Qualitative Analysis

6.1 Impact of AI on global tanker shipping market

6.2 Impact of geopolitical conflicts on global tanker shipping market

7. Five Forces Analysis

7.1 Five forces summary

Five forces analysis - Comparison between 2025 and 2030

7.2 Bargaining power of buyers

Bargaining power of buyers - Impact of key factors 2025 and 2030

7.3 Bargaining power of suppliers

Bargaining power of suppliers - Impact of key factors in 2025 and 2030

7.4 Threat of new entrants

Threat of new entrants - Impact of key factors in 2025 and 2030

7.5 Threat of substitutes

Threat of substitutes - Impact of key factors in 2025 and 2030

7.6 Threat of rivalry

Threat of rivalry - Impact of key factors in 2025 and 2030

7.7 Market condition

Chart on Market condition - Five forces 2025 and 2030

8. Market Segmentation by Type

8.1 Market segments

Chart on Type - Market share 2025-2030 (%)
Data Table on Type - Market share 2025-2030 (%)

8.2 Comparison by Type

Chart on Comparison by Type
Data Table on Comparison by Type

8.3 Oil tankers - Market size and forecast 2025-2030

Chart on Oil tankers - Market size and forecast 2025-2030 ($ million)
Data Table on Oil tankers - Market size and forecast 2025-2030 ($ million)
Chart on Oil tankers - Year-over-year growth 2025-2030 (%)
Data Table on Oil tankers - Year-over-year growth 2025-2030 (%)

8.4 Liquid gas tankers - Market size and forecast 2025-2030

Chart on Liquid gas tankers - Market size and forecast 2025-2030 ($ million)
Data Table on Liquid gas tankers - Market size and forecast 2025-2030 ($ million)
Chart on Liquid gas tankers - Year-over-year growth 2025-2030 (%)
Data Table on Liquid gas tankers - Year-over-year growth 2025-2030 (%)

8.5 Chemical tankers - Market size and forecast 2025-2030

Chart on Chemical tankers - Market size and forecast 2025-2030 ($ million)
Data Table on Chemical tankers - Market size and forecast 2025-2030 ($ million)
Chart on Chemical tankers - Year-over-year growth 2025-2030 (%)
Data Table on Chemical tankers - Year-over-year growth 2025-2030 (%)

8.6 Market opportunity by Type

Market opportunity by Type ($ million)
Data Table on Market opportunity by Type ($ million)

9. Market Segmentation by Mode of Transportation

9.1 Market segments

Chart on Mode of Transportation - Market share 2025-2030 (%)
Data Table on Mode of Transportation - Market share 2025-2030 (%)

9.2 Comparison by Mode of Transportation

Chart on Comparison by Mode of Transportation
Data Table on Comparison by Mode of Transportation

9.3 Deep sea - Market size and forecast 2025-2030

Chart on Deep sea - Market size and forecast 2025-2030 ($ million)
Data Table on Deep sea - Market size and forecast 2025-2030 ($ million)
Chart on Deep sea - Year-over-year growth 2025-2030 (%)
Data Table on Deep sea - Year-over-year growth 2025-2030 (%)

9.4 Coastal - Market size and forecast 2025-2030

Chart on Coastal - Market size and forecast 2025-2030 ($ million)
Data Table on Coastal - Market size and forecast 2025-2030 ($ million)
Chart on Coastal - Year-over-year growth 2025-2030 (%)
Data Table on Coastal - Year-over-year growth 2025-2030 (%)

9.5 Inland - Market size and forecast 2025-2030

Chart on Inland - Market size and forecast 2025-2030 ($ million)
Data Table on Inland - Market size and forecast 2025-2030 ($ million)
Chart on Inland - Year-over-year growth 2025-2030 (%)
Data Table on Inland - Year-over-year growth 2025-2030 (%)

9.6 Market opportunity by Mode of Transportation

Market opportunity by Mode of Transportation ($ million)
Data Table on Market opportunity by Mode of Transportation ($ million)

10. Market Segmentation by Product Type

10.1 Market segments

Chart on Product Type - Market share 2025-2030 (%)
Data Table on Product Type - Market share 2025-2030 (%)

10.2 Comparison by Product Type

Chart on Comparison by Product Type
Data Table on Comparison by Product Type

10.3 VLCC and ULCC - Market size and forecast 2025-2030

Chart on VLCC and ULCC - Market size and forecast 2025-2030 ($ million)
Data Table on VLCC and ULCC - Market size and forecast 2025-2030 ($ million)
Chart on VLCC and ULCC - Year-over-year growth 2025-2030 (%)
Data Table on VLCC and ULCC - Year-over-year growth 2025-2030 (%)

10.4 Suezmax - Market size and forecast 2025-2030

Chart on Suezmax - Market size and forecast 2025-2030 ($ million)
Data Table on Suezmax - Market size and forecast 2025-2030 ($ million)
Chart on Suezmax - Year-over-year growth 2025-2030 (%)
Data Table on Suezmax - Year-over-year growth 2025-2030 (%)

10.5 Aframax - Market size and forecast 2025-2030

Chart on Aframax - Market size and forecast 2025-2030 ($ million)
Data Table on Aframax - Market size and forecast 2025-2030 ($ million)
Chart on Aframax - Year-over-year growth 2025-2030 (%)
Data Table on Aframax - Year-over-year growth 2025-2030 (%)

10.6 Others - Market size and forecast 2025-2030

Chart on Others - Market size and forecast 2025-2030 ($ million)
Data Table on Others - Market size and forecast 2025-2030 ($ million)
Chart on Others - Year-over-year growth 2025-2030 (%)
Data Table on Others - Year-over-year growth 2025-2030 (%)

10.7 Market opportunity by Product Type

Market opportunity by Product Type ($ million)
Data Table on Market opportunity by Product Type ($ million)

11. Customer Landscape

11.1 Customer landscape overview

Analysis of price sensitivity, lifecycle, customer purchase basket, adoption rates, and purchase criteria

12. Geographic Landscape

12.1 Geographic segmentation

Chart on Market share by geography 2025-2030 (%)
Data Table on Market share by geography 2025-2030 (%)

12.2 Geographic comparison

Chart on Geographic comparison
Data Table on Geographic comparison

12.3 APAC - Market size and forecast 2025-2030

Chart on APAC - Market size and forecast 2025-2030 ($ million)
Data Table on APAC - Market size and forecast 2025-2030 ($ million)
Chart on APAC - Year-over-year growth 2025-2030 (%)
Data Table on APAC - Year-over-year growth 2025-2030 (%)
Chart on Regional Comparison - APAC
Data Table on Regional Comparison - APAC

12.3.1 China - Market size and forecast 2025-2030

Chart on China - Market size and forecast 2025-2030 ($ million)
Data Table on China - Market size and forecast 2025-2030 ($ million)
Chart on China - Year-over-year growth 2025-2030 (%)
Data Table on China - Year-over-year growth 2025-2030 (%)

12.3.2 Japan - Market size and forecast 2025-2030

Chart on Japan - Market size and forecast 2025-2030 ($ million)
Data Table on Japan - Market size and forecast 2025-2030 ($ million)
Chart on Japan - Year-over-year growth 2025-2030 (%)
Data Table on Japan - Year-over-year growth 2025-2030 (%)

12.3.3 South Korea - Market size and forecast 2025-2030

Chart on South Korea - Market size and forecast 2025-2030 ($ million)
Data Table on South Korea - Market size and forecast 2025-2030 ($ million)
Chart on South Korea - Year-over-year growth 2025-2030 (%)
Data Table on South Korea - Year-over-year growth 2025-2030 (%)

12.3.4 India - Market size and forecast 2025-2030

Chart on India - Market size and forecast 2025-2030 ($ million)
Data Table on India - Market size and forecast 2025-2030 ($ million)
Chart on India - Year-over-year growth 2025-2030 (%)
Data Table on India - Year-over-year growth 2025-2030 (%)

12.3.5 Australia - Market size and forecast 2025-2030

Chart on Australia - Market size and forecast 2025-2030 ($ million)
Data Table on Australia - Market size and forecast 2025-2030 ($ million)
Chart on Australia - Year-over-year growth 2025-2030 (%)
Data Table on Australia - Year-over-year growth 2025-2030 (%)

12.3.6 Singapore - Market size and forecast 2025-2030

Chart on Singapore - Market size and forecast 2025-2030 ($ million)
Data Table on Singapore - Market size and forecast 2025-2030 ($ million)
Chart on Singapore - Year-over-year growth 2025-2030 (%)
Data Table on Singapore - Year-over-year growth 2025-2030 (%)

12.4 Europe - Market size and forecast 2025-2030

Chart on Europe - Market size and forecast 2025-2030 ($ million)
Data Table on Europe - Market size and forecast 2025-2030 ($ million)
Chart on Europe - Year-over-year growth 2025-2030 (%)
Data Table on Europe - Year-over-year growth 2025-2030 (%)
Chart on Regional Comparison - Europe
Data Table on Regional Comparison - Europe

12.4.1 UK - Market size and forecast 2025-2030

Chart on UK - Market size and forecast 2025-2030 ($ million)
Data Table on UK - Market size and forecast 2025-2030 ($ million)
Chart on UK - Year-over-year growth 2025-2030 (%)
Data Table on UK - Year-over-year growth 2025-2030 (%)

12.4.2 Norway - Market size and forecast 2025-2030

Chart on Norway - Market size and forecast 2025-2030 ($ million)
Data Table on Norway - Market size and forecast 2025-2030 ($ million)
Chart on Norway - Year-over-year growth 2025-2030 (%)
Data Table on Norway - Year-over-year growth 2025-2030 (%)

12.4.3 Spain - Market size and forecast 2025-2030

Chart on Spain - Market size and forecast 2025-2030 ($ million)
Data Table on Spain - Market size and forecast 2025-2030 ($ million)
Chart on Spain - Year-over-year growth 2025-2030 (%)
Data Table on Spain - Year-over-year growth 2025-2030 (%)

12.4.4 France - Market size and forecast 2025-2030

Chart on France - Market size and forecast 2025-2030 ($ million)
Data Table on France - Market size and forecast 2025-2030 ($ million)
Chart on France - Year-over-year growth 2025-2030 (%)
Data Table on France - Year-over-year growth 2025-2030 (%)

12.4.5 The Netherlands - Market size and forecast 2025-2030

Chart on The Netherlands - Market size and forecast 2025-2030 ($ million)
Data Table on The Netherlands - Market size and forecast 2025-2030 ($ million)
Chart on The Netherlands - Year-over-year growth 2025-2030 (%)
Data Table on The Netherlands - Year-over-year growth 2025-2030 (%)

12.4.6 Italy - Market size and forecast 2025-2030

Chart on Italy - Market size and forecast 2025-2030 ($ million)
Data Table on Italy - Market size and forecast 2025-2030 ($ million)
Chart on Italy - Year-over-year growth 2025-2030 (%)
Data Table on Italy - Year-over-year growth 2025-2030 (%)

12.5 North America - Market size and forecast 2025-2030

Chart on North America - Market size and forecast 2025-2030 ($ million)
Data Table on North America - Market size and forecast 2025-2030 ($ million)
Chart on North America - Year-over-year growth 2025-2030 (%)
Data Table on North America - Year-over-year growth 2025-2030 (%)
Chart on Regional Comparison - North America
Data Table on Regional Comparison - North America

12.5.1 US - Market size and forecast 2025-2030

Chart on US - Market size and forecast 2025-2030 ($ million)
Data Table on US - Market size and forecast 2025-2030 ($ million)
Chart on US - Year-over-year growth 2025-2030 (%)
Data Table on US - Year-over-year growth 2025-2030 (%)

12.5.2 Canada - Market size and forecast 2025-2030

Chart on Canada - Market size and forecast 2025-2030 ($ million)
Data Table on Canada - Market size and forecast 2025-2030 ($ million)
Chart on Canada - Year-over-year growth 2025-2030 (%)
Data Table on Canada - Year-over-year growth 2025-2030 (%)

12.5.3 Mexico - Market size and forecast 2025-2030

Chart on Mexico - Market size and forecast 2025-2030 ($ million)
Data Table on Mexico - Market size and forecast 2025-2030 ($ million)
Chart on Mexico - Year-over-year growth 2025-2030 (%)
Data Table on Mexico - Year-over-year growth 2025-2030 (%)

12.6 South America - Market size and forecast 2025-2030

Chart on South America - Market size and forecast 2025-2030 ($ million)
Data Table on South America - Market size and forecast 2025-2030 ($ million)
Chart on South America - Year-over-year growth 2025-2030 (%)
Data Table on South America - Year-over-year growth 2025-2030 (%)
Chart on Regional Comparison - South America
Data Table on Regional Comparison - South America

12.6.1 Brazil - Market size and forecast 2025-2030

Chart on Brazil - Market size and forecast 2025-2030 ($ million)
Data Table on Brazil - Market size and forecast 2025-2030 ($ million)
Chart on Brazil - Year-over-year growth 2025-2030 (%)
Data Table on Brazil - Year-over-year growth 2025-2030 (%)

12.6.2 Argentina - Market size and forecast 2025-2030

Chart on Argentina - Market size and forecast 2025-2030 ($ million)
Data Table on Argentina - Market size and forecast 2025-2030 ($ million)
Chart on Argentina - Year-over-year growth 2025-2030 (%)
Data Table on Argentina - Year-over-year growth 2025-2030 (%)

12.6.3 Colombia - Market size and forecast 2025-2030

Chart on Colombia - Market size and forecast 2025-2030 ($ million)
Data Table on Colombia - Market size and forecast 2025-2030 ($ million)
Chart on Colombia - Year-over-year growth 2025-2030 (%)
Data Table on Colombia - Year-over-year growth 2025-2030 (%)

12.7 Middle East and Africa - Market size and forecast 2025-2030

Chart on Middle East and Africa - Market size and forecast 2025-2030 ($ million)
Data Table on Middle East and Africa - Market size and forecast 2025-2030 ($ million)
Chart on Middle East and Africa - Year-over-year growth 2025-2030 (%)
Data Table on Middle East and Africa - Year-over-year growth 2025-2030 (%)
Chart on Regional Comparison - Middle East and Africa
Data Table on Regional Comparison - Middle East and Africa

12.7.1 Qatar - Market size and forecast 2025-2030

Chart on Qatar - Market size and forecast 2025-2030 ($ million)
Data Table on Qatar - Market size and forecast 2025-2030 ($ million)
Chart on Qatar - Year-over-year growth 2025-2030 (%)
Data Table on Qatar - Year-over-year growth 2025-2030 (%)

12.7.2 UAE - Market size and forecast 2025-2030

Chart on UAE - Market size and forecast 2025-2030 ($ million)
Data Table on UAE - Market size and forecast 2025-2030 ($ million)
Chart on UAE - Year-over-year growth 2025-2030 (%)
Data Table on UAE - Year-over-year growth 2025-2030 (%)

12.7.3 Nigeria - Market size and forecast 2025-2030

Chart on Nigeria - Market size and forecast 2025-2030 ($ million)
Data Table on Nigeria - Market size and forecast 2025-2030 ($ million)
Chart on Nigeria - Year-over-year growth 2025-2030 (%)
Data Table on Nigeria - Year-over-year growth 2025-2030 (%)

12.7.4 Algeria - Market size and forecast 2025-2030

Chart on Algeria - Market size and forecast 2025-2030 ($ million)
Data Table on Algeria - Market size and forecast 2025-2030 ($ million)
Chart on Algeria - Year-over-year growth 2025-2030 (%)
Data Table on Algeria - Year-over-year growth 2025-2030 (%)

12.7.5 Saudi Arabia - Market size and forecast 2025-2030

Chart on Saudi Arabia - Market size and forecast 2025-2030 ($ million)
Data Table on Saudi Arabia - Market size and forecast 2025-2030 ($ million)
Chart on Saudi Arabia - Year-over-year growth 2025-2030 (%)
Data Table on Saudi Arabia - Year-over-year growth 2025-2030 (%)

12.8 Market opportunity by geography

Market opportunity by geography ($ million)
Data Tables on Market opportunity by geography ($ million)

13. Drivers, Challenges, and Opportunity

13.1 Market drivers

Geopolitical realignment and elongation of maritime trade routes
Resilient global energy demand and downstream refinery expansions
Accelerated fleet modernization and environmental regulatory compliance

13.2 Market challenges

Escalating regulatory compliance and decarbonization mandates
Severe financial volatility and elevated asset costs
Geopolitical disruptions and maritime infrastructure insecurity

13.3 Impact of drivers and challenges

Impact of drivers and challenges in 2025 and 2030

13.4 Market opportunities

Proactive adoption of AI and digital voyage optimization systems
Fleet renewal programs and capital commitments to eco-efficient dual-fuel propulsion systems
Structural reconfiguration of trading route patterns and regional asset allocations

14. Competitive Landscape

14.1 Overview

14.2

Overview on criticality of inputs and factors of differentiation

14.3 Landscape disruption

Overview on factors of disruption

14.4 Industry risks

Impact of key risks on business

15. Competitive Analysis

15.1 Companies profiled

Companies covered

15.2 Company ranking index

15.3 Market positioning of companies

Matrix on companies position and classification

15.4 Bahri

Bahri - Overview
Bahri - Business segments
Bahri - Key offerings
Bahri - Segment focus
SWOT

15.5 CMB.TECH NV

CMB.TECH NV - Overview
CMB.TECH NV - Business segments
CMB.TECH NV - Key offerings
CMB.TECH NV - Segment focus
SWOT

15.6 COSCO Shipping Ports Ltd.

COSCO Shipping Ports Ltd. - Overview
COSCO Shipping Ports Ltd. - Business segments
COSCO Shipping Ports Ltd. - Key offerings
COSCO Shipping Ports Ltd. - Segment focus
SWOT

15.7 DHT Holdings Inc.

DHT Holdings Inc. - Overview
DHT Holdings Inc. - Product / Service
DHT Holdings Inc. - Key offerings
SWOT

15.8 Eastern Pacific Shipping

Eastern Pacific Shipping - Overview
Eastern Pacific Shipping - Product / Service
Eastern Pacific Shipping - Key offerings
SWOT

15.9 Frontline plc

Frontline plc - Overview
Frontline plc - Product / Service
Frontline plc - Key offerings
SWOT

15.10 IINO Kaiun Kaisha Ltd.

IINO Kaiun Kaisha Ltd. - Overview
IINO Kaiun Kaisha Ltd. - Product / Service
IINO Kaiun Kaisha Ltd. - Key offerings
SWOT

15.11 International Seaways Inc.

International Seaways Inc. - Overview
International Seaways Inc. - Business segments
International Seaways Inc. - Key offerings
International Seaways Inc. - Segment focus
SWOT

15.12 MAERSK TANKERS AS

MAERSK TANKERS AS - Overview
MAERSK TANKERS AS - Product / Service
MAERSK TANKERS AS - Key offerings
SWOT

15.13 Mitsui O.S.K. Lines Ltd.

Mitsui O.S.K. Lines Ltd. - Overview
Mitsui O.S.K. Lines Ltd. - Business segments
Mitsui O.S.K. Lines Ltd. - Key offerings
Mitsui O.S.K. Lines Ltd. - Segment focus
SWOT

15.14 Odfjell SE

Odfjell SE - Overview
Odfjell SE - Product / Service
Odfjell SE - Key offerings
SWOT

15.15 Petroliam Nasional Berhad

Petroliam Nasional Berhad - Overview
Petroliam Nasional Berhad - Business segments
Petroliam Nasional Berhad - Key offerings
Petroliam Nasional Berhad - Segment focus
SWOT

15.16 Stolt Nielsen Ltd.

Stolt Nielsen Ltd. - Overview
Stolt Nielsen Ltd. - Business segments
Stolt Nielsen Ltd. - Key offerings
Stolt Nielsen Ltd. - Segment focus
SWOT

15.17 Teekay Corp.

Teekay Corp. - Overview
Teekay Corp. - Product / Service
Teekay Corp. - Key offerings
SWOT

15.18 UltraTank

UltraTank - Overview
UltraTank - Product / Service
UltraTank - Key offerings
SWOT

16. Appendix

16.1 Scope of the report

Market definition
Objectives
Notes and caveats

16.2 Inclusions and exclusions checklist

Inclusions checklist
Exclusions checklist

16.3 Currency conversion rates for US$

16.4 Research methodology

16.5 Data procurement

Information sources

16.6 Data validation

16.7 Validation techniques employed for market sizing

16.8 Data synthesis

16.9 360 degree market analysis

16.10 List of abbreviations

Research Methodology

Technavio presents a detailed picture of the market by way of study, synthesis, and summation of data from multiple sources. The analysts have presented the various facets of the market with a particular focus on identifying the key industry influencers. The data thus presented is comprehensive, reliable, and the result of extensive research, both primary and secondary.

INFORMATION SOURCES

Primary sources

  • Manufacturers and suppliers
  • Channel partners
  • Industry experts
  • Strategic decision makers

Secondary sources

  • Industry journals and periodicals
  • Government data
  • Financial reports of key industry players
  • Historical data
  • Press releases

DATA ANALYSIS

Data Synthesis

  • Collation of data
  • Estimation of key figures
  • Analysis of derived insights

Data Validation

  • Triangulation with data models
  • Reference against proprietary databases
  • Corroboration with industry experts

REPORT WRITING

Qualitative

  • Market drivers
  • Market challenges
  • Market trends
  • Five forces analysis

Quantitative

  • Market size and forecast
  • Market segmentation
  • Geographical insights
  • Competitive landscape

Interested in this report?

Get your sample now to see our research methodology and insights!

Download Now

Frequently Asked Questions

Tanker Shipping market growth will increase by USD 19240.5 million during 2026-2030.

The Tanker Shipping market is expected to grow at a CAGR of 8.1% during 2026-2030.

Tanker Shipping market is segmented by Type (Oil tankers, Liquid gas tankers, Chemical tankers) Mode of transportation (Deep sea, Coastal, Inland) Product type (VLCC and ULCC, Suezmax, Aframax, Others)

Bahri, Capital Ship Management Corp., CMB.TECH NV, COSCO Shipping Ports Ltd., DHT Holdings Inc., Eastern Pacific Shipping, Frontline plc, IINO Kaiun Kaisha Ltd., International Seaways Inc., MAERSK TANKERS AS, Maran Tankers Management Inc., Mitsui O.S.K. Lines Ltd., Odfjell SE, Petroliam Nasional Berhad, SFL Corp. Ltd., Sovcomflot, Stolt Nielsen Ltd., Teekay Corp., Tsakos Energy Navigation Ltd., UltraTank are a few of the key vendors in the Tanker Shipping market.

APAC will register the highest growth rate of 48.5% among the other regions. Therefore, the Tanker Shipping market in APAC is expected to garner significant business opportunities for the vendors during the forecast period.

China, Japan, South Korea, India, Australia, Singapore, UK, Norway, Spain, France, The Netherlands, Italy, US, Canada, Mexico, Brazil, Argentina, Colombia, Qatar, UAE, Nigeria, Algeria, Saudi Arabia

  • Geopolitical realignment and elongation of maritime trade routes is the driving factor this market.

The Tanker Shipping market vendors should focus on grabbing business opportunities from the Type segment as it accounted for the largest market share in the base year.
RIA - Research AI Assistant
Ask RIA
