
Team Collaboration Software Market Size 2026-2030
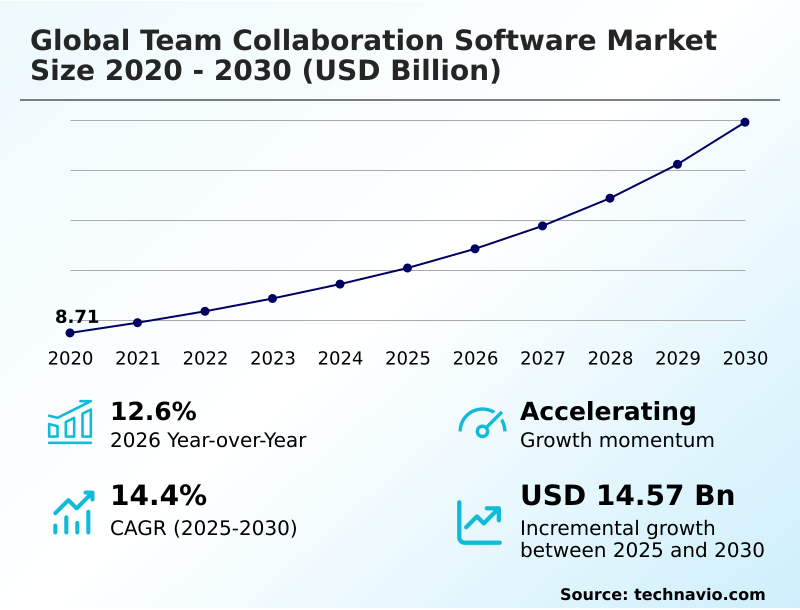
The team collaboration software market size is valued to increase by USD 14.57 billion, at a CAGR of 14.4% from 2025 to 2030. Enduring shift to remote and hybrid work models will drive the team collaboration software market.
Major Market Trends & Insights
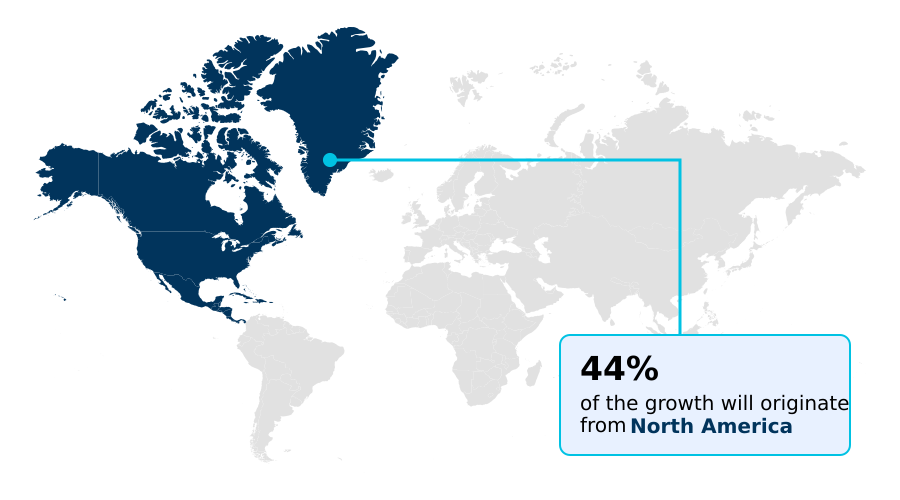
- North America dominated the market and accounted for a 43.5% growth during the forecast period.
- By Deployment - Cloud-based segment was valued at USD 9.03 billion in 2024
- By End-user - IT and telecommunications segment accounted for the largest market revenue share in 2024
Market Size & Forecast
- Market Opportunities: USD 21.07 billion
- Market Future Opportunities: USD 14.57 billion
- CAGR from 2025 to 2030 : 14.4%
Market Summary
- The team collaboration software market is undergoing a significant transformation, driven by the imperative for operational efficiency and the sustained shift toward distributed workforces. These platforms serve as the connective tissue for modern enterprises, enabling real-time document co-editing, agile project tracking, and unified communications as a service.
- A key trend is the integration of ai-powered task automation, which helps organizations streamline complex workflows and reduce manual overhead.
- For instance, a global manufacturing firm can use a platform for cross-functional project coordination between its design, supply chain, and production teams across different continents, using a centralized knowledge repository to ensure all stakeholders have access to the latest information, thereby accelerating the product development lifecycle. However, the market is not without its challenges.
- The need for enterprise-grade security features to protect against cyber threats and ensure data residency compliance is paramount. Companies must navigate this complex landscape by selecting platforms that offer not only robust functionality but also advanced security measures such as end-to-end data encryption and comprehensive audit logs.
- The evolution is toward a unified digital workspace that is secure, intelligent, and deeply integrated into the core processes of the business.
What will be the Size of the Team Collaboration Software Market during the forecast period?
Get Key Insights on Market Forecast (PDF) Get Free Sample
How is the Team Collaboration Software Market Segmented?
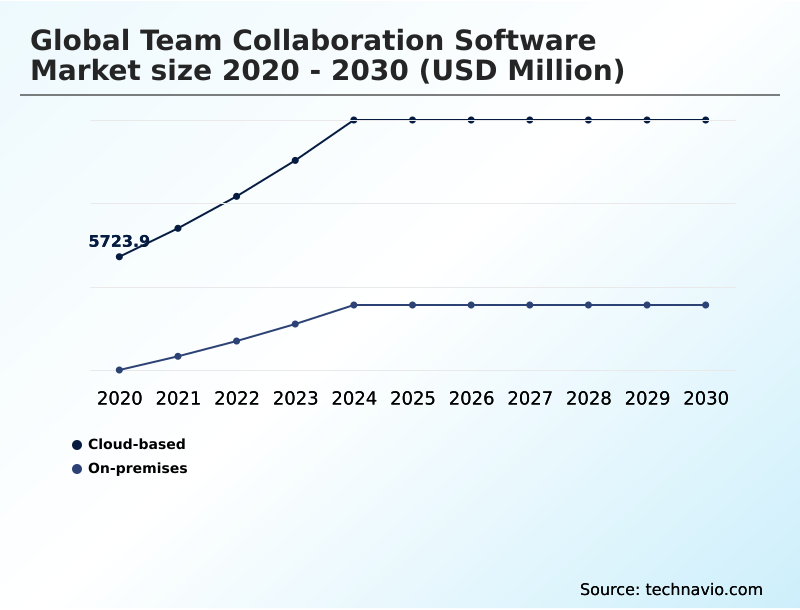
The team collaboration software industry research report provides comprehensive data (region-wise segment analysis), with forecasts and estimates in "USD million" for the period 2026-2030, as well as historical data from 2020-2024 for the following segments.
- Deployment
- Cloud-based
- On-premises
- End-user
- IT and telecommunications
- BFSI
- Retail
- Healthcare
- Others
- Business segment
- Large enterprise
- SMEs
- Geography
- North America
- US
- Canada
- Mexico
- APAC
- China
- Japan
- India
- Europe
- Germany
- UK
- France
- South America
- Brazil
- Argentina
- Middle East and Africa
- Saudi Arabia
- UAE
- South Africa
- Rest of World (ROW)
- North America
By Deployment Insights
The cloud-based segment is estimated to witness significant growth during the forecast period.
The cloud-based software model represents the dominant deployment method, offering substantial operational agility. This model facilitates business continuity assurance and allows organizations to circumvent significant upfront capital expenditure.
A key value proposition is its inherent scalability, enabling seamless adjustment of user licenses and features, which is critical for remote and hybrid work models.
Ubiquitous access to a centralized knowledge repository and a unified digital workspace from any location is essential for supporting distributed teams. The provider-managed nature of the cloud model, including enterprise-grade security features, reduces the administrative burden on internal IT departments.
Adopting a cloud-based extensible platform architecture has been shown to improve user adoption improvement by up to 30% due to its accessibility and ease of use.
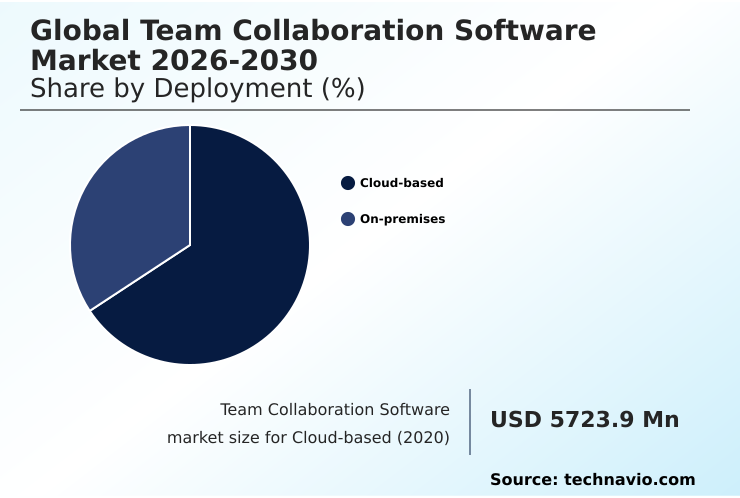
The Cloud-based segment was valued at USD 9.03 billion in 2024 and showed a gradual increase during the forecast period.
Regional Analysis
North America is estimated to contribute 43.5% to the growth of the global market during the forecast period.Technavio’s analysts have elaborately explained the regional trends and drivers that shape the market during the forecast period.
See How Team Collaboration Software Market Demand is Rising in North America Get Free Sample
The geographic landscape of the market is led by North America, which accounts for over 43% of the market, driven by high technological maturity and the prevalence of remote and hybrid work models.
Organizations in this region prioritize digital workflow integration and enterprise-grade security features. The APAC region, contributing over 26% to the market, is the fastest-growing segment, fueled by rapid digitalization and the adoption of mobile-first collaboration solutions.
In Europe, there is a strong emphasis on data residency compliance and in-country data residency, leading to a preference for providers that can guarantee data sovereignty.
South America and the Middle East and Africa are emerging markets, with increasing investment in digital infrastructure fostering adoption, particularly solutions that support agile methodology support and offer freemium pricing models to lower the barrier to entry.
Market Dynamics
Our researchers analyzed the data with 2025 as the base year, along with the key drivers, trends, and challenges. A holistic analysis of drivers will help companies refine their marketing strategies to gain a competitive advantage.
- Achieving strategic business outcomes hinges on improving roi through collaboration tools, a process that extends beyond simple communication to encompass the entire operational fabric of an enterprise. Effective platforms are central to managing compliance with collaboration software, especially for cross-functional collaboration in large enterprises that must navigate complex regulatory landscapes.
- For industries like finance and healthcare, securing financial data in chat and ensuring collaboration software for healthcare compliance are non-negotiable. This involves choosing between cloud and on-premises solutions based on security needs and customizing workflows in collaboration tools for specific processes.
- The rise of ai has shifted the focus toward enhancing productivity with ai features and using analytics to optimize teamwork. Automating workflows in project management and managing project dependencies with software are now standard expectations. For development teams, collaboration tools for agile teams that allow real-time collaboration on design projects are essential.
- The goal is to create a unified ecosystem, often by integrating crm with collaboration platforms, which can reduce lead response times by more than double compared to siloed approaches. This integration is key to overcoming data silos with software. The challenge also extends to mobile collaboration for frontline workers and incorporating virtual team building features to foster culture.
- Ultimately, success depends on providing best practices for team adoption and reducing context switching at work, thereby securing data in remote work environments.
What are the key market drivers leading to the rise in the adoption of Team Collaboration Software Industry?
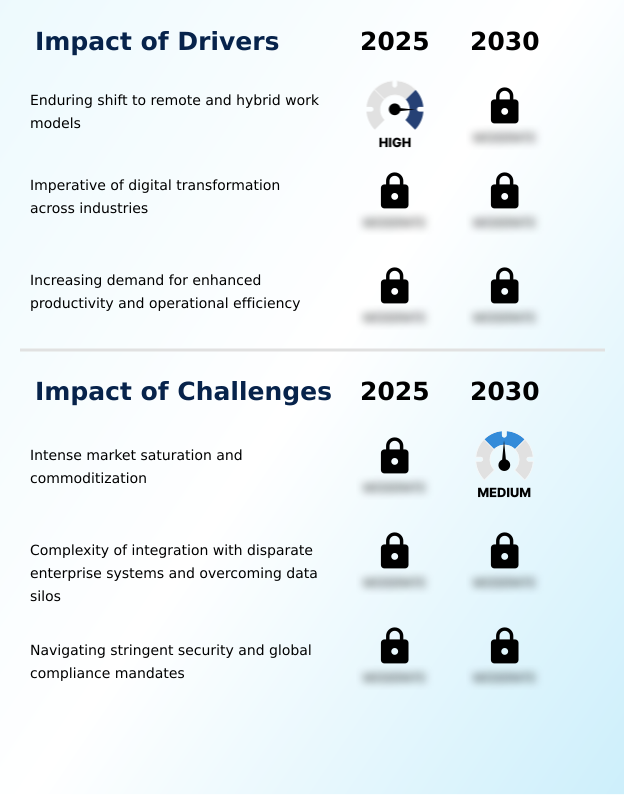
- The enduring shift toward remote and hybrid work models is a primary and persistent driver for the market.
- The fundamental restructuring of the workplace around remote and hybrid work models is a primary and persistent driver. This shift creates a continuous demand for technologies that bridge physical distances and serve as a single source of truth.
- Organizations adopting a digital transformation imperative are leveraging these platforms as foundational tools that underpin the entire initiative. Companies with fully integrated collaboration tools report a 20% faster project completion time.
- This enhanced productivity is a direct result of streamlined business workflows and better cross-functional project coordination. Furthermore, the relentless organizational focus on boosting operational efficiency gains, with effective platforms demonstrating a 15% reduction in operational overhead, ensures sustained market demand.
What are the market trends shaping the Team Collaboration Software Industry?
- A defining market characteristic is the accelerating integration of artificial intelligence and automation. This trend is evolving collaboration environments toward intelligent and predictive platforms.
- The market is rapidly evolving beyond basic communication, driven by the profound integration of artificial intelligence. This trend is manifesting as intelligent, predictive, and context-aware collaborative environments. Software providers are embedding sophisticated algorithms for ai-powered task automation, which has been shown to reduce administrative workloads by up to 40%.
- Predictive project analytics are leveraged to forecast timelines and enable proactive project bottleneck identification. The adoption of vertical-specific collaboration solution platforms is also accelerating, with user adoption improvement rates 25% higher than generic platforms due to purpose-built tool efficiency.
- Organizations in mature markets are actively seeking these advanced capabilities, including enterprise-grade security features and granular access controls, to gain a competitive edge through enhanced productivity.
What challenges does the Team Collaboration Software Industry face during its growth?
- Intense market saturation and the resulting commoditization of core features present a primary challenge for the industry.
- A primary challenge is the profound degree of market saturation and the resulting core feature commoditization. This hyper-competitive environment leads to a feature parity phenomenon, making it difficult to establish a durable advantage.
- Another significant hurdle is the complexity of achieving seamless enterprise system interoperability to overcome data silos; IT teams often spend up to 30% of their time managing disparate systems. Navigating the landscape of stringent security mandates and global compliance navigation is also a formidable challenge.
- The expanding cyber threat attack surface requires continuous investment in advanced threat detection and information lifecycle management. Failure to comply can result in fines exceeding 4% of annual revenue, making security a critical, non-negotiable aspect of any market strategy.
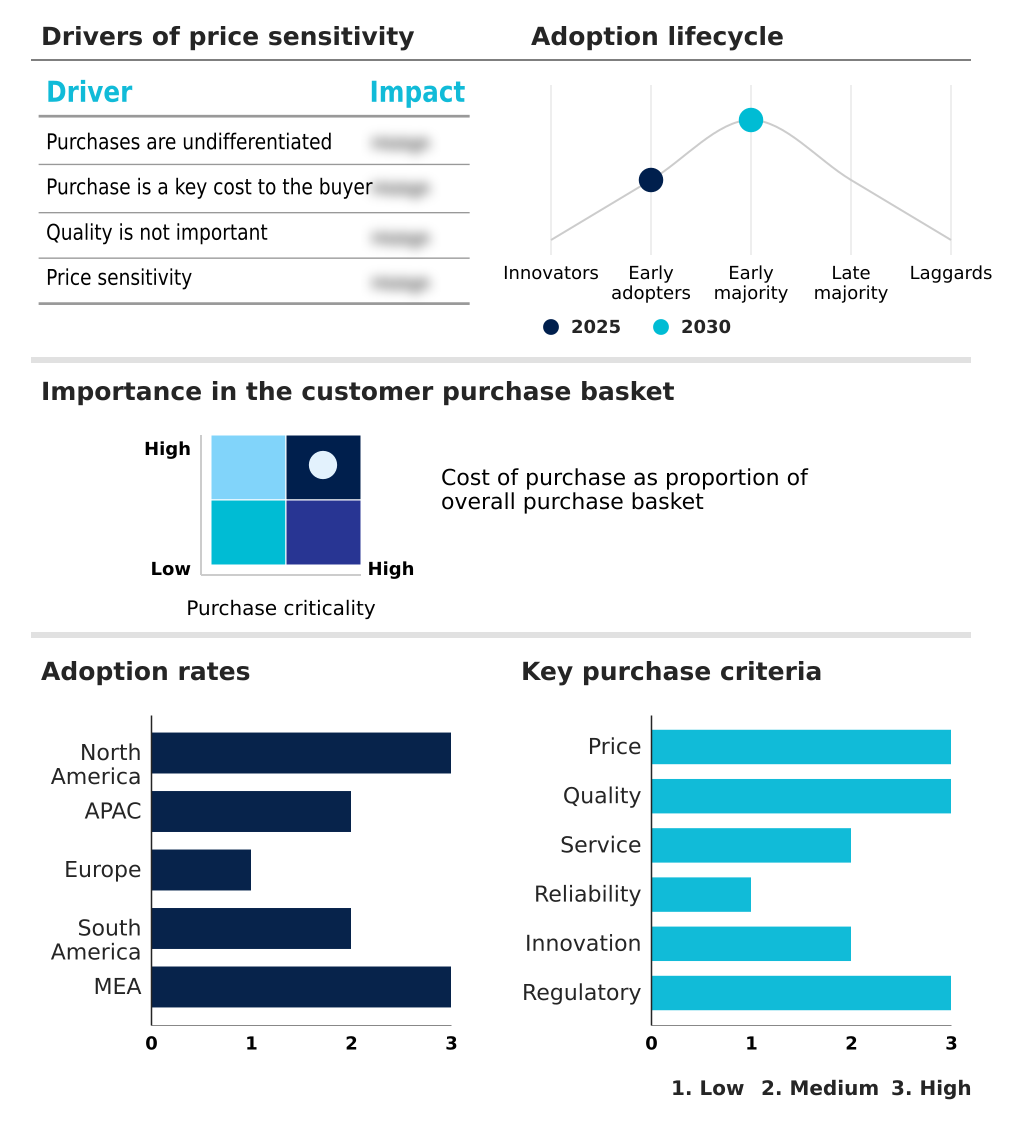
Exclusive Technavio Analysis on Customer Landscape
The team collaboration software market forecasting report includes the adoption lifecycle of the market, covering from the innovator’s stage to the laggard’s stage. It focuses on adoption rates in different regions based on penetration. Furthermore, the team collaboration software market report also includes key purchase criteria and drivers of price sensitivity to help companies evaluate and develop their market growth analysis strategies.
Customer Landscape of Team Collaboration Software Industry
Competitive Landscape
Companies are implementing various strategies, such as strategic alliances, team collaboration software market forecast, partnerships, mergers and acquisitions, geographical expansion, and product/service launches, to enhance their presence in the industry.
Adobe Inc. - Enabling agile project tracking and workflow automation, these platforms drive productivity and team synergy within a unified digital workspace.
The industry research and growth report includes detailed analyses of the competitive landscape of the market and information about key companies, including:
- Adobe Inc.
- Asana Inc.
- Atlassian Corp.
- Canva Pty Ltd.
- Cisco Systems Inc.
- ClickUp
- Google LLC
- Huawei Technologies Co. Ltd.
- Microsoft Corp.
- monday.com Ltd.
- Notion Labs Inc.
- Oracle Corp.
- Slack Technologies LLC
- Smartsheet Inc.
- Wrike Inc.
- Zoho Corp. Pvt. Ltd.
- Zoom Communications Inc.
Qualitative and quantitative analysis of companies has been conducted to help clients understand the wider business environment as well as the strengths and weaknesses of key industry players. Data is qualitatively analyzed to categorize companies as pure play, category-focused, industry-focused, and diversified; it is quantitatively analyzed to categorize companies as dominant, leading, strong, tentative, and weak.
Recent Development and News in Team collaboration software market
- In May, 2025, Zoom Communications Inc. introduced agentic AI capabilities for its AI Companion, rolling out over forty-five new skills and updates across its platform to automate tasks and improve productivity.
- In April, 2025, Microsoft Corp. updated its Teams AI library with new features, including agentic memory and advanced communication protocols, designed to create more responsive and context-aware automated agents within the Teams environment.
- In March, 2025, monday.com Ltd. announced the opening of a new research and development facility in Berlin, Germany, aimed at enhancing its collaboration software specifically for its European customer base.
- In February, 2025, Slack Technologies LLC entered a strategic partnership with Salesforce to facilitate the seamless integration of its communication platform with the latter's customer relationship management system, streamlining workflows for mutual clients.
Dive into Technavio’s robust research methodology, blending expert interviews, extensive data synthesis, and validated models for unparalleled Team Collaboration Software Market insights. See full methodology.
| Market Scope | |
|---|---|
| Page number | 300 |
| Base year | 2025 |
| Historic period | 2020-2024 |
| Forecast period | 2026-2030 |
| Growth momentum & CAGR | Accelerate at a CAGR of 14.4% |
| Market growth 2026-2030 | USD 14570.5 million |
| Market structure | Fragmented |
| YoY growth 2025-2026(%) | 12.6% |
| Key countries | US, Canada, Mexico, China, Japan, India, South Korea, Australia, Indonesia, Germany, UK, France, Italy, Spain, The Netherlands, Brazil, Argentina, Chile, Saudi Arabia, UAE, South Africa, Israel and Turkey |
| Competitive landscape | Leading Companies, Market Positioning of Companies, Competitive Strategies, and Industry Risks |
Research Analyst Overview
- The team collaboration software market is defined by its rapid evolution toward a unified digital workspace, where disparate functions converge into a single, intelligent environment. This is driven by the need for enterprise system interoperability and the reduction of context switching. Platforms are increasingly differentiated by workflow automation capabilities and predictive project analytics, moving beyond basic communication.
- A pivotal trend is the integration of ai-powered task automation and intelligent meeting scheduling, which are becoming standard expectations. Technologies such as automated meeting transcription, semantic search functionality, and sentiment analysis tools are creating more context-aware platforms.
- In the boardroom, the decision to invest in a platform with robust e-discovery and legal hold functions, comprehensive audit logs, and stringent data residency compliance is now directly linked to corporate risk management strategy. This is because platforms offering advanced data loss prevention and multi-factor authentication protocols can reduce the risk of compliance-related fines by over 40%.
- The market is also seeing a rise in vertical-specific collaboration solution offerings tailored for specific industry needs, alongside the convergence of enterprise telephony integration into unified communications as a service. This shift necessitates an extensible platform architecture that can support everything from asynchronous team interaction to persistent virtual workspaces and cross-functional project coordination.
What are the Key Data Covered in this Team Collaboration Software Market Research and Growth Report?
-
What is the expected growth of the Team Collaboration Software Market between 2026 and 2030?
-
USD 14.57 billion, at a CAGR of 14.4%
-
-
What segmentation does the market report cover?
-
The report is segmented by Deployment (Cloud-based, and On-premises), End-user (IT and telecommunications, BFSI, Retail, Healthcare, and Others), Business Segment (Large enterprise, and SMEs) and Geography (North America, APAC, Europe, South America, Middle East and Africa)
-
-
Which regions are analyzed in the report?
-
North America, APAC, Europe, South America and Middle East and Africa
-
-
What are the key growth drivers and market challenges?
-
Enduring shift to remote and hybrid work models, Intense market saturation and commoditization
-
-
Who are the major players in the Team Collaboration Software Market?
-
Adobe Inc., Asana Inc., Atlassian Corp., Canva Pty Ltd., Cisco Systems Inc., ClickUp, Google LLC, Huawei Technologies Co. Ltd., Microsoft Corp., monday.com Ltd., Notion Labs Inc., Oracle Corp., Slack Technologies LLC, Smartsheet Inc., Wrike Inc., Zoho Corp. Pvt. Ltd. and Zoom Communications Inc.
-
Market Research Insights
- Market dynamics are shaped by the strategic need for organizations to enhance productivity and achieve operational efficiency gains. The focus is on overcoming data silos and streamlining business workflows, which has become a digital transformation imperative. Procurement decisions are influenced less by price, with over 70% of buyers prioritizing platform security and integration capabilities over cost savings alone.
- This reflects a low tolerance for compromises on quality, as evidenced by a 95% renewal rate for platforms demonstrating robust global compliance navigation and data protection features.
- As a result, the market is seeing a push toward extensible platform architecture and purpose-built tool efficiency, which can deliver a return on investment of over 200% by reducing application sprawl and context switching.
We can help! Our analysts can customize this team collaboration software market research report to meet your requirements.
 RIA -
RIA - 
