Telecom Billing Revenue Management Market Analysis, Size, and Forecast 2026-2030: North America (US, Canada, and Mexico), Europe (Germany, UK, and France), APAC (China, India, and Japan), South America (Brazil, Argentina, and Colombia), Middle East and Africa (Saudi Arabia, UAE, and South Africa), and Rest of World (ROW)

Telecom Billing Revenue Management Market Analysis, Size, and Forecast 2026-2030:
North America (US, Canada, and Mexico), Europe (Germany, UK, and France), APAC (China, India, and Japan), South America (Brazil, Argentina, and Colombia), Middle East and Africa (Saudi Arabia, UAE, and South Africa), and Rest of World (ROW)

Published: Mar 2026 285 Pages SKU: IRTNTR75140

Market Overview at a Glance

$11.69 B
Market Opportunity
10.8%
CAGR 2025 - 2030
38.8%
North America Growth
$10.52 B
Software segment 2024

Telecom Billing Revenue Management Market Size 2026-2030

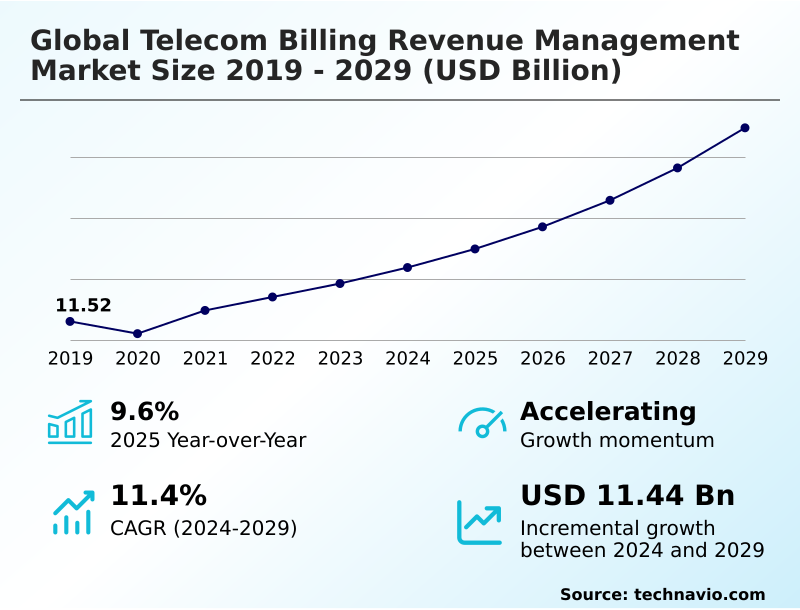
The telecom billing revenue management market size is valued to increase by USD 11.69 billion, at a CAGR of 10.8% from 2025 to 2030. Expanding telecommunication services will drive the telecom billing revenue management market.

Major Market Trends & Insights

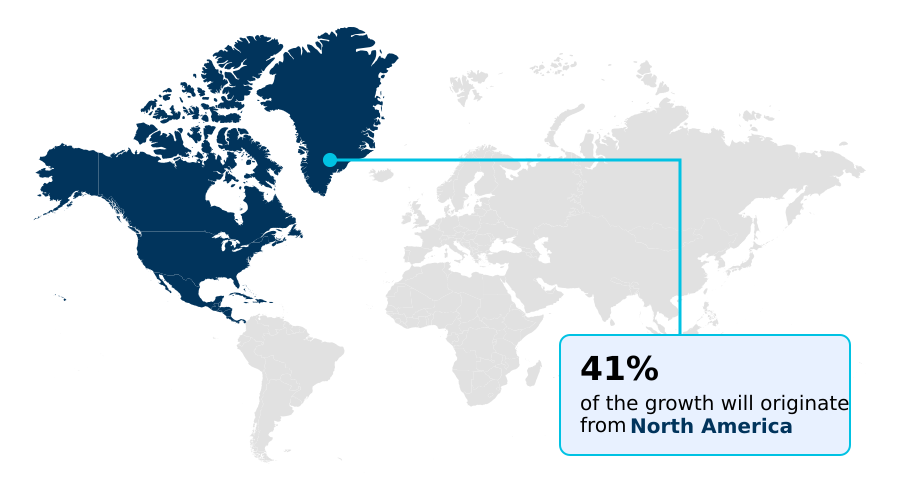
  • North America dominated the market and accounted for a 38.8% growth during the forecast period.
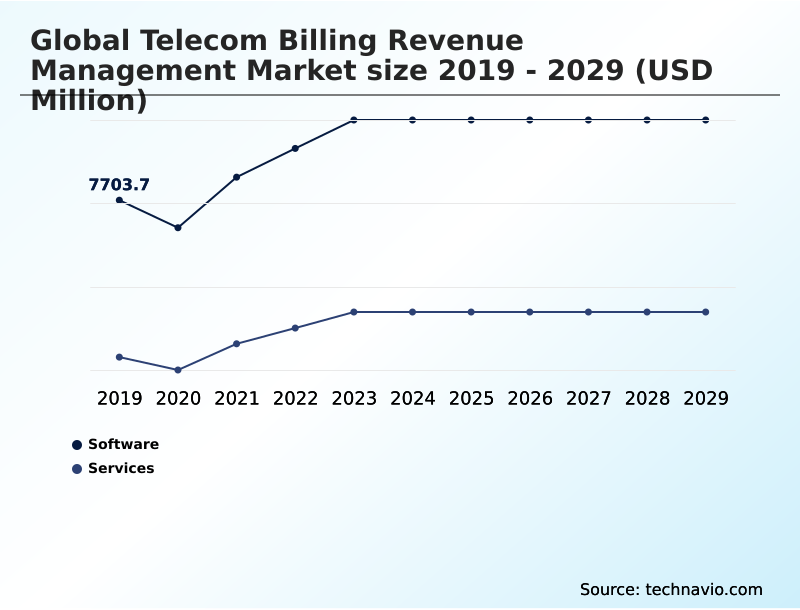
  • By Solution - Software segment was valued at USD 10.52 billion in 2024
  • By Deployment - On-premises segment accounted for the largest market revenue share in 2024

Market Size & Forecast

  • Market Opportunities: USD 18.63 billion
  • Market Future Opportunities: USD 11.69 billion
  • CAGR from 2025 to 2030 : 10.8%

Market Summary

  • The telecom billing revenue management market is undergoing a significant transformation, moving from legacy systems to agile, automated platforms. This evolution is essential for handling the complexities of modern digital ecosystems. The core of this shift lies in adopting convergent charging capabilities to manage diverse services under a unified framework, which is crucial for effective 5G monetization and IoT billing.
  • Advanced revenue assurance frameworks are being implemented to prevent revenue leakage, while real-time policy control allows operators to offer personalized services and manage network resources efficiently.
  • For instance, a communication service provider can leverage a digital monetization platform to launch a new network slice billing service for an enterprise client, a scenario that demands robust multi-partner settlement functionalities and automated revenue recognition. Success in this environment depends on a flexible BSS/OSS integration, often achieved through a cloud-native BSS architecture and API-driven billing.
  • These technologies enable operators to dynamically manage their service catalog, optimize the order-to-cash process, and implement sophisticated dunning management and credit risk assessment protocols to secure their revenue streams while improving the customer lifecycle management.

What will be the Size of the Telecom Billing Revenue Management Market during the forecast period?

Get Key Insights on Market Forecast (PDF) Request Free Sample

How is the Telecom Billing Revenue Management Market Segmented?

The telecom billing revenue management industry research report provides comprehensive data (region-wise segment analysis), with forecasts and estimates in "USD million" for the period 2026-2030, as well as historical data from 2020-2024 for the following segments.

  • Solution
    • Software
    • Services
  • Deployment
    • On-premises
    • Cloud
  • Type
    • Mobile network operators
    • Mobile virtual network operators
    • Mobile virtual network enablers
  • Geography
    • North America
      • US
      • Canada
      • Mexico
    • Europe
      • Germany
      • UK
      • France
    • APAC
      • China
      • India
      • Japan
    • South America
      • Brazil
      • Argentina
      • Colombia
    • Middle East and Africa
      • Saudi Arabia
      • UAE
      • South Africa
    • Rest of World (ROW)

By Solution Insights

The software segment is estimated to witness significant growth during the forecast period.

The software segment is foundational to the telecom billing revenue management market, providing the architecture for modern monetization. These platforms are evolving beyond simple invoicing to encompass comprehensive revenue assurance frameworks and support for complex digital service monetization.

Advanced solutions now integrate real-time policy control and enable dynamic pricing engines, which are critical for 5G monetization and IoT billing.

The adoption of cloud-native BSS and API-driven billing is accelerating, as operators seek agility in managing their service catalog and order-to-cash process.

Furthermore, the integration of sophisticated fraud management systems has proven to reduce fraudulent activities by over 15%, highlighting the software’s role in not just revenue collection but also protection, which is essential for B2B billing solutions and dunning management.

Request Free Sample

The Software segment was valued at USD 10.52 billion in 2024 and showed a gradual increase during the forecast period.

Request Free Sample

Regional Analysis

North America is estimated to contribute 38.8% to the growth of the global market during the forecast period.Technavio’s analysts have elaborately explained the regional trends and drivers that shape the market during the forecast period.

See How Telecom Billing Revenue Management Market Demand is Rising in North America Request Free Sample

The geographic landscape of the market is characterized by diverse regional priorities and growth trajectories. North America, with a market expansion rate of 11.1%, focuses on modernizing legacy systems to support advanced B2B billing solutions and enhance telecom data analytics.

In contrast, the APAC region is the fastest-growing, with a 12.3% growth rate, driven by massive 5G monetization efforts and the rapid adoption of cloud-native BSS.

Europe is steadily advancing, with an emphasis on compliance in telecom billing and the rollout of eSIM provisioning and billing. Across all regions, the demand for sophisticated telecom expense management and robust revenue leakage prevention tools is universal.

Operators globally are investing in partner settlement solutions and real-time charging systems to manage the increasing complexity of digital service ecosystems and secure their financial operations.

Market Dynamics

Our researchers analyzed the data with 2025 as the base year, along with the key drivers, trends, and challenges. A holistic analysis of drivers will help companies refine their marketing strategies to gain a competitive advantage.

  • Successfully navigating the evolving telecommunications landscape requires a deep understanding of how to implement convergent billing, which serves as the foundation for future growth. The cloud native BSS architecture benefits are a critical component, providing the agility needed to address the challenges in 5G network monetization.
  • To secure financial performance, operators must follow best practices for revenue assurance, which are central to reducing revenue leakage in telecom. Understanding the difference between BSS and OSS is key, as modern strategies focus on their seamless integration.
  • The impact of network slicing on billing is profound, demanding flexible systems where the policy and charging rules function becomes paramount for service differentiation. For instance, a system that effectively integrates billing with CRM systems often sees customer retention rates over 25% higher than systems that operate in silos.
  • This integration is essential for optimizing ARPU with dynamic pricing and applying advanced telecom fraud management techniques. Furthermore, leveraging complex event processing in billing allows for the creation of innovative services and business models. This is particularly true for a telecom billing system for MVNOs, which must be highly adaptable.
  • Using AI for churn prediction and enabling automated revenue recognition for subscription services are no longer optional but necessary for survival. The best B2B telecom billing solutions offer these capabilities, ensuring that billing data reconciliation is accurate and efficient.

What are the key market drivers leading to the rise in the adoption of Telecom Billing Revenue Management Industry?

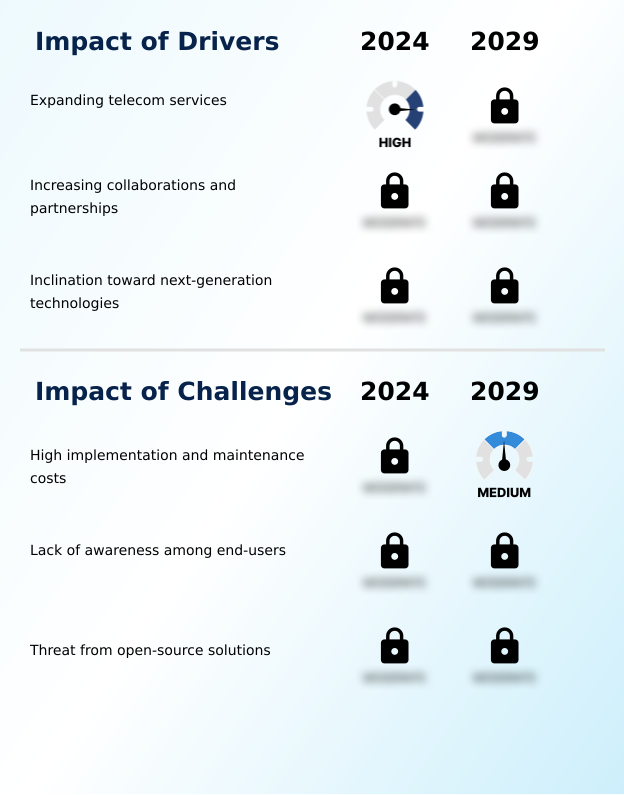
  • The expansion of telecommunication services, particularly the rollout of next-generation technologies, is a key driver for the market.

  • The market's primary driver is the relentless expansion of next-generation telecommunication services, which creates unprecedented complexity in monetization.
  • With operators allocating between 15% and 20% of their capital expenditure to 5G rollouts and the number of mobile subscribers projected to reach 6.5 billion globally, legacy systems are unable to cope.
  • This technological push necessitates a comprehensive BSS transformation toward platforms that can handle 5G billing solutions and intricate network monetization strategies.
  • The demand for digital monetization platforms is surging as operators seek to maximize ARPU through services built on complex usage rating and dynamic service bundle pricing, making advanced convergent billing systems an essential investment for growth.

What are the market trends shaping the Telecom Billing Revenue Management Industry?

  • A prominent market trend is the robust adoption of cloud solutions. This shift is driven by the need for scalable, flexible, and cost-efficient billing infrastructures.

  • A primary trend reshaping the market is the convergence of cloud computing and artificial intelligence to automate and optimize revenue operations. The robust adoption of cloud billing for telcos is driven by significant efficiency gains, with some operators achieving 30-40% reductions in total cost of ownership by migrating to cloud-native platforms.
  • This shift enables the deployment of automated invoicing systems and facilitates real-time policy enforcement at scale. Simultaneously, AI-powered telecom fraud detection is becoming integral, with deployments demonstrating the ability to reduce fraudulent activities by over 15%.
  • This trend extends to improving customer experience in billing through predictive analytics and personalized communication, supported by advanced BSS transformation initiatives and next-gen billing systems that offer greater flexibility and intelligence.

What challenges does the Telecom Billing Revenue Management Industry face during its growth?

  • High implementation and maintenance costs for billing systems present a key challenge affecting industry growth, especially for smaller operators.

  • A significant challenge restraining market adoption, particularly for smaller operators, is the high total cost of ownership associated with legacy on-premises systems and the complexity of modernization. Initial enterprise-grade implementations can require six-figure investments, creating a substantial barrier to entry.
  • Moreover, inaccuracies within outdated billing platforms cause operators to collectively lose approximately 7% of owed revenue, a problem that sophisticated billing data reconciliation and telecom expense management tools aim to solve. The complexities of dunning management and ensuring compliance in telecom billing add further operational overhead.
  • This financial pressure is compounded by the need for continuous system maintenance to handle evolving services, making the transition to more cost-effective and agile solutions a critical but challenging endeavor.

Exclusive Technavio Analysis on Customer Landscape

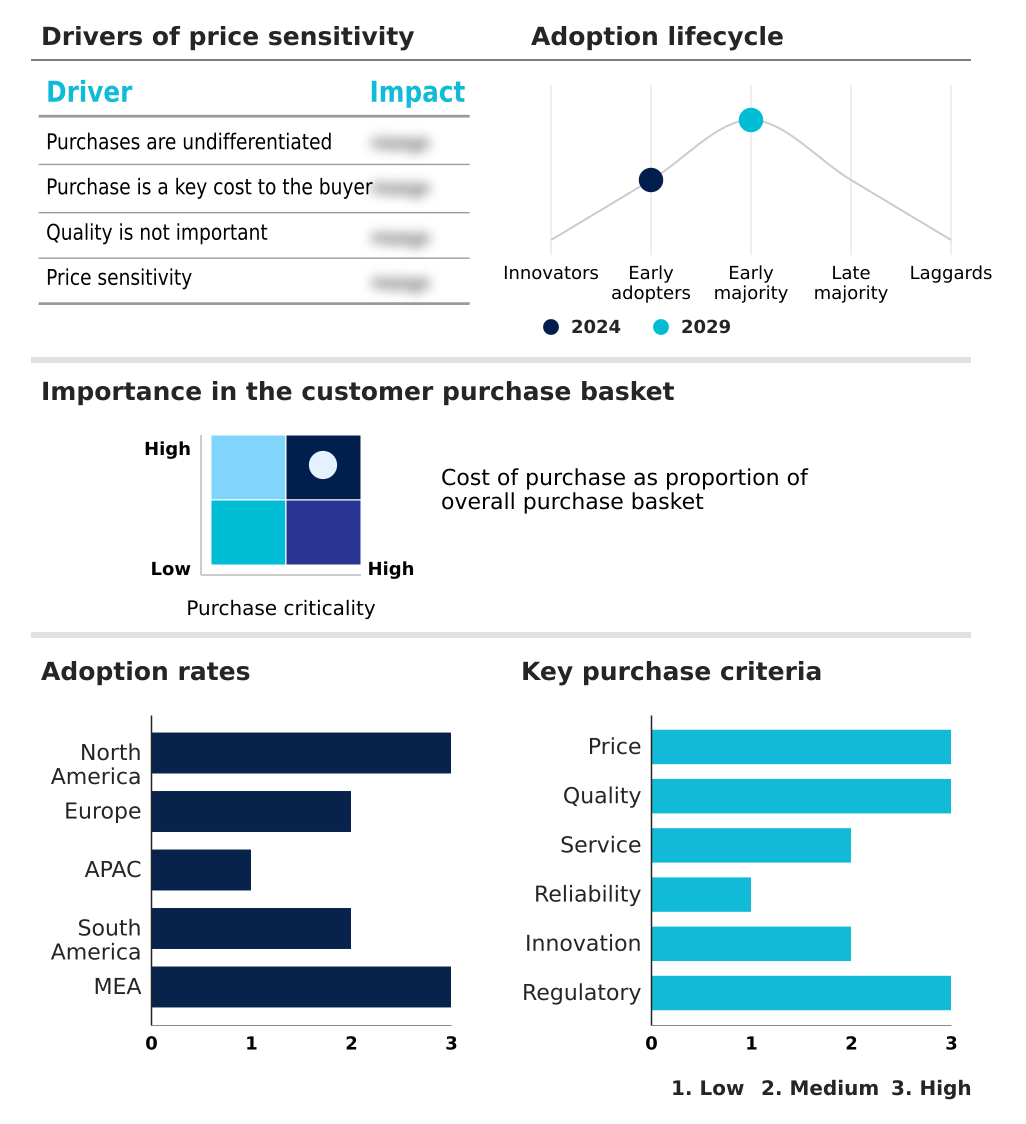
The telecom billing revenue management market forecasting report includes the adoption lifecycle of the market, covering from the innovator’s stage to the laggard’s stage. It focuses on adoption rates in different regions based on penetration. Furthermore, the telecom billing revenue management market report also includes key purchase criteria and drivers of price sensitivity to help companies evaluate and develop their market growth analysis strategies.

Customer Landscape of Telecom Billing Revenue Management Industry

Competitive Landscape

Companies are implementing various strategies, such as strategic alliances, telecom billing revenue management market forecast, partnerships, mergers and acquisitions, geographical expansion, and product/service launches, to enhance their presence in the industry.

Amdocs Ltd. - Converged billing and charging platforms are offered for robust service monetization, supporting comprehensive digital transformation initiatives.

The industry research and growth report includes detailed analyses of the competitive landscape of the market and information about key companies, including:

  • Amdocs Ltd.
  • Bill Perfect Inc.
  • BillingPlatform
  • Cerillion Plc
  • Comarch SA
  • CSG Systems International Inc.
  • Enghouse Systems Ltd.
  • Formula Telecom Solutions Ltd.
  • Huawei Technologies Co. Ltd.
  • Invoicera
  • MATRIXX Software
  • NetCracker Technology Corp.
  • Nexign Joint Stock Co.
  • OneBill Software Inc.
  • Optiva Inc.
  • Oracle Corp.
  • Rev.io.
  • Tecnotree Corp
  • Telefonaktiebolaget Ericsson
  • Teoco

Qualitative and quantitative analysis of companies has been conducted to help clients understand the wider business environment as well as the strengths and weaknesses of key industry players. Data is qualitatively analyzed to categorize companies as pure play, category-focused, industry-focused, and diversified; it is quantitatively analyzed to categorize companies as dominant, leading, strong, tentative, and weak.

Recent Development and News in Telecom billing revenue management market

  • In May, 2025, Amdocs Ltd. announced a strategic partnership with a major cloud provider to integrate its 5G-native monetization suite, enabling communication service providers to deploy cloud-based billing solutions with reduced TCO.
  • In March, 2025, CSG Systems International Inc. launched its new AI-powered revenue assurance platform, designed to reduce revenue leakage by up to 15% through real-time anomaly detection and predictive analytics.
  • In January, 2025, Oracle Corp. completed the acquisition of a niche cloud billing startup, enhancing its BSS/OSS portfolio with advanced microservices-based architecture for IoT and enterprise billing.
  • In November, 2024, Telefonaktiebolaget Ericsson expanded its digital BSS offerings in the APAC region, securing a major contract with a Southeast Asian operator to modernize their billing and charging systems for 5G readiness.

Dive into Technavio’s robust research methodology, blending expert interviews, extensive data synthesis, and validated models for unparalleled Telecom Billing Revenue Management Market insights. See full methodology.

Market Scope
Page number 285
Base year 2025
Historic period 2020-2024
Forecast period 2026-2030
Growth momentum & CAGR Accelerate at a CAGR of 10.8%
Market growth 2026-2030 USD 11694.7 million
Market structure Fragmented
YoY growth 2025-2026(%) 9.9%
Key countries US, Canada, Mexico, Germany, UK, France, Italy, Spain, The Netherlands, China, India, Japan, South Korea, Australia, Indonesia, Brazil, Argentina, Colombia, Saudi Arabia, UAE, South Africa, Israel and Turkey
Competitive landscape Leading Companies, Market Positioning of Companies, Competitive Strategies, and Industry Risks

Request Free Sample

Research Analyst Overview

  • The strategic imperative for telecom operators is the modernization of their monetization infrastructure, a move critical for survival and growth in the digital era. This involves a complete BSS/OSS integration overhaul, shifting toward a cloud-native BSS and API-driven billing architecture.
  • Such a transformation is the only way to effectively manage convergent charging for a diverse portfolio of services, including the complex requirements of 5G monetization and network slice billing. Boardroom decisions must prioritize investment in a flexible service catalog management system and a robust rating engine to support dynamic pricing engine models.
  • This enables not only ARPU maximization but also enhances customer lifecycle management. Implementing comprehensive revenue assurance frameworks, which include advanced fraud management systems and credit risk assessment, is non-negotiable for revenue leakage prevention.
  • By embracing this evolution and focusing on technologies that improve the entire order-to-cash process, from mediation platform to billing data reconciliation, operators can achieve over 30% TCO reductions and establish a foundation for sustained digital service monetization and innovation.

What are the Key Data Covered in this Telecom Billing Revenue Management Market Research and Growth Report?

  • What is the expected growth of the Telecom Billing Revenue Management Market between 2026 and 2030?

    • USD 11.69 billion, at a CAGR of 10.8%

  • What segmentation does the market report cover?

    • The report is segmented by Solution (Software, and Services), Deployment (On-premises, and Cloud), Type (Mobile network operators, Mobile virtual network operators, and Mobile virtual network enablers) and Geography (North America, Europe, APAC, South America, Middle East and Africa)

  • Which regions are analyzed in the report?

    • North America, Europe, APAC, South America and Middle East and Africa

  • What are the key growth drivers and market challenges?

    • Expanding telecommunication services, High implementation and maintenance costs

  • Who are the major players in the Telecom Billing Revenue Management Market?

    • Amdocs Ltd., Bill Perfect Inc., BillingPlatform, Cerillion Plc, Comarch SA, CSG Systems International Inc., Enghouse Systems Ltd., Formula Telecom Solutions Ltd., Huawei Technologies Co. Ltd., Invoicera, MATRIXX Software, NetCracker Technology Corp., Nexign Joint Stock Co., OneBill Software Inc., Optiva Inc., Oracle Corp., Rev.io., Tecnotree Corp, Telefonaktiebolaget Ericsson and Teoco

Market Research Insights

  • Market dynamics are increasingly shaped by the push for operational efficiency and enhanced customer experience in billing. The shift toward cloud billing for telcos is a clear trend, with some operators achieving 30-40% TCO reductions by migrating from complex on-premises systems.
  • This BSS transformation is critical, as legacy platform inaccuracies contribute to an approximate 7% loss of owed revenue across the industry, a significant challenge that modern telecom revenue assurance solutions aim to solve. Furthermore, the integration of AI into telecom fraud detection systems is proving effective, reducing fraudulent activities by over 15%.
  • This focus on automation and intelligence is reshaping everything from dunning process automation and billing dispute resolution to enabling new network monetization strategies, making next-gen billing systems central to competitive differentiation.

We can help! Our analysts can customize this telecom billing revenue management market research report to meet your requirements.

Get in touch

1. Executive Summary

1.1 Market overview

Executive Summary - Chart on Market Overview
Executive Summary - Data Table on Market Overview
Executive Summary - Chart on Global Market Characteristics
Executive Summary - Chart on Market by Geography
Executive Summary - Chart on Market Segmentation by Solution
Executive Summary - Chart on Market Segmentation by Deployment
Executive Summary - Chart on Market Segmentation by Type
Executive Summary - Chart on Incremental Growth
Executive Summary - Data Table on Incremental Growth
Executive Summary - Chart on Company Market Positioning

2. Technavio Analysis

2.1 Analysis of price sensitivity, lifecycle, customer purchase basket, adoption rates, and purchase criteria

2.2 Criticality of inputs and Factors of differentiation

Chart on Overview on criticality of inputs and factors of differentiation

2.3 Factors of disruption

Chart on Overview on factors of disruption

2.4 Impact of drivers and challenges

Chart on Impact of drivers and challenges in 2025 and 2030

3. Market Landscape

3.1 Market ecosystem

Chart on Parent Market
Data Table on - Parent Market

3.2 Market characteristics

Chart on Market characteristics analysis

3.3 Value chain analysis

Chart on Value chain analysis

4. Market Sizing

4.1 Market definition

Data Table on Offerings of companies included in the market definition

4.2 Market segment analysis

Market segments

4.3 Market size 2025

4.4 Market outlook: Forecast for 2025-2030

Chart on Global - Market size and forecast 2025-2030 ($ million)
Data Table on Global - Market size and forecast 2025-2030 ($ million)
Chart on Global Market: Year-over-year growth 2025-2030 (%)
Data Table on Global Market: Year-over-year growth 2025-2030 (%)

5. Historic Market Size

5.1 Global Telecom Billing Revenue Management Market 2020 - 2024

Historic Market Size - Data Table on Global Telecom Billing Revenue Management Market 2020 - 2024 ($ million)

5.2 Solution segment analysis 2020 - 2024

Historic Market Size - Solution Segment 2020 - 2024 ($ million)

5.3 Deployment segment analysis 2020 - 2024

Historic Market Size - Deployment Segment 2020 - 2024 ($ million)

5.4 Type segment analysis 2020 - 2024

Historic Market Size - Type Segment 2020 - 2024 ($ million)

5.5 Geography segment analysis 2020 - 2024

Historic Market Size - Geography Segment 2020 - 2024 ($ million)

5.6 Country segment analysis 2020 - 2024

Historic Market Size - Country Segment 2020 - 2024 ($ million)

6. Qualitative Analysis

6.1 The AI impact on Global Telecom Billing Revenue Management Market

7. Five Forces Analysis

7.1 Five forces summary

Five forces analysis - Comparison between 2025 and 2030

7.2 Bargaining power of buyers

Bargaining power of buyers - Impact of key factors 2025 and 2030

7.3 Bargaining power of suppliers

Bargaining power of suppliers - Impact of key factors in 2025 and 2030

7.4 Threat of new entrants

Threat of new entrants - Impact of key factors in 2025 and 2030

7.5 Threat of substitutes

Threat of substitutes - Impact of key factors in 2025 and 2030

7.6 Threat of rivalry

Threat of rivalry - Impact of key factors in 2025 and 2030

7.7 Market condition

Chart on Market condition - Five forces 2025 and 2030

8. Market Segmentation by Solution

8.1 Market segments

Chart on Solution - Market share 2025-2030 (%)
Data Table on Solution - Market share 2025-2030 (%)

8.2 Comparison by Solution

Chart on Comparison by Solution
Data Table on Comparison by Solution

8.3 Software - Market size and forecast 2025-2030

Chart on Software - Market size and forecast 2025-2030 ($ million)
Data Table on Software - Market size and forecast 2025-2030 ($ million)
Chart on Software - Year-over-year growth 2025-2030 (%)
Data Table on Software - Year-over-year growth 2025-2030 (%)

8.4 Services - Market size and forecast 2025-2030

Chart on Services - Market size and forecast 2025-2030 ($ million)
Data Table on Services - Market size and forecast 2025-2030 ($ million)
Chart on Services - Year-over-year growth 2025-2030 (%)
Data Table on Services - Year-over-year growth 2025-2030 (%)

8.5 Market opportunity by Solution

Market opportunity by Solution ($ million)
Data Table on Market opportunity by Solution ($ million)

9. Market Segmentation by Deployment

9.1 Market segments

Chart on Deployment - Market share 2025-2030 (%)
Data Table on Deployment - Market share 2025-2030 (%)

9.2 Comparison by Deployment

Chart on Comparison by Deployment
Data Table on Comparison by Deployment

9.3 On-premises - Market size and forecast 2025-2030

Chart on On-premises - Market size and forecast 2025-2030 ($ million)
Data Table on On-premises - Market size and forecast 2025-2030 ($ million)
Chart on On-premises - Year-over-year growth 2025-2030 (%)
Data Table on On-premises - Year-over-year growth 2025-2030 (%)

9.4 Cloud - Market size and forecast 2025-2030

Chart on Cloud - Market size and forecast 2025-2030 ($ million)
Data Table on Cloud - Market size and forecast 2025-2030 ($ million)
Chart on Cloud - Year-over-year growth 2025-2030 (%)
Data Table on Cloud - Year-over-year growth 2025-2030 (%)

9.5 Market opportunity by Deployment

Market opportunity by Deployment ($ million)
Data Table on Market opportunity by Deployment ($ million)

10. Market Segmentation by Type

10.1 Market segments

Chart on Type - Market share 2025-2030 (%)
Data Table on Type - Market share 2025-2030 (%)

10.2 Comparison by Type

Chart on Comparison by Type
Data Table on Comparison by Type

10.3 Mobile network operators - Market size and forecast 2025-2030

Chart on Mobile network operators - Market size and forecast 2025-2030 ($ million)
Data Table on Mobile network operators - Market size and forecast 2025-2030 ($ million)
Chart on Mobile network operators - Year-over-year growth 2025-2030 (%)
Data Table on Mobile network operators - Year-over-year growth 2025-2030 (%)

10.4 Mobile virtual network operators - Market size and forecast 2025-2030

Chart on Mobile virtual network operators - Market size and forecast 2025-2030 ($ million)
Data Table on Mobile virtual network operators - Market size and forecast 2025-2030 ($ million)
Chart on Mobile virtual network operators - Year-over-year growth 2025-2030 (%)
Data Table on Mobile virtual network operators - Year-over-year growth 2025-2030 (%)

10.5 Mobile virtual network enablers - Market size and forecast 2025-2030

Chart on Mobile virtual network enablers - Market size and forecast 2025-2030 ($ million)
Data Table on Mobile virtual network enablers - Market size and forecast 2025-2030 ($ million)
Chart on Mobile virtual network enablers - Year-over-year growth 2025-2030 (%)
Data Table on Mobile virtual network enablers - Year-over-year growth 2025-2030 (%)

10.6 Market opportunity by Type

Market opportunity by Type ($ million)
Data Table on Market opportunity by Type ($ million)

11. Customer Landscape

11.1 Customer landscape overview

Analysis of price sensitivity, lifecycle, customer purchase basket, adoption rates, and purchase criteria

12. Geographic Landscape

12.1 Geographic segmentation

Chart on Market share by geography 2025-2030 (%)
Data Table on Market share by geography 2025-2030 (%)

12.2 Geographic comparison

Chart on Geographic comparison
Data Table on Geographic comparison

12.3 North America - Market size and forecast 2025-2030

Chart on North America - Market size and forecast 2025-2030 ($ million)
Data Table on North America - Market size and forecast 2025-2030 ($ million)
Chart on North America - Year-over-year growth 2025-2030 (%)
Data Table on North America - Year-over-year growth 2025-2030 (%)
Chart on Regional Comparison - North America
Data Table on Regional Comparison - North America

12.3.1 US - Market size and forecast 2025-2030

Chart on US - Market size and forecast 2025-2030 ($ million)
Data Table on US - Market size and forecast 2025-2030 ($ million)
Chart on US - Year-over-year growth 2025-2030 (%)
Data Table on US - Year-over-year growth 2025-2030 (%)

12.3.2 Canada - Market size and forecast 2025-2030

Chart on Canada - Market size and forecast 2025-2030 ($ million)
Data Table on Canada - Market size and forecast 2025-2030 ($ million)
Chart on Canada - Year-over-year growth 2025-2030 (%)
Data Table on Canada - Year-over-year growth 2025-2030 (%)

12.3.3 Mexico - Market size and forecast 2025-2030

Chart on Mexico - Market size and forecast 2025-2030 ($ million)
Data Table on Mexico - Market size and forecast 2025-2030 ($ million)
Chart on Mexico - Year-over-year growth 2025-2030 (%)
Data Table on Mexico - Year-over-year growth 2025-2030 (%)

12.4 Europe - Market size and forecast 2025-2030

Chart on Europe - Market size and forecast 2025-2030 ($ million)
Data Table on Europe - Market size and forecast 2025-2030 ($ million)
Chart on Europe - Year-over-year growth 2025-2030 (%)
Data Table on Europe - Year-over-year growth 2025-2030 (%)
Chart on Regional Comparison - Europe
Data Table on Regional Comparison - Europe

12.4.1 Germany - Market size and forecast 2025-2030

Chart on Germany - Market size and forecast 2025-2030 ($ million)
Data Table on Germany - Market size and forecast 2025-2030 ($ million)
Chart on Germany - Year-over-year growth 2025-2030 (%)
Data Table on Germany - Year-over-year growth 2025-2030 (%)

12.4.2 UK - Market size and forecast 2025-2030

Chart on UK - Market size and forecast 2025-2030 ($ million)
Data Table on UK - Market size and forecast 2025-2030 ($ million)
Chart on UK - Year-over-year growth 2025-2030 (%)
Data Table on UK - Year-over-year growth 2025-2030 (%)

12.4.3 France - Market size and forecast 2025-2030

Chart on France - Market size and forecast 2025-2030 ($ million)
Data Table on France - Market size and forecast 2025-2030 ($ million)
Chart on France - Year-over-year growth 2025-2030 (%)
Data Table on France - Year-over-year growth 2025-2030 (%)

12.4.4 Italy - Market size and forecast 2025-2030

Chart on Italy - Market size and forecast 2025-2030 ($ million)
Data Table on Italy - Market size and forecast 2025-2030 ($ million)
Chart on Italy - Year-over-year growth 2025-2030 (%)
Data Table on Italy - Year-over-year growth 2025-2030 (%)

12.4.5 Spain - Market size and forecast 2025-2030

Chart on Spain - Market size and forecast 2025-2030 ($ million)
Data Table on Spain - Market size and forecast 2025-2030 ($ million)
Chart on Spain - Year-over-year growth 2025-2030 (%)
Data Table on Spain - Year-over-year growth 2025-2030 (%)

12.4.6 The Netherlands - Market size and forecast 2025-2030

Chart on The Netherlands - Market size and forecast 2025-2030 ($ million)
Data Table on The Netherlands - Market size and forecast 2025-2030 ($ million)
Chart on The Netherlands - Year-over-year growth 2025-2030 (%)
Data Table on The Netherlands - Year-over-year growth 2025-2030 (%)

12.5 APAC - Market size and forecast 2025-2030

Chart on APAC - Market size and forecast 2025-2030 ($ million)
Data Table on APAC - Market size and forecast 2025-2030 ($ million)
Chart on APAC - Year-over-year growth 2025-2030 (%)
Data Table on APAC - Year-over-year growth 2025-2030 (%)
Chart on Regional Comparison - APAC
Data Table on Regional Comparison - APAC

12.5.1 China - Market size and forecast 2025-2030

Chart on China - Market size and forecast 2025-2030 ($ million)
Data Table on China - Market size and forecast 2025-2030 ($ million)
Chart on China - Year-over-year growth 2025-2030 (%)
Data Table on China - Year-over-year growth 2025-2030 (%)

12.5.2 India - Market size and forecast 2025-2030

Chart on India - Market size and forecast 2025-2030 ($ million)
Data Table on India - Market size and forecast 2025-2030 ($ million)
Chart on India - Year-over-year growth 2025-2030 (%)
Data Table on India - Year-over-year growth 2025-2030 (%)

12.5.3 Japan - Market size and forecast 2025-2030

Chart on Japan - Market size and forecast 2025-2030 ($ million)
Data Table on Japan - Market size and forecast 2025-2030 ($ million)
Chart on Japan - Year-over-year growth 2025-2030 (%)
Data Table on Japan - Year-over-year growth 2025-2030 (%)

12.5.4 South Korea - Market size and forecast 2025-2030

Chart on South Korea - Market size and forecast 2025-2030 ($ million)
Data Table on South Korea - Market size and forecast 2025-2030 ($ million)
Chart on South Korea - Year-over-year growth 2025-2030 (%)
Data Table on South Korea - Year-over-year growth 2025-2030 (%)

12.5.5 Australia - Market size and forecast 2025-2030

Chart on Australia - Market size and forecast 2025-2030 ($ million)
Data Table on Australia - Market size and forecast 2025-2030 ($ million)
Chart on Australia - Year-over-year growth 2025-2030 (%)
Data Table on Australia - Year-over-year growth 2025-2030 (%)

12.5.6 Indonesia - Market size and forecast 2025-2030

Chart on Indonesia - Market size and forecast 2025-2030 ($ million)
Data Table on Indonesia - Market size and forecast 2025-2030 ($ million)
Chart on Indonesia - Year-over-year growth 2025-2030 (%)
Data Table on Indonesia - Year-over-year growth 2025-2030 (%)

12.6 South America - Market size and forecast 2025-2030

Chart on South America - Market size and forecast 2025-2030 ($ million)
Data Table on South America - Market size and forecast 2025-2030 ($ million)
Chart on South America - Year-over-year growth 2025-2030 (%)
Data Table on South America - Year-over-year growth 2025-2030 (%)
Chart on Regional Comparison - South America
Data Table on Regional Comparison - South America

12.6.1 Brazil - Market size and forecast 2025-2030

Chart on Brazil - Market size and forecast 2025-2030 ($ million)
Data Table on Brazil - Market size and forecast 2025-2030 ($ million)
Chart on Brazil - Year-over-year growth 2025-2030 (%)
Data Table on Brazil - Year-over-year growth 2025-2030 (%)

12.6.2 Argentina - Market size and forecast 2025-2030

Chart on Argentina - Market size and forecast 2025-2030 ($ million)
Data Table on Argentina - Market size and forecast 2025-2030 ($ million)
Chart on Argentina - Year-over-year growth 2025-2030 (%)
Data Table on Argentina - Year-over-year growth 2025-2030 (%)

12.6.3 Colombia - Market size and forecast 2025-2030

Chart on Colombia - Market size and forecast 2025-2030 ($ million)
Data Table on Colombia - Market size and forecast 2025-2030 ($ million)
Chart on Colombia - Year-over-year growth 2025-2030 (%)
Data Table on Colombia - Year-over-year growth 2025-2030 (%)

12.7 Middle East and Africa - Market size and forecast 2025-2030

Chart on Middle East and Africa - Market size and forecast 2025-2030 ($ million)
Data Table on Middle East and Africa - Market size and forecast 2025-2030 ($ million)
Chart on Middle East and Africa - Year-over-year growth 2025-2030 (%)
Data Table on Middle East and Africa - Year-over-year growth 2025-2030 (%)
Chart on Regional Comparison - Middle East and Africa
Data Table on Regional Comparison - Middle East and Africa

12.7.1 Saudi Arabia - Market size and forecast 2025-2030

Chart on Saudi Arabia - Market size and forecast 2025-2030 ($ million)
Data Table on Saudi Arabia - Market size and forecast 2025-2030 ($ million)
Chart on Saudi Arabia - Year-over-year growth 2025-2030 (%)
Data Table on Saudi Arabia - Year-over-year growth 2025-2030 (%)

12.7.2 UAE - Market size and forecast 2025-2030

Chart on UAE - Market size and forecast 2025-2030 ($ million)
Data Table on UAE - Market size and forecast 2025-2030 ($ million)
Chart on UAE - Year-over-year growth 2025-2030 (%)
Data Table on UAE - Year-over-year growth 2025-2030 (%)

12.7.3 South Africa - Market size and forecast 2025-2030

Chart on South Africa - Market size and forecast 2025-2030 ($ million)
Data Table on South Africa - Market size and forecast 2025-2030 ($ million)
Chart on South Africa - Year-over-year growth 2025-2030 (%)
Data Table on South Africa - Year-over-year growth 2025-2030 (%)

12.7.4 Israel - Market size and forecast 2025-2030

Chart on Israel - Market size and forecast 2025-2030 ($ million)
Data Table on Israel - Market size and forecast 2025-2030 ($ million)
Chart on Israel - Year-over-year growth 2025-2030 (%)
Data Table on Israel - Year-over-year growth 2025-2030 (%)

12.7.5 Turkey - Market size and forecast 2025-2030

Chart on Turkey - Market size and forecast 2025-2030 ($ million)
Data Table on Turkey - Market size and forecast 2025-2030 ($ million)
Chart on Turkey - Year-over-year growth 2025-2030 (%)
Data Table on Turkey - Year-over-year growth 2025-2030 (%)

12.8 Market opportunity by geography

Market opportunity by geography ($ million)
Data Tables on Market opportunity by geography ($ million)

13. Drivers, Challenges, and Opportunity

13.1 Market drivers

Expanding telecommunication services
Inclination toward next-generation technologies
Increasing collaborations and partnerships

13.2 Market challenges

High implementation and maintenance costs
Lack of awareness among end-users
Threat from open-source solutions

13.3 Impact of drivers and challenges

Impact of drivers and challenges in 2025 and 2030

13.4 Market opportunities

Robust adoption of cloud solutions
Increasing investments in research and development
Rising number of mergers and acquisitions among key companies

14. Competitive Landscape

14.1 Overview

14.2

Overview on criticality of inputs and factors of differentiation

14.3 Landscape disruption

Overview on factors of disruption

14.4 Industry risks

Impact of key risks on business

15. Competitive Analysis

15.1 Companies profiled

Companies covered

15.2 Company ranking index

15.3 Market positioning of companies

Matrix on companies position and classification

15.4 Amdocs Ltd.

Amdocs Ltd. - Overview
Amdocs Ltd. - Product / Service
Amdocs Ltd. - Key news
Amdocs Ltd. - Key offerings
SWOT

15.5 Bill Perfect Inc.

Bill Perfect Inc. - Overview
Bill Perfect Inc. - Product / Service
Bill Perfect Inc. - Key offerings
SWOT

15.6 BillingPlatform

BillingPlatform - Overview
BillingPlatform - Product / Service
BillingPlatform - Key offerings
SWOT

15.7 Cerillion Plc

Cerillion Plc - Overview
Cerillion Plc - Business segments
Cerillion Plc - Key offerings
Cerillion Plc - Segment focus
SWOT

15.8 Comarch SA

Comarch SA - Overview
Comarch SA - Product / Service
Comarch SA - Key news
Comarch SA - Key offerings
SWOT

15.9 CSG Systems International Inc.

CSG Systems International Inc. - Overview
CSG Systems International Inc. - Product / Service
CSG Systems International Inc. - Key offerings
SWOT

15.10 Enghouse Systems Ltd.

Enghouse Systems Ltd. - Overview
Enghouse Systems Ltd. - Business segments
Enghouse Systems Ltd. - Key offerings
Enghouse Systems Ltd. - Segment focus
SWOT

15.11 Formula Telecom Solutions Ltd.

Formula Telecom Solutions Ltd. - Overview
Formula Telecom Solutions Ltd. - Product / Service
Formula Telecom Solutions Ltd. - Key offerings
SWOT

15.12 Huawei Technologies Co. Ltd.

Huawei Technologies Co. Ltd. - Overview
Huawei Technologies Co. Ltd. - Product / Service
Huawei Technologies Co. Ltd. - Key news
Huawei Technologies Co. Ltd. - Key offerings
SWOT

15.13 OneBill Software Inc.

OneBill Software Inc. - Overview
OneBill Software Inc. - Product / Service
OneBill Software Inc. - Key offerings
SWOT

15.14 Optiva Inc.

Optiva Inc. - Overview
Optiva Inc. - Product / Service
Optiva Inc. - Key news
Optiva Inc. - Key offerings
SWOT

15.15 Oracle Corp.

Oracle Corp. - Overview
Oracle Corp. - Business segments
Oracle Corp. - Key news
Oracle Corp. - Key offerings
Oracle Corp. - Segment focus
SWOT

15.16 Tecnotree Corp

Tecnotree Corp - Overview
Tecnotree Corp - Product / Service
Tecnotree Corp - Key offerings
SWOT

15.17 Telefonaktiebolaget Ericsson

Telefonaktiebolaget Ericsson - Overview
Telefonaktiebolaget Ericsson - Business segments
Telefonaktiebolaget Ericsson - Key news
Telefonaktiebolaget Ericsson - Key offerings
Telefonaktiebolaget Ericsson - Segment focus
SWOT

15.18 Teoco

Teoco - Overview
Teoco - Product / Service
Teoco - Key offerings
SWOT

16. Appendix

16.1 Scope of the report

Market definition
Objectives
Notes and caveats

16.2 Inclusions and exclusions checklist

Inclusions checklist
Exclusions checklist

16.3 Currency conversion rates for US$

16.4 Research methodology

16.5 Data procurement

Information sources

16.6 Data validation

16.7 Validation techniques employed for market sizing

16.8 Data synthesis

16.9 360 degree market analysis

16.10 List of abbreviations

Research Methodology

Technavio presents a detailed picture of the market by way of study, synthesis, and summation of data from multiple sources. The analysts have presented the various facets of the market with a particular focus on identifying the key industry influencers. The data thus presented is comprehensive, reliable, and the result of extensive research, both primary and secondary.

INFORMATION SOURCES

Primary sources

  • Manufacturers and suppliers
  • Channel partners
  • Industry experts
  • Strategic decision makers

Secondary sources

  • Industry journals and periodicals
  • Government data
  • Financial reports of key industry players
  • Historical data
  • Press releases

DATA ANALYSIS

Data Synthesis

  • Collation of data
  • Estimation of key figures
  • Analysis of derived insights

Data Validation

  • Triangulation with data models
  • Reference against proprietary databases
  • Corroboration with industry experts

REPORT WRITING

Qualitative

  • Market drivers
  • Market challenges
  • Market trends
  • Five forces analysis

Quantitative

  • Market size and forecast
  • Market segmentation
  • Geographical insights
  • Competitive landscape

Interested in this report?

Get your sample now to see our research methodology and insights!

Download Now

Frequently Asked Questions

Telecom Billing Revenue Management market growth will increase by USD 11694.7 million during 2026-2030.

The Telecom Billing Revenue Management market is expected to grow at a CAGR of 10.8% during 2026-2030.

Telecom Billing Revenue Management market is segmented by Solution (Software, Services) Deployment (On-premises, Cloud) Type (Mobile network operators, Mobile virtual network operators, Mobile virtual network enablers)

Amdocs Ltd., Bill Perfect Inc., BillingPlatform, Cerillion Plc, Comarch SA, CSG Systems International Inc., Enghouse Systems Ltd., Formula Telecom Solutions Ltd., Huawei Technologies Co. Ltd., Invoicera, MATRIXX Software, NetCracker Technology Corp., Nexign Joint Stock Co., OneBill Software Inc., Optiva Inc., Oracle Corp., Rev.io., Tecnotree Corp, Telefonaktiebolaget Ericsson, Teoco are a few of the key vendors in the Telecom Billing Revenue Management market.

North America will register the highest growth rate of 38.8% among the other regions. Therefore, the Telecom Billing Revenue Management market in North America is expected to garner significant business opportunities for the vendors during the forecast period.

US, Canada, Mexico, Germany, UK, France, Italy, Spain, The Netherlands, China, India, Japan, South Korea, Australia, Indonesia, Brazil, Argentina, Colombia, Saudi Arabia, UAE, South Africa, Israel, Turkey

  • Expanding telecommunication services is the driving factor this market.

The Telecom Billing Revenue Management market vendors should focus on grabbing business opportunities from the Solution segment as it accounted for the largest market share in the base year.