Temperature Controlled Pharmaceutical Packaging Solutions Market Analysis, Size, and Forecast 2025-2029: North America (US and Canada), Europe (Germany, UK, and France), APAC (China, India, and Japan), South America (Brazil and Argentina), Middle East and Africa (Saudi Arabia, UAE, and South Africa), and Rest of World (ROW)

Temperature Controlled Pharmaceutical Packaging Solutions Market Analysis, Size, and Forecast 2025-2029:
North America (US and Canada), Europe (Germany, UK, and France), APAC (China, India, and Japan), South America (Brazil and Argentina), Middle East and Africa (Saudi Arabia, UAE, and South Africa), and Rest of World (ROW)

Published: May 2026 251 Pages SKU: IRTNTR77195

Market Overview at a Glance

$5.88 B
Market Opportunity
12.7%
CAGR 2024 - 2029
32.9%
North America Growth
$3.00 B
Frozen segment 2023

Temperature Controlled Pharmaceutical Packaging Solutions Market Size and Growth Forecast 2025-2029

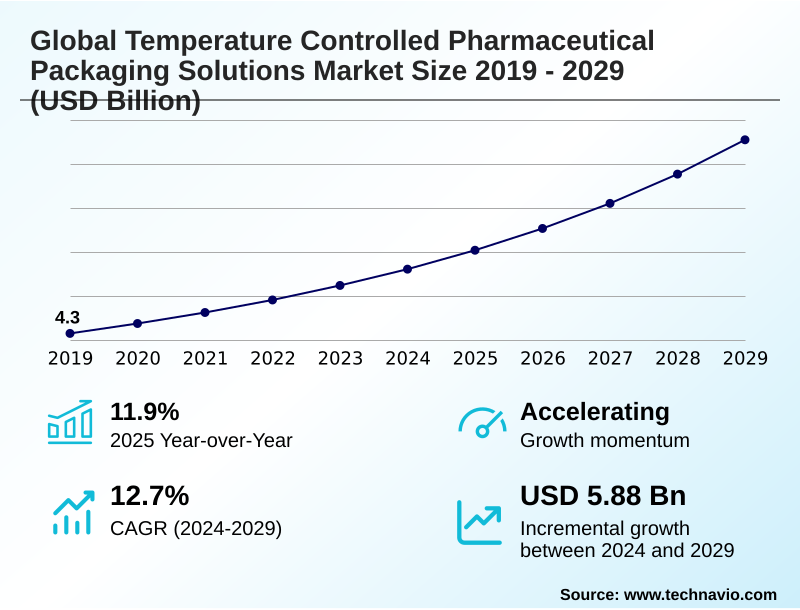
The Temperature Controlled Pharmaceutical Packaging Solutions Market size was valued at USD 7.22 billion in 2024 growing at a CAGR of 12.7% during the forecast period 2025-2029.

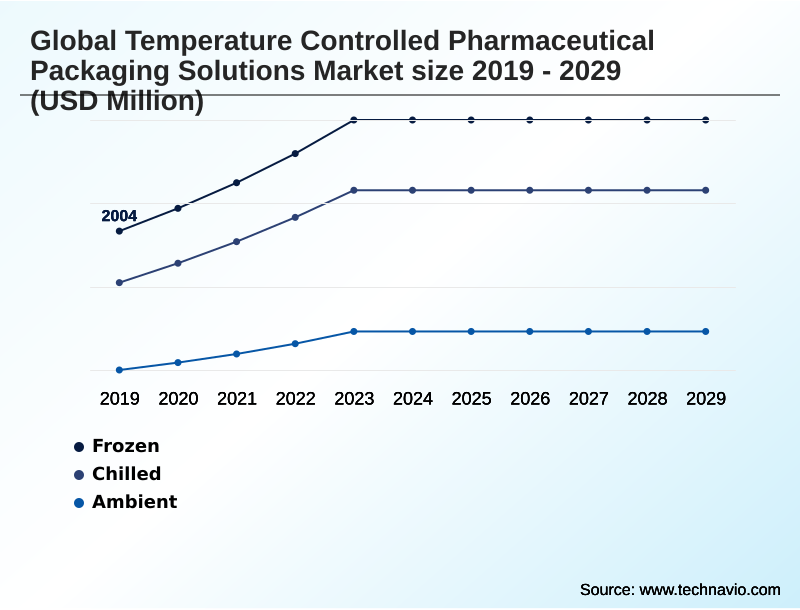
North America accounts for 32.9% of incremental growth during the forecast period. The Frozen segment by Product was valued at USD 3.00 billion in 2023, while the Passive systems segment holds the largest revenue share by Type.

The market is projected to grow by USD 8.80 billion from 2019 to 2029, with USD 5.88 billion of the growth expected during the forecast period of 2024 to 2029.

Get Key Insights on Market Forecast (PDF) Request Free Sample

Temperature Controlled Pharmaceutical Packaging Solutions Market Overview

The temperature controlled pharmaceutical packaging solutions market is expanding, driven by the proliferation of biologics and advanced treatments requiring strict thermal control. Maintaining supply chain integrity for these products is paramount, with a significant portion of North America's market activity, contributing to 32.9% of the incremental growth, linked to advanced clinical trial logistics. In a typical scenario, a biopharmaceutical firm transporting cell therapies leverages validated shipping solutions integrated with IoT data loggers for real-time temperature excursion monitoring. This deployment of cold chain visibility platforms ensures compliance with Good Distribution Practices (GDP) and has been shown to reduce product loss rates during transit significantly. The industry's year-over-year growth of 11.9% is further supported by the rising adoption of reusable packaging systems, as decision-makers weigh the total cost of ownership against single-use alternatives to meet both operational and sustainability goals.

Drivers, Trends, and Challenges in the Temperature Controlled Pharmaceutical Packaging Solutions Market

The increasing complexity of pharmaceutical products is fundamentally shaping procurement decisions for temperature-controlled packaging. For instance, the logistics for vaccines and biologics demand robust solutions, with decision-makers conducting detailed cost-benefit analyses of reusable vs single-use shippers. Reusable cold chain packaging solutions offer a lower total cost of ownership over time, a crucial factor for large-scale distribution.

The expansion of cell and gene therapies necessitates specialized packaging solutions for cell and gene therapies that can maintain cryogenic temperatures, often requiring active temperature controlled cargo containers for air freight. These systems provide precise thermal management, which is critical for complying with the EU's Good Distribution Practices (GDP) guidelines.

In contrast, for less sensitive products or shorter transit routes, passive temperature controlled shipping systems offer a cost-effective and reliable alternative.

A key operational scenario involves a logistics manager for a global pharmaceutical firm selecting validated packaging for clinical trial logistics; for a cross-continental shipment of a high-value biologic, an active container is chosen, while for regional distribution of a stable vaccine, a pre-qualified passive shipper is deemed sufficient, demonstrating a tiered approach to risk management and cost control.

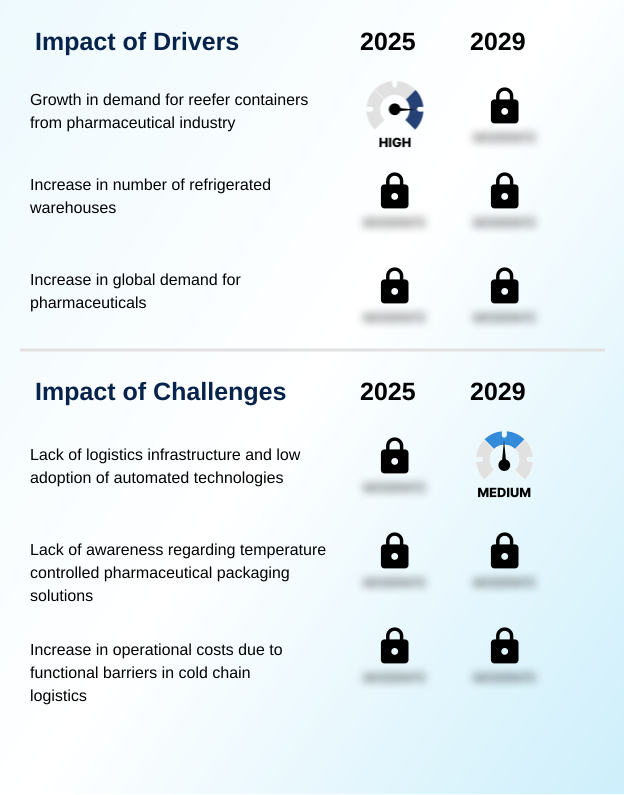
Primary Growth Driver: The increasing demand for reefer containers from the pharmaceutical industry is a significant driver for the market.

The primary driver of market growth is the expanding pipeline of biologic drugs and other temperature-sensitive pharmaceuticals, which require stringent cold chain logistics to maintain efficacy.

The transport of these products, including the recent surge in GLP-1 agonists, necessitates reliable solutions that adhere to global Good Distribution Practices (GDP) standards.

This demand has led to significant investments in logistics infrastructure, such as the expansion of reefer container fleets by major shipping lines. For instance, one such expansion added over 13,000 new units to enhance capacity for biologic drug transport.

The complexity of moving these high-value products across global supply chains makes validated, temperature-controlled packaging an essential component of modern pharmaceutical distribution.

Emerging Market Trend: Market participants are increasingly focusing on traditional growth strategies, particularly mergers and acquisitions. This approach is used to expand product portfolios and enhance geographic reach.

A significant trend shaping the market is the strategic consolidation through mergers and acquisitions, enabling companies to broaden their portfolios of reusable packaging systems and expand their global footprint. This inorganic growth strategy is complemented by a strong industry-wide push toward sustainable cold chain packaging to address environmental concerns and meet corporate responsibility goals.

This shift is driving innovation in materials and design, aligning with environmental management standards such as ISO 14001. As a result, there is growing demand for solutions that not only ensure supply chain integrity but also support a circular economy.

The focus on sustainability is becoming a key differentiator among vendors and a critical factor in procurement decisions for logistics and pharmaceutical partners.

Key Industry Challenge: Inadequate logistics infrastructure and the slow adoption of automated technologies present a key challenge to market growth.

A primary market restraint is the inadequate logistics infrastructure and high operational costs in many emerging economies, which complicates the last-mile cold chain. Reports indicate that up to 20% of temperature-sensitive products are damaged due to broken cold chains in these regions, leading to significant financial losses and patient risk.

The lack of robust cold chain visibility platforms makes temperature excursion monitoring difficult, hindering compliance with standards like the BRC Global Standard for Packaging Materials.

The high initial investment required for advanced automated technologies and qualified packaging presents a significant barrier for smaller domestic logistics providers, slowing the modernization of the supply chain and limiting the market's full growth potential in these key geographic areas.

Explore Full Market Dynamics Analysis Request Free Sample

Temperature Controlled Pharmaceutical Packaging Solutions Market Segmentation

The temperature controlled pharmaceutical packaging solutions industry research report provides comprehensive data including region-wise segment analysis, with forecasts and analysis for the period 2025-2029, as well as historical data from 2019-2023 for the following segments.

Market Segment by Product
  • Frozen
  • Chilled
  • Ambient
Market Segment by Type
  • Passive systems
  • Active systems
Market Segment by End-user
  • Pharmaceuticals
  • Vaccines and biologics
  • Others
Market Segment by Geography
North America
US, Canada
Europe
Germany, UK, France, Italy
APAC
China, India, Japan
South America
Brazil, Argentina
Middle East and Africa
Saudi Arabia, UAE, South Africa

Product Segment Analysis

The frozen segment is estimated to witness significant growth during the forecast period.

The frozen segment is critical for safeguarding product efficacy during extended transit, particularly for therapies requiring cryogenic temperatures. Operational priorities center on advanced thermal insulation and active temperature regulation to comply with evolving regulatory frameworks like Good Distribution Practices (GDP).

Innovations in phase change materials and vacuum insulation panels are utilized to minimize temperature excursions and preserve the integrity of high-value formulations.

This segment, which accounted for a substantial portion of the market in 2024, sees continuous development in modular and scalable ultra-low temperature shipping solutions.

These advancements are essential for supporting last-mile delivery and ensuring performance consistency for temperature-sensitive pharmaceuticals across global supply chains, reinforcing the segment’s integral role in sustaining product accessibility.

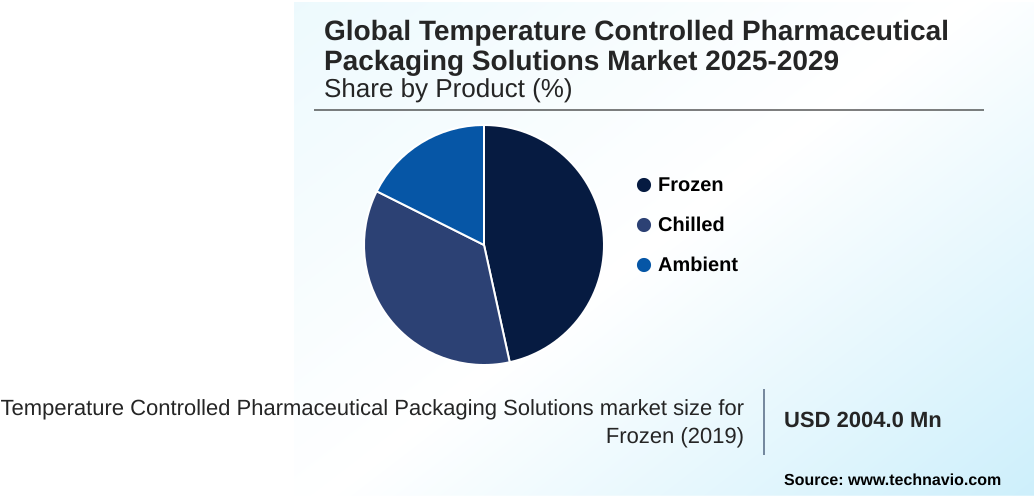
The Frozen segment was valued at USD 3.00 billion in 2023 and showed a gradual increase during the forecast period.

Temperature Controlled Pharmaceutical Packaging Solutions Market by Region: North America Leads with 32.9% Growth Share

North America is estimated to contribute 32.9% to the growth of the global market during the forecast period.

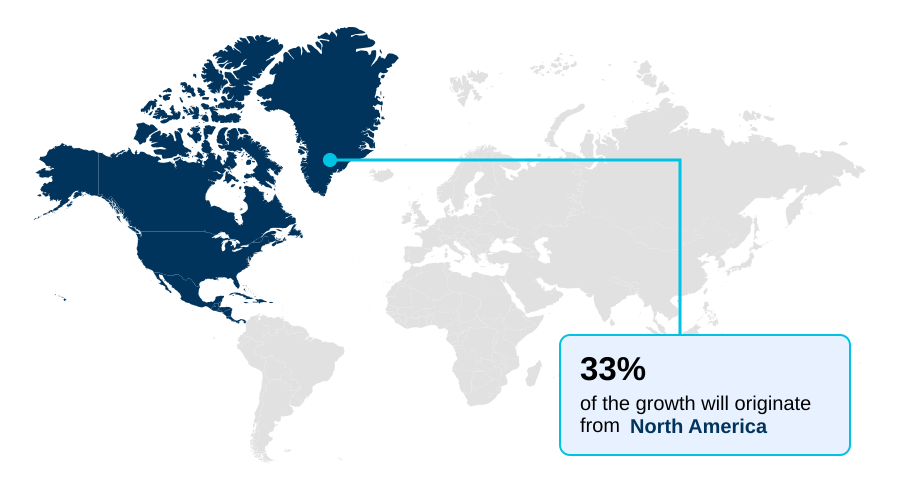
The geographic landscape is led by North America, which accounts for approximately 32.9% of the market's incremental growth, driven by its advanced healthcare infrastructure and high concentration of pharmaceutical R&D.

The US market, in particular, benefits from initiatives like the Pharmaceutical Supply Chain Security Act (PSCSA), which bolsters demand for secure and traceable clinical trial logistics.

Meanwhile, APAC is the fastest-growing region, with countries like China and India expanding their pharmaceutical manufacturing capabilities, creating significant demand for multi-modal transport validation and compliant packaging solutions.

Europe, with Germany as a key market, remains a significant contributor, focusing on sustainable cold chain packaging and adherence to stringent EU Good Distribution Practices.

These regional dynamics highlight a global market where regulatory compliance in shipping and robust infrastructure are key differentiators.

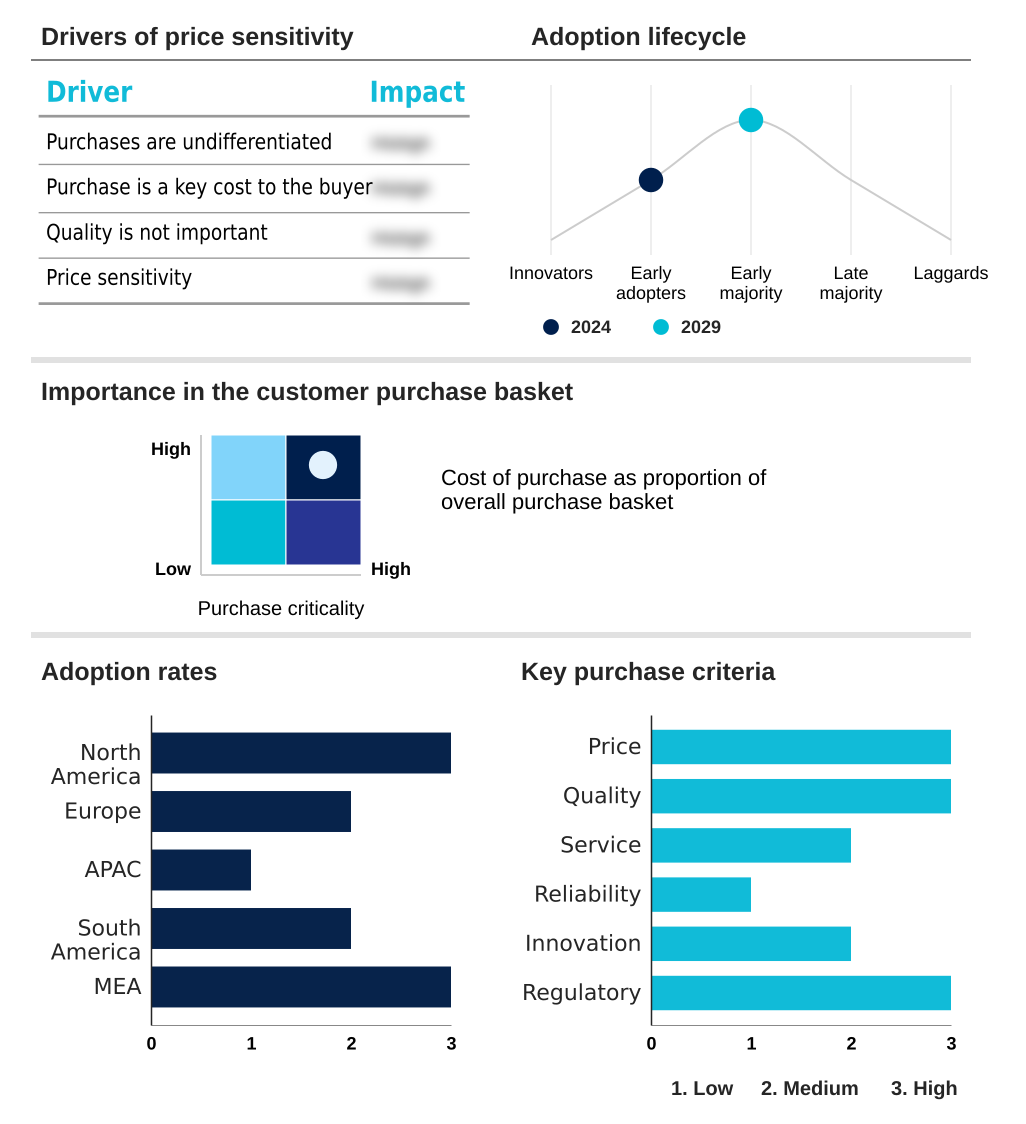
Customer Landscape Analysis for the Temperature Controlled Pharmaceutical Packaging Solutions Market

The temperature controlled pharmaceutical packaging solutions market forecasting report includes the adoption lifecycle of the market, covering from the innovator’s stage to the laggard’s stage. It focuses on adoption rates in different regions based on penetration. Furthermore, the temperature controlled pharmaceutical packaging solutions market report also includes key purchase criteria and drivers of price sensitivity to help companies evaluate and develop their market growth analysis strategies.

Competitive Landscape of the Temperature Controlled Pharmaceutical Packaging Solutions Market

Companies are implementing various strategies, such as strategic alliances, partnerships, mergers and acquisitions, geographical expansion, and product/service launches, to enhance their presence in the temperature controlled pharmaceutical packaging solutions market industry.

Aeris Dynamics - Vendors provide advanced, qualified shipping containers and logistics services, ensuring the integrity and efficacy of temperature-sensitive pharmaceuticals and biologics throughout the global supply chain.

The industry research and growth report includes detailed analyses of the competitive landscape of the market and information about key companies, including:

  • Aeris Dynamics
  • American Aerogel
  • Cencora Inc.
  • Cold Chain Technologies
  • Cryo Store B.V.
  • CSafe Global
  • DGP Intelsius Ltd.
  • DoKaSch GmbH
  • DS Smith Plc
  • Envirotainer AB
  • FUCHS SE
  • Hazgo
  • Inmark Global Holdings LLC.
  • Integreon Global
  • Pelican Products Inc.
  • Rapid Aid Corp.
  • Sofrigam
  • Sonoco Products Co.
  • va Q tec Thermal Solutions GmbH

Qualitative and quantitative analysis of companies has been conducted to help clients understand the wider business environment as well as the strengths and weaknesses of key industry players. Data is qualitatively analyzed to categorize companies as pure play, category-focused, industry-focused, and diversified; it is quantitatively analyzed to categorize companies as dominant, leading, strong, tentative, and weak.

Recent Developments in the Temperature Controlled Pharmaceutical Packaging Solutions Market

  • In January 2025, CSafe completes its acquisition of Kalibox, a French manufacturer of passive temperature-controlled packaging, to expand its product portfolio and European geographic footprint.
  • In March 2025, Hapag-Lloyd announces the full deployment of 13,420 new reefer containers, including 1,000 units with controlled-atmosphere technology, to enhance its capacity for transporting sensitive goods like pharmaceuticals.
  • In November 2024, Cryoport Inc. initiates a strategic partnership with Syneos Health to provide its full suite of temperature-controlled logistics solutions for decentralized and direct-to-patient clinical trials.
  • In September 2024, Pelican Products Inc. launches its new CoolPall Flex PCM line, a series of reusable shippers designed to improve sustainability in the transport of biologic drugs.

Research Analyst Overview: Temperature Controlled Pharmaceutical Packaging Solutions Market

Boardroom decisions are increasingly focused on the total cost of ownership of cold chain assets, weighing the high CAPEX of reusable packaging systems against the recurring OPEX of single-use shippers. This evaluation is critical as the market shifts toward more sustainable and efficient biologic drug transport.

The integrity of temperature-sensitive pharmaceuticals relies on sophisticated thermal packaging, with passive cooling systems that use advanced phase change materials and vacuum insulation panels dominating market share. However, for high-value cell and gene therapy logistics requiring precise cryogenic temperatures, active cooling systems are indispensable. Compliance with standards like ASTM D4169 for shipping container performance is a non-negotiable vendor qualification criterion.

As such, procurement managers are prioritizing validated shipping solutions that integrate real-time data loggers for temperature excursion monitoring, providing an auditable trail for regulatory bodies and ensuring supply chain integrity from production to patient.

Dive into Technavio’s robust research methodology, blending expert interviews, extensive data synthesis, and validated models for unparalleled Temperature Controlled Pharmaceutical Packaging Solutions Market insights. See full methodology.

Request Free Sample

Market Scope
Page number 251
Base year 2024
Historic period 2019-2023
Forecast period 2025-2029
Growth momentum & CAGR Accelerate at a CAGR of 12.7%
Market growth 2025-2029 USD 5882.4 million
Market structure Fragmented
YoY growth 2024-2025(%) 11.9%
Key countries US, Canada, Germany, UK, France, Italy, China, India, Japan, Brazil, Argentina, Saudi Arabia, UAE and South Africa
Competitive landscape Leading Companies, Market Positioning of Companies, Competitive Strategies, and Industry Risks

Temperature Controlled Pharmaceutical Packaging Solutions Market: Key Questions Answered in This Report

  • What is the expected growth of the Temperature Controlled Pharmaceutical Packaging Solutions Market between 2025 and 2029?

    • The Temperature Controlled Pharmaceutical Packaging Solutions Market is expected to grow by USD 5.88 billion during 2025-2029, registering a CAGR of 12.7%. Year-over-year growth in 2025 is estimated at 11.9%%. This acceleration is shaped by growth in demand for reefer containers from pharmaceutical industry, which is intensifying demand across multiple end-use verticals covered in the report.

  • What segmentation does the market report cover?

    • The report is segmented by Product (Frozen, Chilled, and Ambient), Type (Passive systems, and Active systems), End-user (Pharmaceuticals, Vaccines and biologics, and Others) and Geography (North America, Europe, APAC, South America, Middle East and Africa). Among these, the Frozen segment is estimated to witness significant growth during the forecast period, driven by rising adoption across key application areas. Each segment includes detailed qualitative and quantitative analysis, along with historical data from 2019-2023 and forecasts through 2029 with year-over-year growth rates.

  • Which regions are analyzed in the report?

    • The report covers North America, Europe, APAC, South America and Middle East and Africa. North America is estimated to contribute 32.9% to market growth during the forecast period. Country-level analysis includes US, Canada, Germany, UK, France, Italy, China, India, Japan, Brazil, Argentina, Saudi Arabia, UAE and South Africa, with dedicated market size tables and year-over-year growth for each.

  • What are the key growth drivers and market challenges?

    • The primary driver is growth in demand for reefer containers from pharmaceutical industry, which is accelerating investment and industry demand. The main challenge is lack of logistics infrastructure and low adoption of automated technologies, creating operational barriers for key market participants. The report quantifies the impact of each driver and challenge across 2025 and 2029 with comparative analysis.

  • Who are the major players in the Temperature Controlled Pharmaceutical Packaging Solutions Market?

    • Key vendors include Aeris Dynamics, American Aerogel, Cencora Inc., Cold Chain Technologies, Cryo Store B.V., CSafe Global, DGP Intelsius Ltd., DoKaSch GmbH, DS Smith Plc, Envirotainer AB, FUCHS SE, Hazgo, Inmark Global Holdings LLC., Integreon Global, Pelican Products Inc., Rapid Aid Corp., Sofrigam, Sonoco Products Co. and va Q tec Thermal Solutions GmbH. The report provides qualitative and quantitative analysis categorizing companies as dominant, leading, strong, tentative, and weak based on their market positioning. Company profiles include business segment analysis, SWOT assessment, key offerings, and recent strategic developments.

Temperature Controlled Pharmaceutical Packaging Solutions Market Research Insights

Market dynamics are increasingly shaped by the need for multi-modal transport validation to ensure supply chain integrity across complex global routes. As the APAC market demonstrates accelerated growth compared to Europe, with regional CAGRs of 13.1% and 12.3% respectively, logistics providers are investing in advanced insulation materials and cold chain qualification to manage diverse climatic conditions.

Compliance with mandates such as Good Distribution Practices (GDP) necessitates robust temperature management, particularly for patient-centric logistics where direct-to-patient shipments bypass traditional distribution hubs. An operational focus on secure logistics for high-value drugs is driving the adoption of real-time temperature tracking technologies, providing auditable proof of product stability from the manufacturing site to the point of administration.

We can help! Our analysts can customize this temperature controlled pharmaceutical packaging solutions market research report to meet your requirements.

Get in touch

1. Executive Summary

1.1 Market overview

Executive Summary - Chart on Market Overview
Executive Summary - Data Table on Market Overview
Executive Summary - Chart on Global Market Characteristics
Executive Summary - Chart on Market by Geography
Executive Summary - Chart on Market Segmentation by Product
Executive Summary - Chart on Market Segmentation by Type
Executive Summary - Chart on Market Segmentation by End-user
Executive Summary - Chart on Incremental Growth
Executive Summary - Data Table on Incremental Growth
Executive Summary - Chart on Company Market Positioning

2. Technavio Analysis

2.1 Analysis of price sensitivity, lifecycle, customer purchase basket, adoption rates, and purchase criteria

2.2 Criticality of inputs and Factors of differentiation

Chart on Overview on criticality of inputs and factors of differentiation

2.3 Factors of disruption

Chart on Overview on factors of disruption

2.4 Impact of drivers and challenges

Chart on Impact of drivers and challenges in 2024 and 2029

3. Market Landscape

3.1 Market ecosystem

Chart on Parent Market
Data Table on - Parent Market

3.2 Market characteristics

Chart on Market characteristics analysis

3.3 Value chain analysis

Chart on Value chain analysis

4. Market Sizing

4.1 Market definition

Data Table on Offerings of companies included in the market definition

4.2 Market segment analysis

Market segments

4.3 Market size 2024

4.4 Market outlook: Forecast for 2024-2029

Chart on Global - Market size and forecast 2024-2029 ($ million)
Data Table on Global - Market size and forecast 2024-2029 ($ million)
Chart on Global Market: Year-over-year growth 2024-2029 (%)
Data Table on Global Market: Year-over-year growth 2024-2029 (%)

5. Historic Market Size

5.1 Global Temperature Controlled Pharmaceutical Packaging Solutions Market 2019 - 2023

Historic Market Size - Data Table on Global Temperature Controlled Pharmaceutical Packaging Solutions Market 2019 - 2023 ($ million)

5.2 Product segment analysis 2019 - 2023

Historic Market Size - Product Segment 2019 - 2023 ($ million)

5.3 Type segment analysis 2019 - 2023

Historic Market Size - Type Segment 2019 - 2023 ($ million)

5.4 End-user segment analysis 2019 - 2023

Historic Market Size - End-user Segment 2019 - 2023 ($ million)

5.5 Geography segment analysis 2019 - 2023

Historic Market Size - Geography Segment 2019 - 2023 ($ million)

5.6 Country segment analysis 2019 - 2023

Historic Market Size - Country Segment 2019 - 2023 ($ million)

6. Qualitative Analysis

6.1 The impact of AI in global temperature controlled pharmaceutical packaging solutions market

7. Five Forces Analysis

7.1 Five forces summary

Five forces analysis - Comparison between 2024 and 2029

7.2 Bargaining power of buyers

Bargaining power of buyers - Impact of key factors 2024 and 2029

7.3 Bargaining power of suppliers

Bargaining power of suppliers - Impact of key factors in 2024 and 2029

7.4 Threat of new entrants

Threat of new entrants - Impact of key factors in 2024 and 2029

7.5 Threat of substitutes

Threat of substitutes - Impact of key factors in 2024 and 2029

7.6 Threat of rivalry

Threat of rivalry - Impact of key factors in 2024 and 2029

7.7 Market condition

Chart on Market condition - Five forces 2024 and 2029

8. Market Segmentation by Product

8.1 Market segments

Chart on Product - Market share 2024-2029 (%)
Data Table on Product - Market share 2024-2029 (%)

8.2 Comparison by Product

Chart on Comparison by Product
Data Table on Comparison by Product

8.3 Frozen - Market size and forecast 2024-2029

Chart on Frozen - Market size and forecast 2024-2029 ($ million)
Data Table on Frozen - Market size and forecast 2024-2029 ($ million)
Chart on Frozen - Year-over-year growth 2024-2029 (%)
Data Table on Frozen - Year-over-year growth 2024-2029 (%)

8.4 Chilled - Market size and forecast 2024-2029

Chart on Chilled - Market size and forecast 2024-2029 ($ million)
Data Table on Chilled - Market size and forecast 2024-2029 ($ million)
Chart on Chilled - Year-over-year growth 2024-2029 (%)
Data Table on Chilled - Year-over-year growth 2024-2029 (%)

8.5 Ambient - Market size and forecast 2024-2029

Chart on Ambient - Market size and forecast 2024-2029 ($ million)
Data Table on Ambient - Market size and forecast 2024-2029 ($ million)
Chart on Ambient - Year-over-year growth 2024-2029 (%)
Data Table on Ambient - Year-over-year growth 2024-2029 (%)

8.6 Market opportunity by Product

Market opportunity by Product ($ million)
Data Table on Market opportunity by Product ($ million)

9. Market Segmentation by Type

9.1 Market segments

Chart on Type - Market share 2024-2029 (%)
Data Table on Type - Market share 2024-2029 (%)

9.2 Comparison by Type

Chart on Comparison by Type
Data Table on Comparison by Type

9.3 Passive systems - Market size and forecast 2024-2029

Chart on Passive systems - Market size and forecast 2024-2029 ($ million)
Data Table on Passive systems - Market size and forecast 2024-2029 ($ million)
Chart on Passive systems - Year-over-year growth 2024-2029 (%)
Data Table on Passive systems - Year-over-year growth 2024-2029 (%)

9.4 Active systems - Market size and forecast 2024-2029

Chart on Active systems - Market size and forecast 2024-2029 ($ million)
Data Table on Active systems - Market size and forecast 2024-2029 ($ million)
Chart on Active systems - Year-over-year growth 2024-2029 (%)
Data Table on Active systems - Year-over-year growth 2024-2029 (%)

9.5 Market opportunity by Type

Market opportunity by Type ($ million)
Data Table on Market opportunity by Type ($ million)

10. Market Segmentation by End-user

10.1 Market segments

Chart on End-user - Market share 2024-2029 (%)
Data Table on End-user - Market share 2024-2029 (%)

10.2 Comparison by End-user

Chart on Comparison by End-user
Data Table on Comparison by End-user

10.3 Pharmaceuticals - Market size and forecast 2024-2029

Chart on Pharmaceuticals - Market size and forecast 2024-2029 ($ million)
Data Table on Pharmaceuticals - Market size and forecast 2024-2029 ($ million)
Chart on Pharmaceuticals - Year-over-year growth 2024-2029 (%)
Data Table on Pharmaceuticals - Year-over-year growth 2024-2029 (%)

10.4 Vaccines and biologics - Market size and forecast 2024-2029

Chart on Vaccines and biologics - Market size and forecast 2024-2029 ($ million)
Data Table on Vaccines and biologics - Market size and forecast 2024-2029 ($ million)
Chart on Vaccines and biologics - Year-over-year growth 2024-2029 (%)
Data Table on Vaccines and biologics - Year-over-year growth 2024-2029 (%)

10.5 Others - Market size and forecast 2024-2029

Chart on Others - Market size and forecast 2024-2029 ($ million)
Data Table on Others - Market size and forecast 2024-2029 ($ million)
Chart on Others - Year-over-year growth 2024-2029 (%)
Data Table on Others - Year-over-year growth 2024-2029 (%)

10.6 Market opportunity by End-user

Market opportunity by End-user ($ million)
Data Table on Market opportunity by End-user ($ million)

11. Customer Landscape

11.1 Customer landscape overview

Analysis of price sensitivity, lifecycle, customer purchase basket, adoption rates, and purchase criteria

12. Geographic Landscape

12.1 Geographic segmentation

Chart on Market share by geography 2024-2029 (%)
Data Table on Market share by geography 2024-2029 (%)

12.2 Geographic comparison

Chart on Geographic comparison
Data Table on Geographic comparison

12.3 North America - Market size and forecast 2024-2029

Chart on North America - Market size and forecast 2024-2029 ($ million)
Data Table on North America - Market size and forecast 2024-2029 ($ million)
Chart on North America - Year-over-year growth 2024-2029 (%)
Data Table on North America - Year-over-year growth 2024-2029 (%)
Chart on Regional Comparison - North America
Data Table on Regional Comparison - North America

12.3.1 US - Market size and forecast 2024-2029

Chart on US - Market size and forecast 2024-2029 ($ million)
Data Table on US - Market size and forecast 2024-2029 ($ million)
Chart on US - Year-over-year growth 2024-2029 (%)
Data Table on US - Year-over-year growth 2024-2029 (%)

12.3.2 Canada - Market size and forecast 2024-2029

Chart on Canada - Market size and forecast 2024-2029 ($ million)
Data Table on Canada - Market size and forecast 2024-2029 ($ million)
Chart on Canada - Year-over-year growth 2024-2029 (%)
Data Table on Canada - Year-over-year growth 2024-2029 (%)

12.4 Europe - Market size and forecast 2024-2029

Chart on Europe - Market size and forecast 2024-2029 ($ million)
Data Table on Europe - Market size and forecast 2024-2029 ($ million)
Chart on Europe - Year-over-year growth 2024-2029 (%)
Data Table on Europe - Year-over-year growth 2024-2029 (%)
Chart on Regional Comparison - Europe
Data Table on Regional Comparison - Europe

12.4.1 Germany - Market size and forecast 2024-2029

Chart on Germany - Market size and forecast 2024-2029 ($ million)
Data Table on Germany - Market size and forecast 2024-2029 ($ million)
Chart on Germany - Year-over-year growth 2024-2029 (%)
Data Table on Germany - Year-over-year growth 2024-2029 (%)

12.4.2 UK - Market size and forecast 2024-2029

Chart on UK - Market size and forecast 2024-2029 ($ million)
Data Table on UK - Market size and forecast 2024-2029 ($ million)
Chart on UK - Year-over-year growth 2024-2029 (%)
Data Table on UK - Year-over-year growth 2024-2029 (%)

12.4.3 France - Market size and forecast 2024-2029

Chart on France - Market size and forecast 2024-2029 ($ million)
Data Table on France - Market size and forecast 2024-2029 ($ million)
Chart on France - Year-over-year growth 2024-2029 (%)
Data Table on France - Year-over-year growth 2024-2029 (%)

12.4.4 Italy - Market size and forecast 2024-2029

Chart on Italy - Market size and forecast 2024-2029 ($ million)
Data Table on Italy - Market size and forecast 2024-2029 ($ million)
Chart on Italy - Year-over-year growth 2024-2029 (%)
Data Table on Italy - Year-over-year growth 2024-2029 (%)

12.5 APAC - Market size and forecast 2024-2029

Chart on APAC - Market size and forecast 2024-2029 ($ million)
Data Table on APAC - Market size and forecast 2024-2029 ($ million)
Chart on APAC - Year-over-year growth 2024-2029 (%)
Data Table on APAC - Year-over-year growth 2024-2029 (%)
Chart on Regional Comparison - APAC
Data Table on Regional Comparison - APAC

12.5.1 China - Market size and forecast 2024-2029

Chart on China - Market size and forecast 2024-2029 ($ million)
Data Table on China - Market size and forecast 2024-2029 ($ million)
Chart on China - Year-over-year growth 2024-2029 (%)
Data Table on China - Year-over-year growth 2024-2029 (%)

12.5.2 India - Market size and forecast 2024-2029

Chart on India - Market size and forecast 2024-2029 ($ million)
Data Table on India - Market size and forecast 2024-2029 ($ million)
Chart on India - Year-over-year growth 2024-2029 (%)
Data Table on India - Year-over-year growth 2024-2029 (%)

12.5.3 Japan - Market size and forecast 2024-2029

Chart on Japan - Market size and forecast 2024-2029 ($ million)
Data Table on Japan - Market size and forecast 2024-2029 ($ million)
Chart on Japan - Year-over-year growth 2024-2029 (%)
Data Table on Japan - Year-over-year growth 2024-2029 (%)

12.6 South America - Market size and forecast 2024-2029

Chart on South America - Market size and forecast 2024-2029 ($ million)
Data Table on South America - Market size and forecast 2024-2029 ($ million)
Chart on South America - Year-over-year growth 2024-2029 (%)
Data Table on South America - Year-over-year growth 2024-2029 (%)
Chart on Regional Comparison - South America
Data Table on Regional Comparison - South America

12.6.1 Brazil - Market size and forecast 2024-2029

Chart on Brazil - Market size and forecast 2024-2029 ($ million)
Data Table on Brazil - Market size and forecast 2024-2029 ($ million)
Chart on Brazil - Year-over-year growth 2024-2029 (%)
Data Table on Brazil - Year-over-year growth 2024-2029 (%)

12.6.2 Argentina - Market size and forecast 2024-2029

Chart on Argentina - Market size and forecast 2024-2029 ($ million)
Data Table on Argentina - Market size and forecast 2024-2029 ($ million)
Chart on Argentina - Year-over-year growth 2024-2029 (%)
Data Table on Argentina - Year-over-year growth 2024-2029 (%)

12.7 Middle East and Africa - Market size and forecast 2024-2029

Chart on Middle East and Africa - Market size and forecast 2024-2029 ($ million)
Data Table on Middle East and Africa - Market size and forecast 2024-2029 ($ million)
Chart on Middle East and Africa - Year-over-year growth 2024-2029 (%)
Data Table on Middle East and Africa - Year-over-year growth 2024-2029 (%)
Chart on Regional Comparison - Middle East and Africa
Data Table on Regional Comparison - Middle East and Africa

12.7.1 Saudi Arabia - Market size and forecast 2024-2029

Chart on Saudi Arabia - Market size and forecast 2024-2029 ($ million)
Data Table on Saudi Arabia - Market size and forecast 2024-2029 ($ million)
Chart on Saudi Arabia - Year-over-year growth 2024-2029 (%)
Data Table on Saudi Arabia - Year-over-year growth 2024-2029 (%)

12.7.2 UAE - Market size and forecast 2024-2029

Chart on UAE - Market size and forecast 2024-2029 ($ million)
Data Table on UAE - Market size and forecast 2024-2029 ($ million)
Chart on UAE - Year-over-year growth 2024-2029 (%)
Data Table on UAE - Year-over-year growth 2024-2029 (%)

12.7.3 South Africa - Market size and forecast 2024-2029

Chart on South Africa - Market size and forecast 2024-2029 ($ million)
Data Table on South Africa - Market size and forecast 2024-2029 ($ million)
Chart on South Africa - Year-over-year growth 2024-2029 (%)
Data Table on South Africa - Year-over-year growth 2024-2029 (%)

12.8 Market opportunity by geography

Market opportunity by geography ($ million)
Data Tables on Market opportunity by geography ($ million)

13. Drivers, Challenges, and Opportunity

13.1 Market drivers

Growth in demand for reefer containers from pharmaceutical industry
Increase in number of refrigerated warehouses
Increase in global demand for pharmaceuticals

13.2 Market challenges

Lack of logistics infrastructure and low adoption of automated technologies
Lack of awareness regarding temperature controlled pharmaceutical packaging solutions
Increase in operational costs due to functional barriers in cold chain logistics

13.3 Impact of drivers and challenges

Impact of drivers and challenges in 2024 and 2029

13.4 Market opportunities

Growing focus on traditional strategies like acquisition by market companies
Growing number of temperature controlled pharmaceutical packaging product launches by market companies
Rising popularity of blockchain and artificial intelligence technology in logistics industry

14. Competitive Landscape

14.1 Overview

14.2

Overview on criticality of inputs and factors of differentiation

14.3 Landscape disruption

Overview on factors of disruption

14.4 Industry risks

Impact of key risks on business

15. Competitive Analysis

15.1 Companies profiled

Companies covered

15.2 Company ranking index

15.3 Market positioning of companies

Matrix on companies position and classification

15.4 Aeris Dynamics

Aeris Dynamics - Overview
Aeris Dynamics - Product / Service
Aeris Dynamics - Key offerings
SWOT

15.5 American Aerogel

American Aerogel - Overview
American Aerogel - Product / Service
American Aerogel - Key offerings
SWOT

15.6 Cold Chain Technologies

Cold Chain Technologies - Overview
Cold Chain Technologies - Product / Service
Cold Chain Technologies - Key offerings
SWOT

15.7 Cryo Store B.V.

Cryo Store B.V. - Overview
Cryo Store B.V. - Product / Service
Cryo Store B.V. - Key offerings
SWOT

15.8 DGP Intelsius Ltd.

DGP Intelsius Ltd. - Overview
DGP Intelsius Ltd. - Product / Service
DGP Intelsius Ltd. - Key offerings
SWOT

15.9 DoKaSch GmbH

DoKaSch GmbH - Overview
DoKaSch GmbH - Product / Service
DoKaSch GmbH - Key offerings
SWOT

15.10 DS Smith Plc

DS Smith Plc - Overview
DS Smith Plc - Business segments
DS Smith Plc - Key news
DS Smith Plc - Key offerings
DS Smith Plc - Segment focus
SWOT

15.11 Envirotainer AB

Envirotainer AB - Overview
Envirotainer AB - Product / Service
Envirotainer AB - Key offerings
SWOT

15.12 FUCHS SE

FUCHS SE - Overview
FUCHS SE - Business segments
FUCHS SE - Key news
FUCHS SE - Key offerings
FUCHS SE - Segment focus
SWOT

15.13 Hazgo

Hazgo - Overview
Hazgo - Product / Service
Hazgo - Key offerings
SWOT

15.14 Inmark Global Holdings LLC.

Inmark Global Holdings LLC. - Overview
Inmark Global Holdings LLC. - Product / Service
Inmark Global Holdings LLC. - Key offerings
SWOT

15.15 Integreon Global

Integreon Global - Overview
Integreon Global - Product / Service
Integreon Global - Key offerings
SWOT

15.16 Pelican Products Inc.

Pelican Products Inc. - Overview
Pelican Products Inc. - Product / Service
Pelican Products Inc. - Key offerings
SWOT

15.17 Rapid Aid Corp.

Rapid Aid Corp. - Overview
Rapid Aid Corp. - Product / Service
Rapid Aid Corp. - Key offerings
SWOT

15.18 Sofrigam

Sofrigam - Overview
Sofrigam - Product / Service
Sofrigam - Key offerings
SWOT

15.19 Sonoco Products Co.

Sonoco Products Co. - Overview
Sonoco Products Co. - Business segments
Sonoco Products Co. - Key news
Sonoco Products Co. - Key offerings
Sonoco Products Co. - Segment focus
SWOT

16. Appendix

16.1 Scope of the report

Market definition
Objectives
Notes and caveats

16.2 Inclusions and exclusions checklist

Inclusions checklist
Exclusions checklist

16.3 Currency conversion rates for US$

16.4 Research methodology

16.5 Data procurement

Information sources

16.6 Data validation

16.7 Validation techniques employed for market sizing

16.8 Data synthesis

16.9 360 degree market analysis

16.10 List of abbreviations

Research Methodology

Technavio presents a detailed picture of the market by way of study, synthesis, and summation of data from multiple sources. The analysts have presented the various facets of the market with a particular focus on identifying the key industry influencers. The data thus presented is comprehensive, reliable, and the result of extensive research, both primary and secondary.

INFORMATION SOURCES

Primary sources

  • Manufacturers and suppliers
  • Channel partners
  • Industry experts
  • Strategic decision makers

Secondary sources

  • Industry journals and periodicals
  • Government data
  • Financial reports of key industry players
  • Historical data
  • Press releases

DATA ANALYSIS

Data Synthesis

  • Collation of data
  • Estimation of key figures
  • Analysis of derived insights

Data Validation

  • Triangulation with data models
  • Reference against proprietary databases
  • Corroboration with industry experts

REPORT WRITING

Qualitative

  • Market drivers
  • Market challenges
  • Market trends
  • Five forces analysis

Quantitative

  • Market size and forecast
  • Market segmentation
  • Geographical insights
  • Competitive landscape

Interested in this report?

Get your sample now to see our research methodology and insights!

Download Now

Frequently Asked Questions

Temperature Controlled Pharmaceutical Packaging Solutions market growth will increase by USD 5882.4 million during 2025-2029.

The Temperature Controlled Pharmaceutical Packaging Solutions market is expected to grow at a CAGR of 12.7% during 2025-2029.

Temperature Controlled Pharmaceutical Packaging Solutions market is segmented by Product (Frozen, Chilled, Ambient) Type (Passive systems, Active systems) End-user (Pharmaceuticals, Vaccines and biologics, Others)

Aeris Dynamics, American Aerogel, Cencora Inc., Cold Chain Technologies, Cryo Store B.V., CSafe Global, DGP Intelsius Ltd., DoKaSch GmbH, DS Smith Plc, Envirotainer AB, FUCHS SE, Hazgo, Inmark Global Holdings LLC., Integreon Global, Pelican Products Inc., Rapid Aid Corp., Sofrigam, Sonoco Products Co., va Q tec Thermal Solutions GmbH are a few of the key vendors in the Temperature Controlled Pharmaceutical Packaging Solutions market.

North America will register the highest growth rate of 32.9% among the other regions. Therefore, the Temperature Controlled Pharmaceutical Packaging Solutions market in North America is expected to garner significant business opportunities for the vendors during the forecast period.

US, Canada, Germany, UK, France, Italy, China, India, Japan, Brazil, Argentina, Saudi Arabia, UAE, South Africa

  • Growth in demand for reefer containers from pharmaceutical industry is the driving factor this market.

The Temperature Controlled Pharmaceutical Packaging Solutions market vendors should focus on grabbing business opportunities from the Product segment as it accounted for the largest market share in the base year.
RIA - Research AI Assistant
Ask RIA