Textile Pretreatment Chemicals Market Analysis APAC, North America, Europe, South America, Middle East and Africa - US, China, India, Japan, Germany - Size and Forecast 2024-2028

Textile Pretreatment Chemicals Market Analysis APAC, North America, Europe, South America, Middle East and Africa - US, China, India, Japan, Germany - Size and Forecast 2024-2028

Published: Feb 2024 174 Pages SKU: IRTNTR77591

Market Overview at a Glance

$1.76 B
Market Opportunity
4.9%
CAGR
4.19
YoY growth 2023-2024(%)

Textile Pretreatment Chemicals Market Size 2024-2028

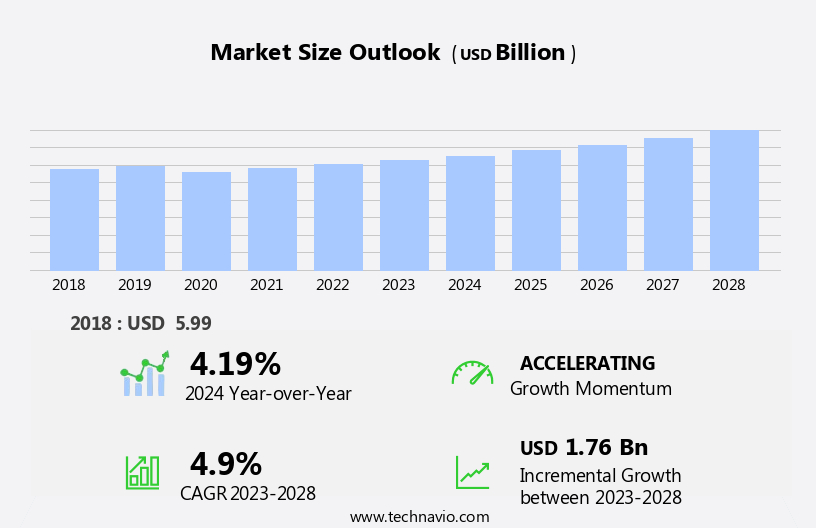
The textile pretreatment chemicals market size is forecast to increase by USD 1.76 billion at a CAGR of 4.9% between 2023 and 2028.

  • The market is experiencing significant growth due to several key factors. The expanding textile industry in developing economies is driving market demand, as these countries increase their production capacity to meet global demand. Additionally, there is a growing trend toward eco-friendly and sustainable chemicals in textile industries, as consumers become more conscious of the environmental impact of their purchases. Strict environmental regulations related to the use of textile chemicals are also pushing companies to adopt more sustainable practices. These regulations ensure that textile manufacturers comply with standards that limit the use of harmful chemicals in textile production processes. This market analysis report provides a comprehensive study of these growth factors and the challenges they present to market participants.
  • What will be the Size of the Textile Pretreatment Chemicals Market During the Forecast Period?

    Textile Pretreatment Chemicals Market Size

     Request Free Sample

  • The market encompasses a wide range of substances used In the production of apparel, technical textiles, and home textiles. These chemicals play a crucial role in enhancing the performance and quality of textile products by facilitating construction processes such as waterproofing, fire resistance, and softening. The market's growth is driven by increasing production capacities in various sectors, including the real estate sector for furnishing and home décor, and the fashion industry for clothes and technical textiles. Population growth and evolving consumer preferences towards sustainable and eco-friendly textiles have led to an uptick in demand for bio-chemicals like rapeseed oil, beeswax, and wicking agents.
  • Pre-pandemic levels of production have resumed, with key applications including deaerators, defoamers, and coating processes. The textile magazine reports on the latest trends, including historical data and forecasts, for this dynamic market. Textile pretreatment chemicals are essential for the production of textile fabrics and textile products, and their application scope continues to expand with advancements in technology and consumer preferences.
  • How is this Textile Pretreatment Chemicals Industry segmented and which is the largest segment?

    The textile pretreatment chemicals industry research report provides comprehensive data (region-wise segment analysis), with forecasts and estimates in "USD billion" for the period 2024-2028, as well as historical data from 2018-2022 for the following segments.

    • Application
      • Apparel
      • Home textile
      • Technical textile
    • Product Type
      • Scouring agents
      • Desizing agents
      • Bleaching agents
      • Mercerizing agents
      • Others
    • Geography
      • APAC
        • China
        • India
        • Japan
      • North America
        • US
      • Europe
        • Germany
      • South America
        • Middle East and Africa

        By Application Insights

        • The apparel segment is estimated to witness significant growth during the forecast period.

        Pretreatment chemicals play a crucial role In the textile industry, particularly In the production of apparel, technical textiles, and home textiles. These chemicals prepare textiles for various processes, including dyeing, printing, and finishing, ensuring the final product meets consumer preferences. In the apparel sector, textiles undergo several pretreatment processes, such as desizing, scouring, bleaching, and mercerizing. Desizing agents remove sizing materials from yarns, enabling weaving but necessitating elimination before further processing. Scouring agents clean and prepare textiles for dyeing, while bleaching agents lighten the color of textiles. Mercerizing agents improve fabric quality by enhancing color vibrancy and softness. Other pretreatment chemicals include softeners, beeswax, deaerators, defoamers, and various bio-chemicals.

        These agents contribute to the production of textile products, including denim, geotextiles, outdoor wear, and aerospace applications. Consumer trends, such as disposable incomes, millennial and Gen Z population, social media, and fashion icons, influence the demand for textile products, driving the need for advanced pretreatment chemicals. Applications of pretreatment chemicals extend to construction, real estate, and various industries, including medtech, buildtech, and protech. Key players In the industry include the American Chemistry Council, which advocates for the use of sustainable and innovative pretreatment chemicals. Online dashboards and historical data provide insights into volume consumption, production capacities, and regional opportunities. Forecasts indicate continued growth In the market, driven by the latest trends and advancements In the coating process, waterproofing, fire resistance, stain repellence, and denim finishing agents.

        Textile Pretreatment Chemicals Market Size

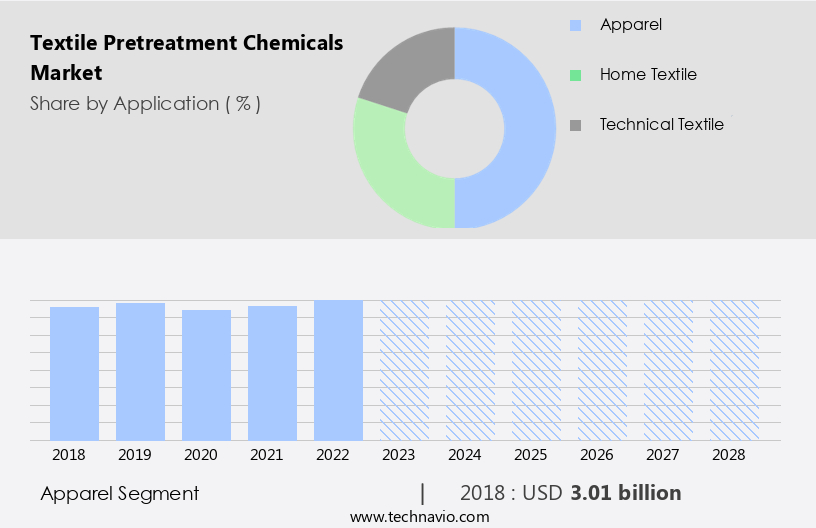
        Get a glance at the  Textile Pretreatment Chemicals Industry report of share of various segments Request Free Sample

        The Apparel segment was valued at USD 3.01 billion in 2018 and showed a gradual increase during the forecast period.
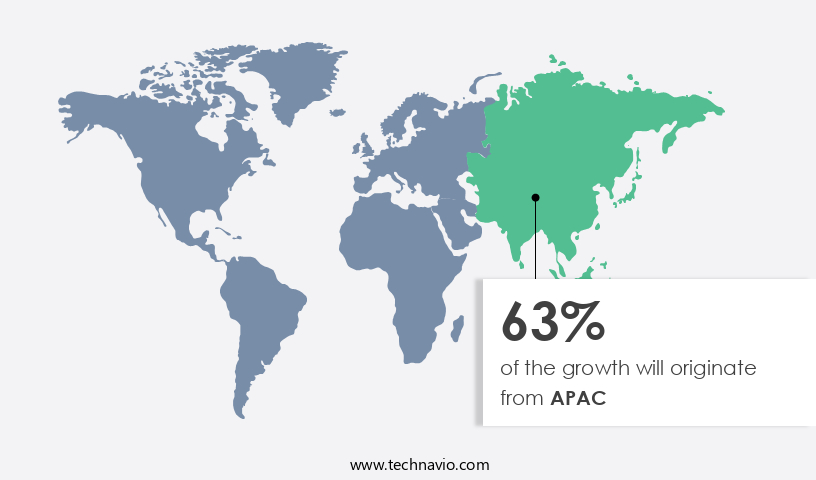
        Regional Analysis

        • APAC is estimated to contribute 63% to the growth of the global market during the forecast period.

        Technavio’s analysts have elaborately explained the regional trends and drivers that shape the market during the forecast period.

        Textile Pretreatment Chemicals Market Share by Geography

        For more insights on the market share of various regions, Request Free Sample

        The APAC region is the leading contributor to The market, driven by its extensive textile manufacturing industry and large consumer base. Key countries, including China, India, Bangladesh, and Vietnam, play a significant role as both producers and consumers of textile products. This dual position is supported by their abundant labor force, cost-effective production capacities, and expanding middle class, which collectively drive demand for various textile goods. China and India, in particular, are crucial players In the APAC the market due to their vast production capabilities and growing domestic markets. The textile industry's dynamic growth In the region is fueled by increasing production volumes, application scope in various sectors like apparel, technical textiles, and home textiles, and consumer preferences for textile products with enhanced properties such as waterproofing, fire resistance, and stain repellence.

        Key application areas include denim finishing agents, enzymes, anti-back staining agents, and bleaching agents. The market is expected to continue its growth trajectory, with potential opportunities in construction, real estate, fashion trends, home décor, furnishing, and various industrial applications. Bio-chemicals, such as deaerators, defoamers, and wicking agents, are gaining popularity due to their eco-friendly nature and improved performance. Key factors influencing the market include population growth, disposable incomes, and the influence of fashion trends and fashion icons on consumer preferences.

        Market Dynamics

        Our  researchers analyzed the data with 2023 as the base year, along with the key drivers, trends, and challenges. A holistic analysis of drivers will help companies refine their marketing strategies to gain a competitive advantage.

        What are the key market drivers leading to the rise In the adoption of Textile Pretreatment Chemicals Industry?

        Growing textile industry in developing economies is the key driver of the market.

      • The market encompasses a wide range of applications In the textile industry, including apparel, technical textiles, and home textiles. The market's growth is influenced by several factors, such as population growth, increasing disposable incomes, and shifting consumer preferences. In the US, the textile industry is witnessing significant advancements in production capacities and application scope. For instance, the use of textile pretreatment chemicals in denim finishing agents, mercerizing agents, and hydrophilic finishing agents is gaining popularity. The American Chemistry Council (ACC) reports that volume consumption of textile pretreatment chemicals In the US reached 1.2 million metric tons in 2020. The construction sector, real estate, and fashion industries are significant consumers of textile pretreatment chemicals In the US.
      • In the construction sector, these chemicals are used for waterproofing, fire resistance, and stain repellence in textile fabrics. In the fashion industry, wicking agents, softeners, beeswax, deaerators, defoamer, and rapeseed oil are widely used In the coating process. The market is also witnessing the latest trends, such as the use of bio-chemicals, dextrin, wheat starch, corn starch, gelatin, polyvinyl alcohol, acrylates, modified starch, dyes, pigments, singeing, padding, printing, finishing, oil-repellent, water-repellent, flame-retardant, antistatic, and apparel applications. The market is expected to grow further due to the increasing demand for textile products in various sectors, including medical textiles (Medtech), building textiles (Buildtech), and protective textiles (Protech).
      • The market is also influenced by consumer preferences for sustainable and eco-friendly products. Therefore, the use of natural and renewable resources In the production of textile pretreatment chemicals is becoming increasingly popular. The online dashboard provided by Textile Magazine offers historical data and forecasts for the market, providing valuable insights for industry stakeholders. The regional opportunities for the market are vast, with Asia Pacific being a significant contributor due to its large population and growing textile industry. In conclusion, the market is a dynamic and growing industry, driven by various factors, including population growth, economic development, technological advancements, and shifting consumer preferences.
      • The market's application scope is vast, with significant opportunities in various sectors, including apparel, technical textiles, home textiles, construction, real estate, fashion, and various protective textiles applications. The use of sustainable and eco-friendly textile pretreatment chemicals is becoming increasingly important, and the industry is expected to continue growing In the coming years.
      • What are the market trends shaping the Textile Pretreatment Chemicals Industry?

        Growing shift toward eco-friendly and sustainable chemicals in textile industries is the upcoming market trend.

      • The market is witnessing significant growth due to the increasing production capacities of apparel, technical textiles, and home textiles. The American Chemistry Council reports a rise in volume consumption of textile pretreatment chemicals in various applications such as construction, fashion trends, home décor, furnishing, and application scope. Consumer preferences for eco-friendly and sustainable chemicals are driving innovation, with companies exploring bio-chemicals like enzymes, Dextrin, wheat starch, corn starch, gelatin, and Polyvinyl alcohol. These alternatives offer water-repellent, flame-retardant, antistatic, and stain-repellent properties, among others, in apparel applications. The real estate sector, geotextiles, outdoor wear, aerospace applications, and medtech, buildtech, and protech industries also contribute to the market's expansion.
      • Key trends include the use of wicking agents, softeners, beeswax, deaerators, defoamer, rapeseed oil, and online dashboards for historical data and forecasts. Regional opportunities and the latest trends in textile pretreatment chemicals are continually evolving, with online platforms providing valuable insights. The coating process, waterproofing, fire resistance, mercerizing, hydrophilic, and various finishing processes further expand the market's application scope.
      • What challenges does the Textile Pretreatment Chemicals Industry face during its growth?

        Stringent environmental regulations related to use of textile chemicals is a key challenge affecting the industry growth.

      • The market encompasses a wide range of chemicals used In the production of apparel, technical textiles, and home textiles. These chemicals facilitate various processes such as mercerizing, hydrophilic finishing, denim finishing, and coating for waterproofing, fire resistance, and stain repellence. The market scope includes application areas In the real estate sector for construction textiles, home décor and furnishing, fashion trends, and various industrial applications in medtech, buildtech, and protech. Population growth, particularly among the millennial and Gen Z demographics with increasing disposable incomes, fuels the demand for textile products. Consumer preferences for eco-friendly and sustainable textiles drive the adoption of bio-chemicals such as beeswax, deaerators, defoamer, rapeseed oil, and modified starches.
      • Environmental regulations significantly impact the market dynamics, with stringent rules aimed at minimizing the environmental footprint of textile processing. For instance, the European Union's REACH regulation imposes guidelines on the use of chemicals, including those used in textile pretreatment, to ensure they do not pose a risk to human health or the environment. This regulation influences the development and use of pretreatment chemicals, necessitating companies to register chemicals and provide safety information before marketing In the EU. Historical data and forecasts indicate a steady growth trend for the market, with regional opportunities in Asia Pacific, Europe, and North America.
      • Latest trends include the use of online dashboards for real-time monitoring of production capacities, and the integration of digital technologies In the coating process for improved efficiency and quality. Key application areas include apparel, where pretreatment chemicals enhance the look, feel, and functionality of clothes, and technical textiles, which require specific treatments for enhanced performance in various industries. Other sectors include home textiles, construction, and aerospace applications. The market is characterized by a diverse range of products, including wicking agents, softeners, singeing agents, padding, printing, and finishing chemicals. These chemicals facilitate various processes such as mercerizing, hydrophilic finishing, denim finishing, and coating for waterproofing, fire resistance, and stain repellence.
      • Some common chemicals used in textile pretreatment include bleaching agents, enzymes, anti-back staining agents, and dispersants. These chemicals play a crucial role In the production of textile fabrics and textile products, ensuring their quality, durability, and functionality. In summary, the market is a dynamic and evolving industry, driven by consumer preferences, environmental regulations, and technological advancements. Companies must navigate the regulatory landscape and adapt to changing consumer demands to remain competitive in this market.
      • Exclusive Customer Landscape

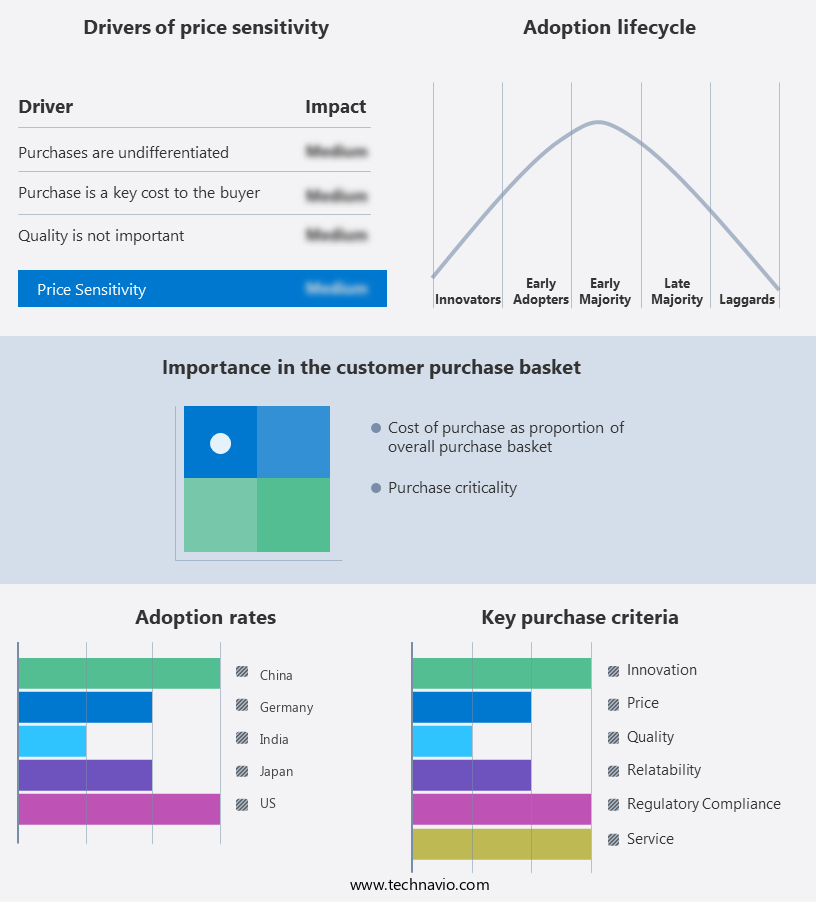
        The textile pretreatment chemicals market forecasting report includes the adoption lifecycle of the market, covering from the innovator’s stage to the laggard’s stage. It focuses on adoption rates in different regions based on penetration. Furthermore, the textile pretreatment chemicals market report also includes key purchase criteria and drivers of price sensitivity to help companies evaluate and develop their market growth analysis strategies.

        Textile Pretreatment Chemicals Market Share by Geography

         Customer Landscape

        Key Companies & Market Insights

        Companies are implementing various strategies, such as strategic alliances, textile pretreatment chemicals market forecast, partnerships, mergers and acquisitions, geographical expansion, and product/service launches, to enhance their presence In the industry.

        ABH Biochem Pvt. Ltd. - Textile pretreatment chemicals play a crucial role In the textile industry, enhancing the quality and performance of various fabrics. These chemicals include soaping agents and wetting agents, which facilitate effective cleaning, improved dyeability, and enhanced softness in towels and textiles. Soaping agents, also known as builders, remove dirt and impurities by forming complexes with calcium and magnesium ions present in hard water. Wetting agents, on the other hand, reduce the surface tension of water, ensuring even distribution and penetration during the washing process. By utilizing these and other specialized textile pretreatment chemicals, manufacturers ensure superior product quality and consumer satisfaction.

        The industry research and growth report includes detailed analyses of the competitive landscape of the market and information about key companies, including:

        • ABH Biochem Pvt. Ltd.
        • APL
        • Belle Laboratories Pvt. Ltd. 
        • BHATIA COLOUR CHEM LTD.
        • CHT Germany GmbH
        • Dow Chemical Co.
        • Dye Cells India
        • Embassy silicones
        • HT Fine Chemical Co. Ltd.
        • Matangi Industries
        • Mirachem Industries
        • OSAM SPECIALITY CHEMICALS PVT. LTD.
        • Pacific Texchem Pvt. Ltd.
        • Pink Rose Pigments Pvt. Ltd.
        • Pon Pure Chemicals Group
        • Prakash Chemicals Agencies Pvt. Ltd.
        • Sarex
        • Sigmachemie Speciality Pvt. Ltd.
        • Suman Chemical Industries
        • Thurs Organics Pvt. Ltd.

        Qualitative and quantitative analysis of companies has been conducted to help clients understand the wider business environment as well as the strengths and weaknesses of key industry players. Data is qualitatively analyzed to categorize companies as pure play, category-focused, industry-focused, and diversified; it is quantitatively analyzed to categorize companies as dominant, leading, strong, tentative, and weak.

        Research Analyst Overview

        The market encompasses a broad range of substances used to prepare textiles for various applications. These chemicals play a crucial role in enhancing the functionality and appearance of textiles, making them suitable for diverse industries such as apparel, technical textiles, and home textiles. Textile pretreatment chemicals serve multiple purposes In the textile manufacturing process. They help improve the dyeability of fabrics, enhance their durability, and provide desirable textures and finishes. The application scope of these chemicals is vast, extending to various sectors, including construction, real estate, and various industries with specific textile requirements. The market exhibits dynamic market trends, driven by evolving consumer preferences and technological advancements.

        One significant trend is the increasing demand for eco-friendly and sustainable textile treatments. Bio-chemicals, derived from renewable resources, are gaining popularity due to their reduced environmental impact and improved performance. Wicking agents, softeners, and deaerators are among the commonly used bio-chemicals in textile pretreatment. Another trend is the growing application of textile pretreatment chemicals in high-performance textiles. These chemicals contribute to the production of textiles with advanced properties such as waterproofing, fire resistance, and stain repellence. Denim finishing agents, enzymes, anti-back staining agents, and bleaching agents are some of the essential chemicals used in denim finishing and other high-performance textile applications.

        The market is influenced by various factors, including production capacities, consumer preferences, and technological advancements. The market has seen significant growth in recent years due to the increasing demand for textiles with enhanced functionality and improved performance. The market is expected to continue its upward trajectory, driven by the growing demand for technical textiles and the expanding application scope of textile pretreatment chemicals in various industries. Textile pretreatment chemicals are used in various textile manufacturing processes, including mercerizing, hydrophilic treatment, and coating processes. Mercerizing is a process that improves the brightness and colorfastness of textiles, while hydrophilic treatment enhances the fabric's water-absorbing capacity.

        Coating processes involve applying a thin layer of chemicals to the fabric's surface to improve its performance and appearance. Textile pretreatment chemicals are used in various applications, including apparel, technical textiles, and home textiles. In apparel applications, these chemicals are used to improve the fabric's texture, color, and durability. In technical textiles, they contribute to the production of high-performance textiles used in industries such as aerospace, automotive, and construction. In home textiles, textile pretreatment chemicals are used to enhance the fabric's appearance, texture, and durability, making them suitable for various home décor and furnishing applications. The market is expected to offer significant opportunities in various regions, driven by the growing demand for textiles with advanced properties and the expanding application scope of textile pretreatment chemicals in various industries.

        The market is expected to witness significant growth in regions with a large population and a growing middle class, as disposable incomes increase and consumer preferences shift towards high-performance textiles. In conclusion, the market is a dynamic and growing industry, driven by evolving consumer preferences and technological advancements. These chemicals play a crucial role in enhancing the functionality and appearance of textiles, making them suitable for various applications in diverse industries. The market is expected to continue its upward trajectory, driven by the growing demand for high-performance textiles and the expanding application scope of textile pretreatment chemicals.

        Market Scope

        Report Coverage

        Details

        Page number

        174

        Base year

        2023

        Historic period

        2018-2022

        Forecast period

        2024-2028

        Growth momentum & CAGR

        Accelerate at a CAGR of 4.9%

        Market growth 2024-2028

        USD 1.76 billion

        Market structure

        Fragmented

        YoY growth 2023-2024(%)

        4.19

        Key countries

        US, China, India, Japan, and Germany

        Competitive landscape

        Leading Companies, Market Positioning of Companies, Competitive Strategies, and Industry Risks

        Request Free Sample

        What are the Key Data Covered in this Textile Pretreatment Chemicals Market Research and Growth Report?

        • CAGR of the Textile Pretreatment Chemicals industry during the forecast period
        • Detailed information on factors that will drive the growth and forecasting between 2024 and 2028
        • Precise estimation of the size of the market and its contribution of the industry in focus to the parent market
        • Accurate predictions about upcoming growth and trends and changes in consumer behaviour
        • Growth of the market across APAC, North America, Europe, South America, and Middle East and Africa
        • Thorough analysis of the market’s competitive landscape and detailed information about companies
        • Comprehensive analysis of factors that will challenge the textile pretreatment chemicals market growth of industry companies

        We can help! Our analysts can customize this textile pretreatment chemicals market research report to meet your requirements.

        Get in touch


        1 Executive Summary

        • 1.1 Market overview
          • Exhibit 01: Executive Summary – Chart on Market Overview
          • Exhibit 02: Executive Summary – Data Table on Market Overview
          • Exhibit 03: Executive Summary – Chart on Global Market Characteristics
          • Exhibit 04: Executive Summary – Chart on Market by Geography
          • Exhibit 05: Executive Summary – Chart on Market Segmentation by Application
          • Exhibit 06: Executive Summary – Chart on Market Segmentation by Product Type
          • Exhibit 07: Executive Summary – Chart on Incremental Growth
          • Exhibit 08: Executive Summary – Data Table on Incremental Growth
          • Exhibit 09: Executive Summary – Chart on Vendor Market Positioning

        2 Market Landscape

        • 2.1 Market ecosystem
          • Exhibit 10: Parent market
          • Exhibit 11: Market Characteristics

        3 Market Sizing

        • 3.1 Market definition
          • Exhibit 12: Offerings of vendors included in the market definition
        • 3.2 Market segment analysis
          • Exhibit 13: Market segments
        • 3.3 Market size 2023
          • 3.4 Market outlook: Forecast for 2023-2028
            • Exhibit 14: Chart on Global - Market size and forecast 2023-2028 ($ billion)
            • Exhibit 15: Data Table on Global - Market size and forecast 2023-2028 ($ billion)
            • Exhibit 16: Chart on Global Market: Year-over-year growth 2023-2028 (%)
            • Exhibit 17: Data Table on Global Market: Year-over-year growth 2023-2028 (%)

          4 Historic Market Size

          • 4.1 Global textile pretreatment chemicals market 2018 - 2022
            • Exhibit 18: Historic Market Size – Data Table on global textile pretreatment chemicals market 2018 - 2022 ($ billion)
          • 4.2 Application Segment Analysis 2018 - 2022
            • Exhibit 19: Historic Market Size – Application Segment 2018 - 2022 ($ billion)
          • 4.3 Product type Segment Analysis 2018 - 2022
            • Exhibit 20: Historic Market Size – Product type Segment 2018 - 2022 ($ billion)
          • 4.4 Geography Segment Analysis 2018 - 2022
            • Exhibit 21: Historic Market Size – Geography Segment 2018 - 2022 ($ billion)
          • 4.5 Country Segment Analysis 2018 - 2022
            • Exhibit 22: Historic Market Size – Country Segment 2018 - 2022 ($ billion)

          5 Five Forces Analysis

          • 5.1 Five forces summary
            • Exhibit 23: Five forces analysis - Comparison between 2023 and 2028
          • 5.2 Bargaining power of buyers
            • Exhibit 24: Chart on Bargaining power of buyers – Impact of key factors 2023 and 2028
          • 5.3 Bargaining power of suppliers
            • Exhibit 25: Bargaining power of suppliers – Impact of key factors in 2023 and 2028
          • 5.4 Threat of new entrants
            • Exhibit 26: Threat of new entrants – Impact of key factors in 2023 and 2028
          • 5.5 Threat of substitutes
            • Exhibit 27: Threat of substitutes – Impact of key factors in 2023 and 2028
          • 5.6 Threat of rivalry
            • Exhibit 28: Threat of rivalry – Impact of key factors in 2023 and 2028
          • 5.7 Market condition
            • Exhibit 29: Chart on Market condition - Five forces 2023 and 2028

          6 Market Segmentation by Application

          • 6.1 Market segments
            • Exhibit 30: Chart on Application - Market share 2023-2028 (%)
            • Exhibit 31: Data Table on Application - Market share 2023-2028 (%)
          • 6.2 Comparison by Application
            • Exhibit 32: Chart on Comparison by Application
            • Exhibit 33: Data Table on Comparison by Application
          • 6.3 Apparel - Market size and forecast 2023-2028
            • Exhibit 34: Chart on Apparel - Market size and forecast 2023-2028 ($ billion)
            • Exhibit 35: Data Table on Apparel - Market size and forecast 2023-2028 ($ billion)
            • Exhibit 36: Chart on Apparel - Year-over-year growth 2023-2028 (%)
            • Exhibit 37: Data Table on Apparel - Year-over-year growth 2023-2028 (%)
          • 6.4 Home textile - Market size and forecast 2023-2028
            • Exhibit 38: Chart on Home textile - Market size and forecast 2023-2028 ($ billion)
            • Exhibit 39: Data Table on Home textile - Market size and forecast 2023-2028 ($ billion)
            • Exhibit 40: Chart on Home textile - Year-over-year growth 2023-2028 (%)
            • Exhibit 41: Data Table on Home textile - Year-over-year growth 2023-2028 (%)
          • 6.5 Technical textile - Market size and forecast 2023-2028
            • Exhibit 42: Chart on Technical textile - Market size and forecast 2023-2028 ($ billion)
            • Exhibit 43: Data Table on Technical textile - Market size and forecast 2023-2028 ($ billion)
            • Exhibit 44: Chart on Technical textile - Year-over-year growth 2023-2028 (%)
            • Exhibit 45: Data Table on Technical textile - Year-over-year growth 2023-2028 (%)
          • 6.6 Market opportunity by Application
            • Exhibit 46: Market opportunity by Application ($ billion)
            • Exhibit 47: Data Table on Market opportunity by Application ($ billion)

          7 Market Segmentation by Product Type

          • 7.1 Market segments
            • Exhibit 48: Chart on Product Type - Market share 2023-2028 (%)
            • Exhibit 49: Data Table on Product Type - Market share 2023-2028 (%)
          • 7.2 Comparison by Product Type
            • Exhibit 50: Chart on Comparison by Product Type
            • Exhibit 51: Data Table on Comparison by Product Type
          • 7.3 Scouring agents - Market size and forecast 2023-2028
            • Exhibit 52: Chart on Scouring agents - Market size and forecast 2023-2028 ($ billion)
            • Exhibit 53: Data Table on Scouring agents - Market size and forecast 2023-2028 ($ billion)
            • Exhibit 54: Chart on Scouring agents - Year-over-year growth 2023-2028 (%)
            • Exhibit 55: Data Table on Scouring agents - Year-over-year growth 2023-2028 (%)
          • 7.4 Desizing agents - Market size and forecast 2023-2028
            • Exhibit 56: Chart on Desizing agents - Market size and forecast 2023-2028 ($ billion)
            • Exhibit 57: Data Table on Desizing agents - Market size and forecast 2023-2028 ($ billion)
            • Exhibit 58: Chart on Desizing agents - Year-over-year growth 2023-2028 (%)
            • Exhibit 59: Data Table on Desizing agents - Year-over-year growth 2023-2028 (%)
          • 7.5 Bleaching agents - Market size and forecast 2023-2028
            • Exhibit 60: Chart on Bleaching agents - Market size and forecast 2023-2028 ($ billion)
            • Exhibit 61: Data Table on Bleaching agents - Market size and forecast 2023-2028 ($ billion)
            • Exhibit 62: Chart on Bleaching agents - Year-over-year growth 2023-2028 (%)
            • Exhibit 63: Data Table on Bleaching agents - Year-over-year growth 2023-2028 (%)
          • 7.6 Mercerizing agents - Market size and forecast 2023-2028
            • Exhibit 64: Chart on Mercerizing agents - Market size and forecast 2023-2028 ($ billion)
            • Exhibit 65: Data Table on Mercerizing agents - Market size and forecast 2023-2028 ($ billion)
            • Exhibit 66: Chart on Mercerizing agents - Year-over-year growth 2023-2028 (%)
            • Exhibit 67: Data Table on Mercerizing agents - Year-over-year growth 2023-2028 (%)
          • 7.7 Others - Market size and forecast 2023-2028
            • Exhibit 68: Chart on Others - Market size and forecast 2023-2028 ($ billion)
            • Exhibit 69: Data Table on Others - Market size and forecast 2023-2028 ($ billion)
            • Exhibit 70: Chart on Others - Year-over-year growth 2023-2028 (%)
            • Exhibit 71: Data Table on Others - Year-over-year growth 2023-2028 (%)
          • 7.8 Market opportunity by Product Type
            • Exhibit 72: Market opportunity by Product Type ($ billion)
            • Exhibit 73: Data Table on Market opportunity by Product Type ($ billion)

          8 Customer Landscape

          • 8.1 Customer landscape overview
            • Exhibit 74: Analysis of price sensitivity, lifecycle, customer purchase basket, adoption rates, and purchase criteria

          9 Geographic Landscape

          • 9.1 Geographic segmentation
            • Exhibit 75: Chart on Market share by geography 2023-2028 (%)
            • Exhibit 76: Data Table on Market share by geography 2023-2028 (%)
          • 9.2 Geographic comparison
            • Exhibit 77: Chart on Geographic comparison
            • Exhibit 78: Data Table on Geographic comparison
          • 9.3 APAC - Market size and forecast 2023-2028
            • Exhibit 79: Chart on APAC - Market size and forecast 2023-2028 ($ billion)
            • Exhibit 80: Data Table on APAC - Market size and forecast 2023-2028 ($ billion)
            • Exhibit 81: Chart on APAC - Year-over-year growth 2023-2028 (%)
            • Exhibit 82: Data Table on APAC - Year-over-year growth 2023-2028 (%)
          • 9.4 North America - Market size and forecast 2023-2028
            • Exhibit 83: Chart on North America - Market size and forecast 2023-2028 ($ billion)
            • Exhibit 84: Data Table on North America - Market size and forecast 2023-2028 ($ billion)
            • Exhibit 85: Chart on North America - Year-over-year growth 2023-2028 (%)
            • Exhibit 86: Data Table on North America - Year-over-year growth 2023-2028 (%)
          • 9.5 Europe - Market size and forecast 2023-2028
            • Exhibit 87: Chart on Europe - Market size and forecast 2023-2028 ($ billion)
            • Exhibit 88: Data Table on Europe - Market size and forecast 2023-2028 ($ billion)
            • Exhibit 89: Chart on Europe - Year-over-year growth 2023-2028 (%)
            • Exhibit 90: Data Table on Europe - Year-over-year growth 2023-2028 (%)
          • 9.6 South America - Market size and forecast 2023-2028
            • Exhibit 91: Chart on South America - Market size and forecast 2023-2028 ($ billion)
            • Exhibit 92: Data Table on South America - Market size and forecast 2023-2028 ($ billion)
            • Exhibit 93: Chart on South America - Year-over-year growth 2023-2028 (%)
            • Exhibit 94: Data Table on South America - Year-over-year growth 2023-2028 (%)
          • 9.7 Middle East and Africa - Market size and forecast 2023-2028
            • Exhibit 95: Chart on Middle East and Africa - Market size and forecast 2023-2028 ($ billion)
            • Exhibit 96: Data Table on Middle East and Africa - Market size and forecast 2023-2028 ($ billion)
            • Exhibit 97: Chart on Middle East and Africa - Year-over-year growth 2023-2028 (%)
            • Exhibit 98: Data Table on Middle East and Africa - Year-over-year growth 2023-2028 (%)
          • 9.8 China - Market size and forecast 2023-2028
            • Exhibit 99: Chart on China - Market size and forecast 2023-2028 ($ billion)
            • Exhibit 100: Data Table on China - Market size and forecast 2023-2028 ($ billion)
            • Exhibit 101: Chart on China - Year-over-year growth 2023-2028 (%)
            • Exhibit 102: Data Table on China - Year-over-year growth 2023-2028 (%)
          • 9.9 US - Market size and forecast 2023-2028
            • Exhibit 103: Chart on US - Market size and forecast 2023-2028 ($ billion)
            • Exhibit 104: Data Table on US - Market size and forecast 2023-2028 ($ billion)
            • Exhibit 105: Chart on US - Year-over-year growth 2023-2028 (%)
            • Exhibit 106: Data Table on US - Year-over-year growth 2023-2028 (%)
          • 9.10 India - Market size and forecast 2023-2028
            • Exhibit 107: Chart on India - Market size and forecast 2023-2028 ($ billion)
            • Exhibit 108: Data Table on India - Market size and forecast 2023-2028 ($ billion)
            • Exhibit 109: Chart on India - Year-over-year growth 2023-2028 (%)
            • Exhibit 110: Data Table on India - Year-over-year growth 2023-2028 (%)
          • 9.11 Japan - Market size and forecast 2023-2028
            • Exhibit 111: Chart on Japan - Market size and forecast 2023-2028 ($ billion)
            • Exhibit 112: Data Table on Japan - Market size and forecast 2023-2028 ($ billion)
            • Exhibit 113: Chart on Japan - Year-over-year growth 2023-2028 (%)
            • Exhibit 114: Data Table on Japan - Year-over-year growth 2023-2028 (%)
          • 9.12 Germany - Market size and forecast 2023-2028
            • Exhibit 115: Chart on Germany - Market size and forecast 2023-2028 ($ billion)
            • Exhibit 116: Data Table on Germany - Market size and forecast 2023-2028 ($ billion)
            • Exhibit 117: Chart on Germany - Year-over-year growth 2023-2028 (%)
            • Exhibit 118: Data Table on Germany - Year-over-year growth 2023-2028 (%)
          • 9.13 Market opportunity by geography
            • Exhibit 119: Market opportunity by geography ($ billion)
            • Exhibit 120: Data Tables on Market opportunity by geography ($ billion)

          10 Drivers, Challenges, and Trends

          • 10.1 Market drivers
            • 10.2 Market challenges
              • 10.3 Impact of drivers and challenges
                • Exhibit 121: Impact of drivers and challenges in 2023 and 2028
              • 10.4 Market trends

                11 Vendor Landscape

                • 11.1 Overview
                  • 11.2 Vendor landscape
                    • Exhibit 122: Overview on Criticality of inputs and Factors of differentiation
                  • 11.3 Landscape disruption
                    • Exhibit 123: Overview on factors of disruption
                  • 11.4 Industry risks
                    • Exhibit 124: Impact of key risks on business

                  12 Vendor Analysis

                  • 12.1 Vendors covered
                    • Exhibit 125: Vendors covered
                  • 12.2 Market positioning of vendors
                    • Exhibit 126: Matrix on vendor position and classification
                  • 12.3 ABH Biochem Pvt. Ltd.
                    • Exhibit 127: ABH Biochem Pvt. Ltd. - Overview
                    • Exhibit 128: ABH Biochem Pvt. Ltd. - Product / Service
                    • Exhibit 129: ABH Biochem Pvt. Ltd. - Key offerings
                  • 12.4 BHATIA COLOUR CHEM LTD.
                    • Exhibit 130: BHATIA COLOUR CHEM LTD. - Overview
                    • Exhibit 131: BHATIA COLOUR CHEM LTD. - Product / Service
                    • Exhibit 132: BHATIA COLOUR CHEM LTD. - Key offerings
                  • 12.5 CHT Germany GmbH
                    • Exhibit 133: CHT Germany GmbH - Overview
                    • Exhibit 134: CHT Germany GmbH - Product / Service
                    • Exhibit 135: CHT Germany GmbH - Key offerings
                  • 12.6 Dow Chemical Co.
                    • Exhibit 136: Dow Chemical Co. - Overview
                    • Exhibit 137: Dow Chemical Co. - Business segments
                    • Exhibit 138: Dow Chemical Co. - Key news
                    • Exhibit 139: Dow Chemical Co. - Key offerings
                    • Exhibit 140: Dow Chemical Co. - Segment focus
                  • 12.7 Dye Cells India
                    • Exhibit 141: Dye Cells India - Overview
                    • Exhibit 142: Dye Cells India - Product / Service
                    • Exhibit 143: Dye Cells India - Key offerings
                  • 12.8 Embassy silicones
                    • Exhibit 144: Embassy silicones - Overview
                    • Exhibit 145: Embassy silicones - Product / Service
                    • Exhibit 146: Embassy silicones - Key offerings
                  • 12.9 Matangi Industries
                    • Exhibit 147: Matangi Industries - Overview
                    • Exhibit 148: Matangi Industries - Product / Service
                    • Exhibit 149: Matangi Industries - Key offerings
                  • 12.10 Mirachem Industries
                    • Exhibit 150: Mirachem Industries - Overview
                    • Exhibit 151: Mirachem Industries - Product / Service
                    • Exhibit 152: Mirachem Industries - Key offerings
                  • 12.11 OSAM SPECIALITY CHEMICALS PVT. LTD.
                    • Exhibit 153: OSAM SPECIALITY CHEMICALS PVT. LTD. - Overview
                    • Exhibit 154: OSAM SPECIALITY CHEMICALS PVT. LTD. - Product / Service
                    • Exhibit 155: OSAM SPECIALITY CHEMICALS PVT. LTD. - Key offerings
                  • 12.12 Pink Rose Pigments Pvt. Ltd.
                    • Exhibit 156: Pink Rose Pigments Pvt. Ltd. - Overview
                    • Exhibit 157: Pink Rose Pigments Pvt. Ltd. - Product / Service
                    • Exhibit 158: Pink Rose Pigments Pvt. Ltd. - Key offerings
                  • 12.13 Pon Pure Chemicals Group
                    • Exhibit 159: Pon Pure Chemicals Group - Overview
                    • Exhibit 160: Pon Pure Chemicals Group - Product / Service
                    • Exhibit 161: Pon Pure Chemicals Group - Key offerings
                  • 12.14 Prakash Chemicals Agencies Pvt. Ltd.
                    • Exhibit 162: Prakash Chemicals Agencies Pvt. Ltd. - Overview
                    • Exhibit 163: Prakash Chemicals Agencies Pvt. Ltd. - Product / Service
                    • Exhibit 164: Prakash Chemicals Agencies Pvt. Ltd. - Key offerings
                  • 12.15 Sarex
                    • Exhibit 165: Sarex - Overview
                    • Exhibit 166: Sarex - Product / Service
                    • Exhibit 167: Sarex - Key offerings
                  • 12.16 Suman Chemical Industries
                    • Exhibit 168: Suman Chemical Industries - Overview
                    • Exhibit 169: Suman Chemical Industries - Product / Service
                    • Exhibit 170: Suman Chemical Industries - Key offerings
                  • 12.17 Thurs Organics Pvt. Ltd.
                    • Exhibit 171: Thurs Organics Pvt. Ltd. - Overview
                    • Exhibit 172: Thurs Organics Pvt. Ltd. - Product / Service
                    • Exhibit 173: Thurs Organics Pvt. Ltd. - Key offerings

                  13 Appendix

                  • 13.1 Scope of the report
                    • 13.2 Inclusions and exclusions checklist
                      • Exhibit 174: Inclusions checklist
                      • Exhibit 175: Exclusions checklist
                    • 13.3 Currency conversion rates for US$
                      • Exhibit 176: Currency conversion rates for US$
                    • 13.4 Research methodology
                      • Exhibit 177: Research methodology
                      • Exhibit 178: Validation techniques employed for market sizing
                      • Exhibit 179: Information sources
                    • 13.5 List of abbreviations
                      • Exhibit 180: List of abbreviations

                    Research Methodology

                    Technavio presents a detailed picture of the market by way of study, synthesis, and summation of data from multiple sources. The analysts have presented the various facets of the market with a particular focus on identifying the key industry influencers. The data thus presented is comprehensive, reliable, and the result of extensive research, both primary and secondary.

                    INFORMATION SOURCES

                    Primary sources

                    • Manufacturers and suppliers
                    • Channel partners
                    • Industry experts
                    • Strategic decision makers

                    Secondary sources

                    • Industry journals and periodicals
                    • Government data
                    • Financial reports of key industry players
                    • Historical data
                    • Press releases

                    DATA ANALYSIS

                    Data Synthesis

                    • Collation of data
                    • Estimation of key figures
                    • Analysis of derived insights

                    Data Validation

                    • Triangulation with data models
                    • Reference against proprietary databases
                    • Corroboration with industry experts

                    REPORT WRITING

                    Qualitative

                    • Market drivers
                    • Market challenges
                    • Market trends
                    • Five forces analysis

                    Quantitative

                    • Market size and forecast
                    • Market segmentation
                    • Geographical insights
                    • Competitive landscape

                    Interested in this report?

                    Get your sample now to see our research methodology and insights!

                    Download Now

                    Frequently Asked Questions

                    Textile Pretreatment Chemicals market growth will increase by $ 1.76 bn during 2024-2028.

                    The Textile Pretreatment Chemicals market is expected to grow at a CAGR of 4.9% during 2024-2028.

                    Textile Pretreatment Chemicals market is segmented by Application( Apparel, Home textile, Technical textile) Product Type( Scouring agents, Desizing agents, Bleaching agents, Mercerizing agents, Others)

                    ABH Biochem Pvt. Ltd., APL, Belle Laboratories Pvt. Ltd. , BHATIA COLOUR CHEM LTD., CHT Germany GmbH, Dow Chemical Co., Dye Cells India, Embassy silicones, HT Fine Chemical Co. Ltd., Matangi Industries, Mirachem Industries, OSAM SPECIALITY CHEMICALS PVT. LTD., Pacific Texchem Pvt. Ltd., Pink Rose Pigments Pvt. Ltd., Pon Pure Chemicals Group, Prakash Chemicals Agencies Pvt. Ltd., Sarex, Sigmachemie Speciality Pvt. Ltd., Suman Chemical Industries, Thurs Organics Pvt. Ltd. are a few of the key vendors in the Textile Pretreatment Chemicals market.

                    APAC will register the highest growth rate of 63% among the other regions. Therefore, the Textile Pretreatment Chemicals market in APAC is expected to garner significant business opportunities for the vendors during the forecast period.

                    US, China, India, Japan, Germany

                    • Growing textile industry in developing economiesThe global textile industry is experiencing robust growth is the driving factor this market.
                    • driven by various factors is the driving factor this market.
                    • such as economic development is the driving factor this market.
                    • technological advancements is the driving factor this market.
                    • and shifting fashion trends. This growth is particularly pronounced in major countries that have traditionally been powerhouses in textile production and consumption. China is the driving factor this market.
                    • for instance is the driving factor this market.
                    • stands as the worlds leading textile producer is the driving factor this market.
                    • leveraging its extensive manufacturing infrastructure is the driving factor this market.
                    • skilled labor force is the driving factor this market.
                    • and technological innovation to dominate the global textile pretreatment chemicals market. The countrys vast textile sector benefits from government support and a strong export orientation is the driving factor this market.
                    • making it a critical player in the international textile arena. The China National Textile and Apparel Council (CNTAC) is the driving factor this market.
                    • which oversees the textile and apparel industry in China is the driving factor this market.
                    • in its 14th five-year plan is the driving factor this market.
                    • outlines the sectors development goals is the driving factor this market.
                    • strategies for expansion is the driving factor this market.
                    • and key priorities for the period from 2021 to 2025. India is another key player is the driving factor this market.
                    • known for its rich heritage in textile production is the driving factor this market.
                    • ranging from cotton to silk. The Indian textile industry is witnessing significant growth is the driving factor this market.
                    • fueled by both domestic consumption and exports. Government initiatives is the driving factor this market.
                    • such as the Technology Upgradation Fund Scheme (TUFS) and Integrated Textile Parks is the driving factor this market.
                    • aim to modernize the textile industry and enhance competitiveness. Similarly is the driving factor this market.
                    • Bangladesh is the driving factor this market.
                    • primarily known for its garment manufacturing is the driving factor this market.
                    • has seen its textile sector expand rapidly due to the growing exports of textiles to Western countries. During the fiscal year 2020-21 is the driving factor this market.
                    • Bangladesh witnessed a 12.55 percent increase in its Ready-Made Garment (RMG) exports is the driving factor this market.
                    • reaching $31.46 billion is the driving factor this market.
                    • which constituted a significant portion of its total exports is the driving factor this market.
                    • amounting to $38.76 billion. This growth occurred as the primary markets in Europe and North America started to rebound from the demand downturn caused by the COVID-19 pandemic. Thus is the driving factor this market.
                    • the expanding textile industry in developing economies is expected to drive the growth of the global textile pretreatment chemicals market during the forecast period. is the driving factor this market.

                    The Textile Pretreatment Chemicals market vendors should focus on grabbing business opportunities from the Apparel segment as it accounted for the largest market share in the base year.