Textile Testing Equipment Market Analysis, Size, and Forecast 2025-2029: North America (US), Europe (France, Germany, Italy, and UK), APAC (Australia, China, India, Japan, and South Korea), and Rest of World (ROW)

Textile Testing Equipment Market Analysis, Size, and Forecast 2025-2029:
North America (US), Europe (France, Germany, Italy, and UK), APAC (Australia, China, India, Japan, and South Korea), and Rest of World (ROW)

Published: Jun 2025 220 Pages SKU: IRTNTR45556

Market Overview at a Glance

$390.6 Mn
Market Opportunity
4.6%
CAGR
4.4
YoY growth 2024-2025(%)

Textile Testing Equipment Market Size 2025-2029

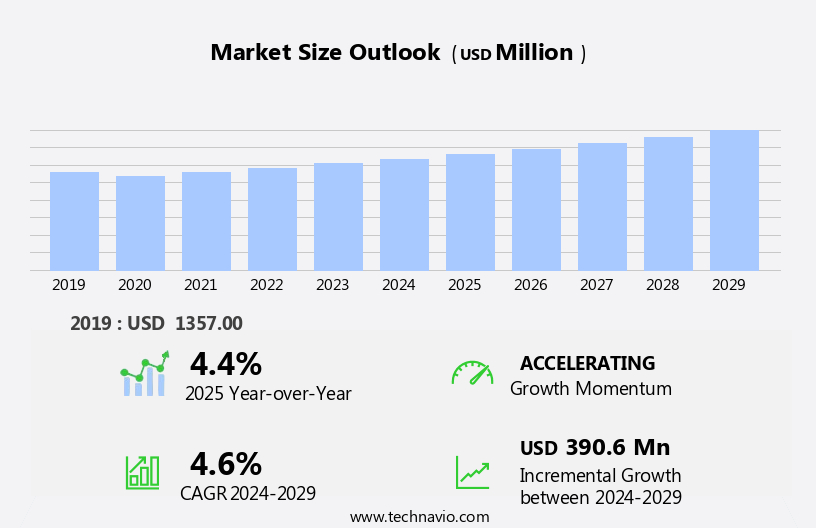
The textile testing equipment market size is forecast to increase by USD 390.6 million, at a CAGR of 4.6% between 2024 and 2029.

  • The market is witnessing significant growth, driven by the increasing demand for technical textiles and the shift towards the use of sustainable fibers. The adoption of technical textiles is on the rise due to their superior properties, including durability, strength, and resistance to various environmental conditions. Additionally, with increasing urbanization and rising middle-class income, consumer demand for apparel and fashion is also on rise. Operational issues faced by Original Equipment Manufacturers (OEMs) pose a significant hurdle. These challenges include complex testing procedures, high capital investment for advanced testing equipment, and the need for specialized expertise.
  • OEMs must navigate these challenges to ensure the production of high-quality textile products that meet regulatory requirements and customer expectations. To remain competitive, companies must invest in innovative testing solutions that streamline processes, reduce costs, and improve efficiency. Sustainable fibers, such as organic cotton, linen, and hemp, offer environmental benefits and appeal to consumers who prioritize eco-friendly products. Companies can capitalize on the growing demand for technical textiles and sustainable fibers, positioning themselves for long-term success in the market.

What will be the Size of the Textile Testing Equipment Market during the forecast period?

Textile Testing Equipment Market Size

Explore in-depth regional segment analysis with market size data - historical 2019-2023 and forecasts 2025-2029 - in the full report.  
 Request Free Sample

  • The market encompasses a range of technologies and tools designed to ensure product quality, optimize processes, and comply with regulatory standards in the textile industry. Key areas of focus include textile chemistry, material science, and fiber technology, which are integral to textile design and engineering. Report generation software and quality control systems facilitate efficient data management and analysis. Abrasion and bursting strength testers assess fabric durability, while tensile testers measure fiber strength and elasticity. Fiber identification systems enable accurate material analysis, and image analysis software aids in textile research and development. Bio-based fibers and smart textiles are driving innovation in the sector, necessitating advanced testing solutions.
  • Material testing labs employ flammability chambers and data logging systems to ensure safety and compliance. Waste reduction and circular economy principles are influencing market trends, with digital transformation playing a crucial role in streamlining processes and enhancing efficiency. Textile certification and the development of wearable technology further expand the market's scope, as industry players strive to meet evolving consumer demands and regulatory requirements. Textile physics and research continue to advance, fueling ongoing innovation and growth in the sector.

How is this Textile Testing Equipment Industry segmented?

The textile testing equipment industry research report provides comprehensive data (region-wise segment analysis), with forecasts and estimates in "USD million" for the period 2025-2029, as well as historical data from 2019-2023 for the following segments.

  • End-user
    • Textile companies
    • Professional testing agencies
  • Application
    • Apparel industry
    • Footwear industry
    • Others
  • Technology
    • Manual
    • Semi-automated equipment
    • Fully automated and smart
  • Geography
    • North America
      • US
    • Europe
      • France
      • Germany
      • Italy
      • UK
    • APAC
      • Australia
      • China
      • India
      • Japan
      • South Korea
    • Rest of World (ROW)

By End-user Insights

The textile companies segment is estimated to witness significant growth during the forecast period. Textile testing equipment plays a crucial role in ensuring the quality and performance of various textile products. In the dynamic textile industry, textile companies are driving the growth of the market. The increasing demand for textiles in numerous sectors, such as automotive, medical, home furnishings, and apparel, necessitates rigorous testing to meet the required standards. Textile testing laboratories employ advanced technologies, including digital imaging, software analysis, and automated testing, to evaluate fabric properties like pilling resistance, bursting strength, moisture management, and color fastness. Eco-friendly materials and recycled textiles are gaining popularity, necessitating testing for recovery rate, fabric weight, and other properties. Moreover, the integration of Artificial Intelligence (AI) and Internet of Things (IoT) technologies is enabling the development of better testing equipments.

ISO and ASTM standards guide the textile manufacturing process, ensuring consistency and quality. Textile testing equipment facilitates the measurement of properties like hand feel, surface smoothness, water repellency, and wrinkle resistance. Additionally, testing for performance attributes, such as dimensional stability, tear resistance, and seam strength, is essential for industrial fabrics and technical textiles. Textile manufacturers continually innovate to offer products with improved efficiency and enhanced properties. For instance, Checkline's equipment enables measuring and evaluating textile properties like thickness, weight, tear strength, color, and flammability. The integration of data acquisition systems and fiber analysis further enhances the testing process.

Textile Testing Equipment Market Size

Request Free Sample

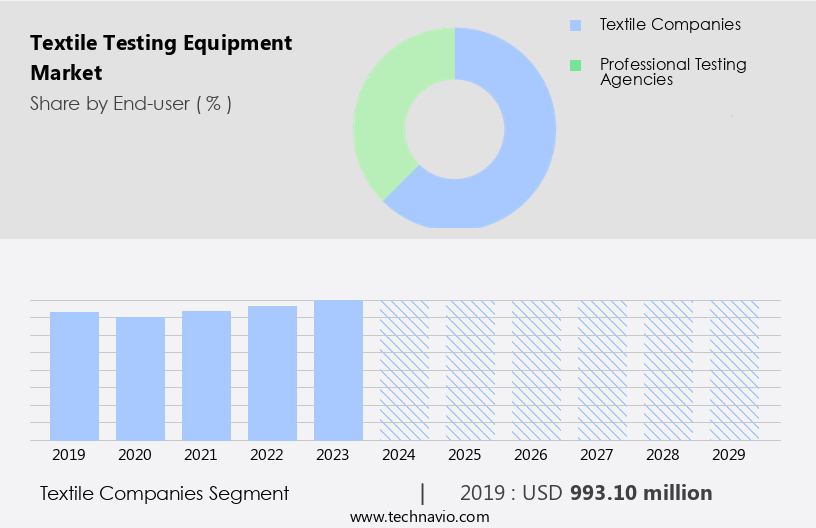
The Textile companies segment was valued at USD 993.10 million in 2019 and showed a gradual increase during the forecast period.

Regional Analysis

APAC is estimated to contribute 55% to the growth of the global market during the forecast period. Technavio's analysts have elaborately explained the regional trends and drivers that shape the market during the forecast period.

Textile Testing Equipment Market Share by Geography

Download Free Sample Report

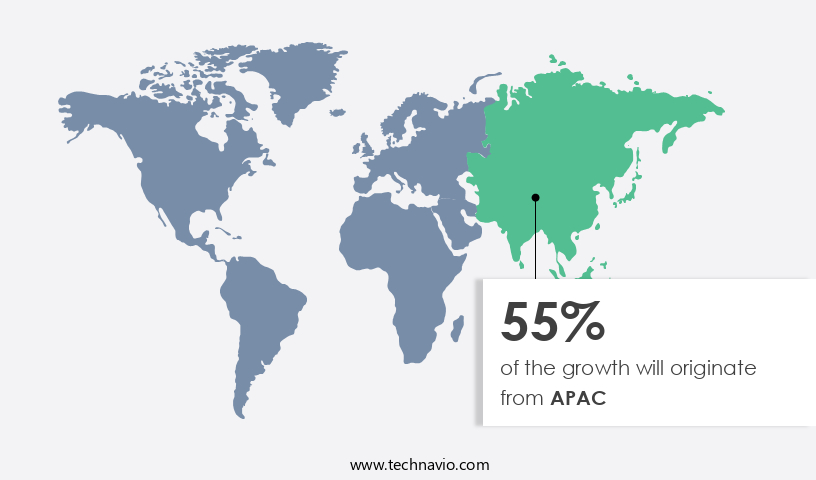
The textile industry in the Asia-Pacific (APAC) region is a significant global player, with China, India, Bangladesh, and Vietnam leading in manufacturing. Bangladesh and Vietnam import raw textile materials from India, producing finished goods for export. China, India, Vietnam, Pakistan, and Indonesia are major investors in textile testing equipment, prioritizing quality standards and international regulation compliance. China is a hub for global textile machinery and testing equipment investments. Companies like Testex contribute to this market, providing extensive testing solutions for physical properties, colorfastness, flammability, and performance evaluation. Eco-friendly materials are gaining traction, driving the demand for testing equipment that assesses sustainability.

Technical textiles, including medical, automotive, and industrial fabrics, require rigorous testing for properties like bursting strength, tear resistance, and moisture management. Digital imaging and software analysis facilitate efficient supply chain management and quality control. Textile testing laboratories use ISO and ASTM standards for material characterization, ensuring consistency and reliability. The apparel industry relies on testing for dimensional stability, hand feel, and finishing techniques like printing processes and wrinkle resistance. Performance evaluation of textiles, including UV resistance, water repellency, and recovery rate, is crucial for various industries. Additionally, testing for chemical resistance, abrasion resistance, color fastness, and antimicrobial properties are essential for textile manufacturing.

Market Dynamics

Our researchers analyzed the data with 2024 as the base year, along with the key drivers, trends, and challenges. A holistic analysis of drivers will help companies refine their marketing strategies to gain a competitive advantage.

What are the Textile Testing Equipment market drivers leading to the rise in the adoption of Industry?

  • The increase in demand for technical textiles serves as the primary driver propelling market growth. The market experiences growth due to the increasing demand for quality assurance in technical textiles. These textiles are subjected to rigorous testing to ensure they meet specific performance standards. The testing process encompasses various procedures, including pilling resistance, bursting strength, and eco-friendly material evaluation. Technical textiles serve diverse industries, such as medical textiles, automotive textiles, home furnishings, and textile standards. To maintain high-quality products, each component is scrutinized at every stage of manufacturing. This includes testing for textile standards, digital imaging, software analysis, and supply chain management. Compliance with industry standards, such as ASTM, is essential to ensure textiles meet regulatory requirements.
  • Technical textiles are integral to various industries due to their unique properties, necessitating stringent testing. For instance, medical textiles require high-performance standards to ensure patient safety, while automotive textiles must endure extreme conditions. Home furnishings demand durability and aesthetics, and textile testing laboratories play a crucial role in ensuring these requirements are met. 

What are the Textile Testing Equipment market trends shaping the Industry?

  • The use of sustainable fibers is gaining increasing popularity in the textile industry, representing a significant market trend. The market has witnessed significant growth due to the increasing focus on sustainability and quality control in the textile industry. Manufacturers are turning towards eco-friendly materials, such as bio-based and recycled textiles, to reduce the environmental impact of textile production. For instance, yarns made from bio-based materials offer better UV resistance and recovery rate, making them suitable for aerospace textiles and technical textiles. The demand for automated testing equipment is also on the rise to ensure consistent fabric weight, hand feel, and moisture management. ISO standards are crucial in maintaining quality and ensuring compliance with regulations. Companies are investing in advanced testing technologies to meet these requirements and stay competitive.
  • Additionally, the use of sustainable fibers, such as recycled textiles, is becoming increasingly popular. Levi Strauss, for example, has incorporated recycled plastic bottles into its denim fabric and continues to advance its Better Cotton Initiative to minimize water usage and pesticide reliance. These initiatives demonstrate the importance of textile testing equipment in ensuring fiber strength, durability, and overall quality in the textile industry.

How does Textile Testing Equipment market face challenges during its growth?

  • Operational challenges, such as supply chain disruptions and quality control issues, pose significant hurdles to Original Equipment Manufacturers (OEMs), thereby impeding industry growth.  Textile testing equipment is essential for ensuring the quality and performance of textiles in various industries. Key properties tested include water repellency, surface smoothness, stain resistance, wrinkle resistance, compression set, and fiber analysis. Data acquisition systems are utilized to collect and analyze test data, while finishing techniques and printing processes are also evaluated. Report generation is a crucial aspect of textile testing, providing valuable insights for manufacturers and consumers. Textile manufacturers face operational challenges such as inconsistent power supply, which can increase machine stress and lead to higher maintenance and production costs. This issue is prevalent in several countries, particularly in Southeast Asia, where India, Pakistan, and Bangladesh experience significant power deficits.
  • In the Philippines, an Economic Intelligence Unit report predicts that electricity demand will exceed supply within the next five years due to strict regulations and bureaucratic uncertainties. Moreover, textiles must exhibit various performance characteristics, such as chemical resistance, abrasion resistance, and fiber analysis. AATCC standards provide guidelines for testing these properties, ensuring consistent quality and compliance with industry regulations. The market continues to evolve, with a focus on enhancing garment performance through advanced finishing processes and care labels for homemade garments.

Exclusive Customer Landscape

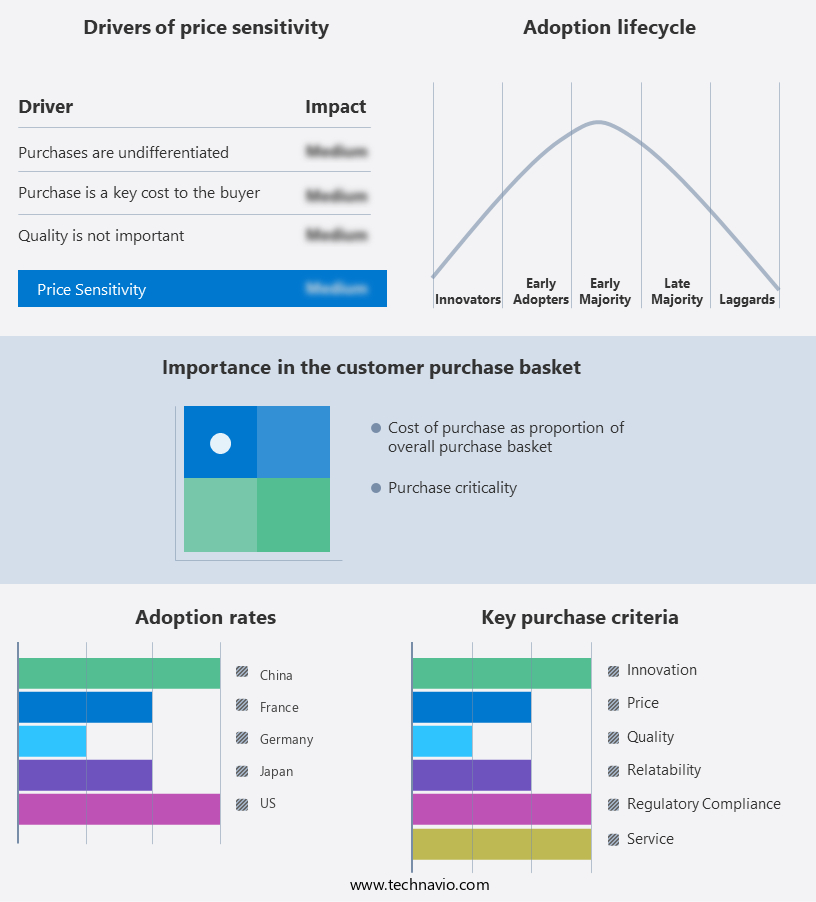
The textile testing equipment market forecasting report includes the adoption lifecycle of the market, covering from the innovator's stage to the laggard's stage. It focuses on adoption rates in different regions based on penetration. Furthermore, the textile testing equipment market report also includes key purchase criteria and drivers of price sensitivity to help companies evaluate and develop their market growth analysis strategies.

Textile Testing Equipment Market Share by Geography

 Customer Landscape

Key Companies & Market Insights

Companies are implementing various strategies, such as strategic alliances, textile testing equipment market forecast, partnerships, mergers and acquisitions, geographical expansion, and product/service launches, to enhance their presence in the industry.

AMETEK Inc. - This company specializes in providing advanced textile testing solutions. 

The industry research and growth report includes detailed analyses of the competitive landscape of the market and information about key companies, including:

  • AMETEK Inc.
  • Bureau Veritas SA
  • Eurofins Scientific SE
  • Hohenstein
  • Intertek Group Plc
  • Paramount Instruments Pvt. Ltd.
  • QIMA Ltd.
  • Rieter Holding AG
  • Roaches Ltd.
  • SDL Atlas
  • SGS SA
  • SMARTEX.AI
  • TESTEX Instruments Ltd.
  • TUV SUD
  • TUV SUD AG

Qualitative and quantitative analysis of companies has been conducted to help clients understand the wider business environment as well as the strengths and weaknesses of key industry players. Data is qualitatively analyzed to categorize companies as pure play, category-focused, industry-focused, and diversified; it is quantitatively analyzed to categorize companies as dominant, leading, strong, tentative, and weak.

Recent Development and News in Textile Testing Equipment Market

  • In February 2023, SGS, a leading inspection, verification, testing, and certification company, announced the launch of its new textile testing laboratory in Ho Chi Minh City, Vietnam. This expansion strengthens SGS's presence in the Asia Pacific region and supports the growing demand for textile testing services in the area (SGS press release, 2023).
  • In March 2024, PerkinElmer, a global technology company, entered into a strategic partnership with the Indian Textile Industry Institute and Research Association (ITIIRA). This collaboration aims to develop advanced testing solutions for the Indian textile industry, focusing on sustainability and quality (PerkinElmer press release, 2024).
  • In May 2024, Gerber Technology, a leading provider of integrated software and automation solutions for the apparel and industrial markets, raised USD 150 million in a funding round. The investment will support the company's continued growth and innovation in textile testing technology (Business Wire, 2024).

Research Analyst Overview

The market is characterized by its continuous evolution and dynamic nature, with ongoing advancements shaping its applications across various sectors. Yarn count and fabric weight are essential factors in assessing textile quality, while UV resistance and ISO standards ensure compliance with industry regulations. Quality control is a top priority, with automated testing solutions and digital imaging software analysis streamlining the process. Eco-friendly materials, such as bio-based and recycled textiles, are gaining popularity, driving innovation in textile testing laboratories. Technical textiles, including those used in aerospace, automotive, and medical industries, require rigorous testing for performance evaluation. Moisture management, water repellency, and surface smoothness are crucial factors in these applications.

AATCC and ASTM standards guide testing for various textile properties, including bursting strength, pilling resistance, and color fastness. Textile manufacturing processes, from dyeing and printing to finishing techniques, require comprehensive testing to ensure optimal performance and compliance with industry regulations. Performance evaluation of industrial fabrics and apparel materials is essential for assessing their suitability for specific applications. Textile testing equipment plays a vital role in ensuring product quality and safety, with data acquisition systems and fiber analysis providing valuable insights into material properties. Stain resistance, wrinkle resistance, compression set, and chemical and abrasion resistance are critical factors in evaluating textile performance.

The Textile Testing Equipment Market is advancing with cutting-edge technology to ensure fabric durability and safety. Instruments like the tensile tester and bursting strength tester assess material strength, while the abrasion tester evaluates wear resistance. Fire safety is crucial, making the flammability chamber a key testing tool. A fiber identification system aids in precise material classification, enhancing quality assurance. The integration of data logging system and quality control software streamlines analysis, improving efficiency. Innovations in textile engineering drive advancements in material testing labs, promoting textile process optimization. With growing demand for sustainable materials, textile innovation is shaping the future, ensuring enhanced performance and reliability in the industry. 

Dive into Technavio's strong research methodology, blending expert interviews, extensive data synthesis, and validated models for unparalleled Textile Testing Equipment Market insights. See full methodology.

Market Scope

Report Coverage

Details

Page number

220

Base year

2024

Historic period

2019-2023

Forecast period

2025-2029

Growth momentum & CAGR

Accelerate at a CAGR of 4.6%

Market growth 2025-2029

USD 390.6 million

Market structure

Fragmented

YoY growth 2024-2025(%)

4.4

Key countries

China, US, Japan, India, Germany, South Korea, France, Australia, UK, and Italy

Competitive landscape

Leading Companies, Market Positioning of Companies, Competitive Strategies, and Industry Risks

Request Free Sample

What are the Key Data Covered in this Textile Testing Equipment Market Research and Growth Report?

  • CAGR of the Textile Testing Equipment industry during the forecast period
  • Detailed information on factors that will drive the growth and forecasting between 2025 and 2029
  • Precise estimation of the size of the market and its contribution of the industry in focus to the parent market
  • Accurate predictions about upcoming growth and trends and changes in consumer behaviour
  • Growth of the market across APAC, Europe, North America, Middle East and Africa, and South America
  • Thorough analysis of the market's competitive landscape and detailed information about companies
  • Comprehensive analysis of factors that will challenge the textile testing equipment market growth of industry companies

We can help! Our analysts can customize this textile testing equipment market research report to meet your requirements.

Get in touch

1 Executive Summary

  • 1.1 Market overview
    • Executive Summary - Chart on Market Overview
    • Executive Summary - Data Table on Market Overview
    • Executive Summary - Chart on Global Market Characteristics
    • Executive Summary - Chart on Market by Geography
    • Executive Summary - Chart on Market Segmentation by End-user
    • Executive Summary - Chart on Market Segmentation by Application
    • Executive Summary - Chart on Market Segmentation by Technology
    • Executive Summary - Chart on Incremental Growth
    • Executive Summary - Data Table on Incremental Growth
    • Executive Summary - Chart on Company Market Positioning

2 Technavio Analysis

  • 2.1 Analysis of price sensitivity, lifecycle, customer purchase basket, adoption rates, and purchase criteria
    • Analysis of price sensitivity, lifecycle, customer purchase basket, adoption rates, and purchase criteria
  • 2.2 Criticality of inputs and Factors of differentiation
    • Overview on criticality of inputs and factors of differentiation
  • 2.3 Factors of disruption
    • Overview on factors of disruption
  • 2.4 Impact of drivers and challenges
    • Impact of drivers and challenges in 2024 and 2029

3 Market Landscape

  • 3.1 Market ecosystem
    • Parent Market
    • Data Table on - Parent Market
  • 3.2 Market characteristics
    • Market characteristics analysis
  • 3.3 Value chain analysis
    • Value chain analysis

4 Market Sizing

  • 4.1 Market definition
    • Offerings of companies included in the market definition
  • 4.2 Market segment analysis
    • Market segments
  • 4.3 Market size 2024
    • 4.4 Market outlook: Forecast for 2024-2029
      • Chart on Global - Market size and forecast 2024-2029 ($ million)
      • Data Table on Global - Market size and forecast 2024-2029 ($ million)
      • Chart on Global Market: Year-over-year growth 2024-2029 (%)
      • Data Table on Global Market: Year-over-year growth 2024-2029 (%)

    5 Historic Market Size

    • 5.1 Global Textile Testing Equipment Market 2019 - 2023
      • Historic Market Size - Data Table on Global Textile Testing Equipment Market 2019 - 2023 ($ million)
    • 5.2 End-user segment analysis 2019 - 2023
      • Historic Market Size - End-user Segment 2019 - 2023 ($ million)
    • 5.3 Application segment analysis 2019 - 2023
      • Historic Market Size - Application Segment 2019 - 2023 ($ million)
    • 5.4 Technology segment analysis 2019 - 2023
      • Historic Market Size - Technology Segment 2019 - 2023 ($ million)
    • 5.5 Geography segment analysis 2019 - 2023
      • Historic Market Size - Geography Segment 2019 - 2023 ($ million)
    • 5.6 Country segment analysis 2019 - 2023
      • Historic Market Size - Country Segment 2019 - 2023 ($ million)

    6 Qualitative Analysis

    • 6.1 The AI impact on global textile testing equipment market

      7 Five Forces Analysis

      • 7.1 Five forces summary
        • Five forces analysis - Comparison between 2024 and 2029
      • 7.2 Bargaining power of buyers
        • Bargaining power of buyers - Impact of key factors 2024 and 2029
      • 7.3 Bargaining power of suppliers
        • Bargaining power of suppliers - Impact of key factors in 2024 and 2029
      • 7.4 Threat of new entrants
        • Threat of new entrants - Impact of key factors in 2024 and 2029
      • 7.5 Threat of substitutes
        • Threat of substitutes - Impact of key factors in 2024 and 2029
      • 7.6 Threat of rivalry
        • Threat of rivalry - Impact of key factors in 2024 and 2029
      • 7.7 Market condition
        • Chart on Market condition - Five forces 2024 and 2029

      8 Market Segmentation by End-user

      • 8.1 Market segments
        • Chart on End-user - Market share 2024-2029 (%)
        • Data Table on End-user - Market share 2024-2029 (%)
      • 8.2 Comparison by End-user
        • Chart on Comparison by End-user
        • Data Table on Comparison by End-user
      • 8.3 Textile companies - Market size and forecast 2024-2029
        • Chart on Textile companies - Market size and forecast 2024-2029 ($ million)
        • Data Table on Textile companies - Market size and forecast 2024-2029 ($ million)
        • Chart on Textile companies - Year-over-year growth 2024-2029 (%)
        • Data Table on Textile companies - Year-over-year growth 2024-2029 (%)
      • 8.4 Professional testing agencies - Market size and forecast 2024-2029
        • Chart on Professional testing agencies - Market size and forecast 2024-2029 ($ million)
        • Data Table on Professional testing agencies - Market size and forecast 2024-2029 ($ million)
        • Chart on Professional testing agencies - Year-over-year growth 2024-2029 (%)
        • Data Table on Professional testing agencies - Year-over-year growth 2024-2029 (%)
      • 8.5 Market opportunity by End-user
        • Market opportunity by End-user ($ million)
        • Data Table on Market opportunity by End-user ($ million)

      9 Market Segmentation by Application

      • 9.1 Market segments
        • Chart on Application - Market share 2024-2029 (%)
        • Data Table on Application - Market share 2024-2029 (%)
      • 9.2 Comparison by Application
        • Chart on Comparison by Application
        • Data Table on Comparison by Application
      • 9.3 Apparel industry - Market size and forecast 2024-2029
        • Chart on Apparel industry - Market size and forecast 2024-2029 ($ million)
        • Data Table on Apparel industry - Market size and forecast 2024-2029 ($ million)
        • Chart on Apparel industry - Year-over-year growth 2024-2029 (%)
        • Data Table on Apparel industry - Year-over-year growth 2024-2029 (%)
      • 9.4 Footwear industry - Market size and forecast 2024-2029
        • Chart on Footwear industry - Market size and forecast 2024-2029 ($ million)
        • Data Table on Footwear industry - Market size and forecast 2024-2029 ($ million)
        • Chart on Footwear industry - Year-over-year growth 2024-2029 (%)
        • Data Table on Footwear industry - Year-over-year growth 2024-2029 (%)
      • 9.5 Others - Market size and forecast 2024-2029
        • Chart on Others - Market size and forecast 2024-2029 ($ million)
        • Data Table on Others - Market size and forecast 2024-2029 ($ million)
        • Chart on Others - Year-over-year growth 2024-2029 (%)
        • Data Table on Others - Year-over-year growth 2024-2029 (%)
      • 9.6 Market opportunity by Application
        • Market opportunity by Application ($ million)
        • Data Table on Market opportunity by Application ($ million)

      10 Market Segmentation by Technology

      • 10.1 Market segments
        • Chart on Technology - Market share 2024-2029 (%)
        • Data Table on Technology - Market share 2024-2029 (%)
      • 10.2 Comparison by Technology
        • Chart on Comparison by Technology
        • Data Table on Comparison by Technology
      • 10.3 Manual - Market size and forecast 2024-2029
        • Chart on Manual - Market size and forecast 2024-2029 ($ million)
        • Data Table on Manual - Market size and forecast 2024-2029 ($ million)
        • Chart on Manual - Year-over-year growth 2024-2029 (%)
        • Data Table on Manual - Year-over-year growth 2024-2029 (%)
      • 10.4 Semi-automated equipment - Market size and forecast 2024-2029
        • Chart on Semi-automated equipment - Market size and forecast 2024-2029 ($ million)
        • Data Table on Semi-automated equipment - Market size and forecast 2024-2029 ($ million)
        • Chart on Semi-automated equipment - Year-over-year growth 2024-2029 (%)
        • Data Table on Semi-automated equipment - Year-over-year growth 2024-2029 (%)
      • 10.5 Fully automated and smart - Market size and forecast 2024-2029
        • Chart on Fully automated and smart - Market size and forecast 2024-2029 ($ million)
        • Data Table on Fully automated and smart - Market size and forecast 2024-2029 ($ million)
        • Chart on Fully automated and smart - Year-over-year growth 2024-2029 (%)
        • Data Table on Fully automated and smart - Year-over-year growth 2024-2029 (%)
      • 10.6 Market opportunity by Technology
        • Market opportunity by Technology ($ million)
        • Data Table on Market opportunity by Technology ($ million)

      11 Customer Landscape

      • 11.1 Customer landscape overview
        • Analysis of price sensitivity, lifecycle, customer purchase basket, adoption rates, and purchase criteria

      12 Geographic Landscape

      • 12.1 Geographic segmentation
        • Chart on Market share by geography 2024-2029 (%)
        • Data Table on Market share by geography 2024-2029 (%)
      • 12.2 Geographic comparison
        • Chart on Geographic comparison
        • Data Table on Geographic comparison
      • 12.3 APAC - Market size and forecast 2024-2029
        • Chart on APAC - Market size and forecast 2024-2029 ($ million)
        • Data Table on APAC - Market size and forecast 2024-2029 ($ million)
        • Chart on APAC - Year-over-year growth 2024-2029 (%)
        • Data Table on APAC - Year-over-year growth 2024-2029 (%)
      • 12.4 Europe - Market size and forecast 2024-2029
        • Chart on Europe - Market size and forecast 2024-2029 ($ million)
        • Data Table on Europe - Market size and forecast 2024-2029 ($ million)
        • Chart on Europe - Year-over-year growth 2024-2029 (%)
        • Data Table on Europe - Year-over-year growth 2024-2029 (%)
      • 12.5 North America - Market size and forecast 2024-2029
        • Chart on North America - Market size and forecast 2024-2029 ($ million)
        • Data Table on North America - Market size and forecast 2024-2029 ($ million)
        • Chart on North America - Year-over-year growth 2024-2029 (%)
        • Data Table on North America - Year-over-year growth 2024-2029 (%)
      • 12.6 Middle East and Africa - Market size and forecast 2024-2029
        • Chart on Middle East and Africa - Market size and forecast 2024-2029 ($ million)
        • Data Table on Middle East and Africa - Market size and forecast 2024-2029 ($ million)
        • Chart on Middle East and Africa - Year-over-year growth 2024-2029 (%)
        • Data Table on Middle East and Africa - Year-over-year growth 2024-2029 (%)
      • 12.7 South America - Market size and forecast 2024-2029
        • Chart on South America - Market size and forecast 2024-2029 ($ million)
        • Data Table on South America - Market size and forecast 2024-2029 ($ million)
        • Chart on South America - Year-over-year growth 2024-2029 (%)
        • Data Table on South America - Year-over-year growth 2024-2029 (%)
      • 12.8 China - Market size and forecast 2024-2029
        • Chart on China - Market size and forecast 2024-2029 ($ million)
        • Data Table on China - Market size and forecast 2024-2029 ($ million)
        • Chart on China - Year-over-year growth 2024-2029 (%)
        • Data Table on China - Year-over-year growth 2024-2029 (%)
      • 12.9 US - Market size and forecast 2024-2029
        • Chart on US - Market size and forecast 2024-2029 ($ million)
        • Data Table on US - Market size and forecast 2024-2029 ($ million)
        • Chart on US - Year-over-year growth 2024-2029 (%)
        • Data Table on US - Year-over-year growth 2024-2029 (%)
      • 12.10 Japan - Market size and forecast 2024-2029
        • Chart on Japan - Market size and forecast 2024-2029 ($ million)
        • Data Table on Japan - Market size and forecast 2024-2029 ($ million)
        • Chart on Japan - Year-over-year growth 2024-2029 (%)
        • Data Table on Japan - Year-over-year growth 2024-2029 (%)
      • 12.11 India - Market size and forecast 2024-2029
        • Chart on India - Market size and forecast 2024-2029 ($ million)
        • Data Table on India - Market size and forecast 2024-2029 ($ million)
        • Chart on India - Year-over-year growth 2024-2029 (%)
        • Data Table on India - Year-over-year growth 2024-2029 (%)
      • 12.12 Germany - Market size and forecast 2024-2029
        • Chart on Germany - Market size and forecast 2024-2029 ($ million)
        • Data Table on Germany - Market size and forecast 2024-2029 ($ million)
        • Chart on Germany - Year-over-year growth 2024-2029 (%)
        • Data Table on Germany - Year-over-year growth 2024-2029 (%)
      • 12.13 South Korea - Market size and forecast 2024-2029
        • Chart on South Korea - Market size and forecast 2024-2029 ($ million)
        • Data Table on South Korea - Market size and forecast 2024-2029 ($ million)
        • Chart on South Korea - Year-over-year growth 2024-2029 (%)
        • Data Table on South Korea - Year-over-year growth 2024-2029 (%)
      • 12.14 France - Market size and forecast 2024-2029
        • Chart on France - Market size and forecast 2024-2029 ($ million)
        • Data Table on France - Market size and forecast 2024-2029 ($ million)
        • Chart on France - Year-over-year growth 2024-2029 (%)
        • Data Table on France - Year-over-year growth 2024-2029 (%)
      • 12.15 Australia - Market size and forecast 2024-2029
        • Chart on Australia - Market size and forecast 2024-2029 ($ million)
        • Data Table on Australia - Market size and forecast 2024-2029 ($ million)
        • Chart on Australia - Year-over-year growth 2024-2029 (%)
        • Data Table on Australia - Year-over-year growth 2024-2029 (%)
      • 12.16 UK - Market size and forecast 2024-2029
        • Chart on UK - Market size and forecast 2024-2029 ($ million)
        • Data Table on UK - Market size and forecast 2024-2029 ($ million)
        • Chart on UK - Year-over-year growth 2024-2029 (%)
        • Data Table on UK - Year-over-year growth 2024-2029 (%)
      • 12.17 Italy - Market size and forecast 2024-2029
        • Chart on Italy - Market size and forecast 2024-2029 ($ million)
        • Data Table on Italy - Market size and forecast 2024-2029 ($ million)
        • Chart on Italy - Year-over-year growth 2024-2029 (%)
        • Data Table on Italy - Year-over-year growth 2024-2029 (%)
      • 12.18 Market opportunity by geography
        • Market opportunity by geography ($ million)
        • Data Tables on Market opportunity by geography ($ million)

      13 Drivers, Challenges, and Opportunity/Restraints

      • 13.1 Market drivers
        • 13.2 Market challenges
          • 13.3 Impact of drivers and challenges
            • Impact of drivers and challenges in 2024 and 2029
          • 13.4 Market opportunities/restraints

            14 Competitive Landscape

            • 14.1 Overview
              • 14.2 Competitive Landscape
                • Overview on criticality of inputs and factors of differentiation
              • 14.3 Landscape disruption
                • Overview on factors of disruption
              • 14.4 Industry risks
                • Impact of key risks on business

              15 Competitive Analysis

              • 15.1 Companies profiled
                • Companies covered
              • 15.2 Company ranking index
                • Company ranking index
              • 15.3 Market positioning of companies
                • Matrix on companies position and classification
              • 15.4 AMETEK Inc.
                • AMETEK Inc. - Overview
                • AMETEK Inc. - Business segments
                • AMETEK Inc. - Key news
                • AMETEK Inc. - Key offerings
                • AMETEK Inc. - Segment focus
                • SWOT
              • 15.5 Bureau Veritas SA
                • Bureau Veritas SA - Overview
                • Bureau Veritas SA - Business segments
                • Bureau Veritas SA - Key offerings
                • Bureau Veritas SA - Segment focus
                • SWOT
              • 15.6 Eurofins Scientific SE
                • Eurofins Scientific SE - Overview
                • Eurofins Scientific SE - Business segments
                • Eurofins Scientific SE - Key offerings
                • Eurofins Scientific SE - Segment focus
                • SWOT
              • 15.7 Hohenstein
                • Hohenstein - Overview
                • Hohenstein - Product / Service
                • Hohenstein - Key offerings
                • SWOT
              • 15.8 Intertek Group Plc
                • Intertek Group Plc - Overview
                • Intertek Group Plc - Business segments
                • Intertek Group Plc - Key offerings
                • Intertek Group Plc - Segment focus
                • SWOT
              • 15.9 Paramount Instruments Pvt. Ltd.
                • Paramount Instruments Pvt. Ltd. - Overview
                • Paramount Instruments Pvt. Ltd. - Product / Service
                • Paramount Instruments Pvt. Ltd. - Key offerings
                • SWOT
              • 15.10 QIMA Ltd.
                • QIMA Ltd. - Overview
                • QIMA Ltd. - Product / Service
                • QIMA Ltd. - Key offerings
                • SWOT
              • 15.11 Rieter Holding AG
                • Rieter Holding AG - Overview
                • Rieter Holding AG - Business segments
                • Rieter Holding AG - Key offerings
                • Rieter Holding AG - Segment focus
                • SWOT
              • 15.12 Roaches Ltd.
                • Roaches Ltd. - Overview
                • Roaches Ltd. - Product / Service
                • Roaches Ltd. - Key offerings
                • SWOT
              • 15.13 SDL Atlas
                • SDL Atlas - Overview
                • SDL Atlas - Product / Service
                • SDL Atlas - Key offerings
                • SWOT
              • 15.14 SGS SA
                • SGS SA - Overview
                • SGS SA - Business segments
                • SGS SA - Key offerings
                • SGS SA - Segment focus
                • SWOT
              • 15.15 SMARTEX.AI
                • SMARTEX.AI - Overview
                • SMARTEX.AI - Product / Service
                • SMARTEX.AI - Key offerings
                • SWOT
              • 15.16 TESTEX Instruments Ltd.
                • TESTEX Instruments Ltd. - Overview
                • TESTEX Instruments Ltd. - Product / Service
                • TESTEX Instruments Ltd. - Key offerings
                • SWOT
              • 15.17 TUV SUD
                • TUV SUD - Overview
                • TUV SUD - Product / Service
                • TUV SUD - Key offerings
                • SWOT
              • 15.18 TUV SUD AG
                • TUV SUD AG - Overview
                • TUV SUD AG - Product / Service
                • TUV SUD AG - Key offerings
                • SWOT

              16 Appendix

              • 16.1 Scope of the report
                • 16.2 Inclusions and exclusions checklist
                  • Inclusions checklist
                  • Exclusions checklist
                • 16.3 Currency conversion rates for US$
                  • Currency conversion rates for US$
                • 16.4 Research methodology
                  • Research methodology
                • 16.5 Data procurement
                  • Information sources
                • 16.6 Data validation
                  • Data validation
                • 16.7 Validation techniques employed for market sizing
                  • Validation techniques employed for market sizing
                • 16.8 Data synthesis
                  • Data synthesis
                • 16.9 360 degree market analysis
                  • 360 degree market analysis
                • 16.10 List of abbreviations
                  • List of abbreviations

                Research Methodology

                Technavio presents a detailed picture of the market by way of study, synthesis, and summation of data from multiple sources. The analysts have presented the various facets of the market with a particular focus on identifying the key industry influencers. The data thus presented is comprehensive, reliable, and the result of extensive research, both primary and secondary.

                INFORMATION SOURCES

                Primary sources

                • Manufacturers and suppliers
                • Channel partners
                • Industry experts
                • Strategic decision makers

                Secondary sources

                • Industry journals and periodicals
                • Government data
                • Financial reports of key industry players
                • Historical data
                • Press releases

                DATA ANALYSIS

                Data Synthesis

                • Collation of data
                • Estimation of key figures
                • Analysis of derived insights

                Data Validation

                • Triangulation with data models
                • Reference against proprietary databases
                • Corroboration with industry experts

                REPORT WRITING

                Qualitative

                • Market drivers
                • Market challenges
                • Market trends
                • Five forces analysis

                Quantitative

                • Market size and forecast
                • Market segmentation
                • Geographical insights
                • Competitive landscape

                Interested in this report?

                Get your sample now to see our research methodology and insights!

                Download Now

                Frequently Asked Questions

                Textile Testing Equipment market growth will increase by $ 390.6 mn during 2025-2029.

                The Textile Testing Equipment market is expected to grow at a CAGR of 4.6% during 2025-2029.

                Textile Testing Equipment market is segmented by End-user( Textile companies, Professional testing agencies) Application( Apparel industry, Footwear industry, Others, MEA, South America) Technology( Manual, Semi-automated equipment, Fully automated and smart, Middle East and Africa, South America)

                AMETEK Inc., Bureau Veritas SA, Eurofins Scientific SE, Hohenstein, Intertek Group Plc, Paramount Instruments Pvt. Ltd., QIMA Ltd., Rieter Holding AG, Roaches Ltd., SDL Atlas, SGS SA, SMARTEX.AI, TESTEX Instruments Ltd., TUV SUD, TUV SUD AG are a few of the key vendors in the Textile Testing Equipment market.

                APAC will register the highest growth rate of 55% among the other regions. Therefore, the Textile Testing Equipment market in APAC is expected to garner significant business opportunities for the vendors during the forecast period.

                China, US, Japan, India, Germany, South Korea, France, Australia, UK, Italy

                • Rise in demand for technical textilesTechnical textile testing is conducted to ensure the performance standard of textiles. The technical textile testing process involves a routine check of the textiles by testing samples of technical textiles through various standard procedures of quality control. A failure to meet the desired quality from sub-assemblies to final products will result in being classified as a poor-quality textile. As a result is the driving factor this market.
                • each component at every stage of the manufacturing process is tested to ensure high-quality products. Therefore is the driving factor this market.
                • the growing demand for technical testing is expected to propel the growth of the global textile testing equipment market.Technical textiles are used for technical performance and functional properties. The demand for technical textiles is mainly from end-user industries like automotive is the driving factor this market.
                • construction is the driving factor this market.
                • healthcare is the driving factor this market.
                • protective clothing is the driving factor this market.
                • agriculture is the driving factor this market.
                • sports equipment/sportswear is the driving factor this market.
                • and environmental protection. The demand for technical textiles can be attributed to the growing economy is the driving factor this market.
                • rising incomes is the driving factor this market.
                • expanding construction sector is the driving factor this market.
                • medical advances is the driving factor this market.
                • and increasing expenditure on healthcare. These industries demand textiles with features that include increased conductivity is the driving factor this market.
                • filtration is the driving factor this market.
                • flexibility is the driving factor this market.
                • lightweight is the driving factor this market.
                • reinforcement is the driving factor this market.
                • resistance is the driving factor this market.
                • and strength. The production of these textiles requires precision. Therefore is the driving factor this market.
                • the rise in demand for such textiles has compelled OEMs to design machines that are efficient in terms of precision operation and ensure low wastage of textiles.The rising automotive industry offers ample growth opportunities for the technical textile testing equipment market. The growing sales and demand for automobiles and the increase in investments in the automotive sector will spur the growth of the technical textile market. Additionally is the driving factor this market.
                • textile-based products are used in a wide range of applications in the construction industry. The growth in the construction industry is the driving factor this market.
                • especially the residential sector is the driving factor this market.
                • plays a crucial role in triggering the demand for textiles. The construction sector in the US is showing significant growth is the driving factor this market.
                • especially in the residential segment is the driving factor this market.
                • which will drive the demand for technical textiles. The major demand for technical textiles is attributed to the use of protective gear by firefighters is the driving factor this market.
                • military is the driving factor this market.
                • or other types of law enforcement. Increased spending on technical textiles from various sectors drives the demand for textile machinery is the driving factor this market.
                • thus driving the global textile testing equipment market during the forecast period. is the driving factor this market.

                The Textile Testing Equipment market vendors should focus on grabbing business opportunities from the Textile companies segment as it accounted for the largest market share in the base year.