Thickeners Market Size 2024-2028
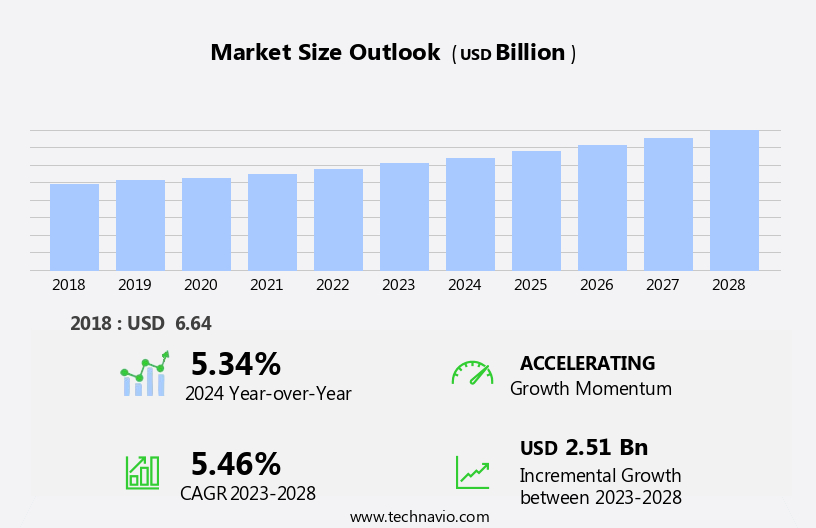
The thickeners market size is forecast to increase by USD 2.51 billion, at a CAGR of 5.46% between 2023 and 2028.
- The market is experiencing significant growth, driven by the increasing demand for sustainable and natural thickeners in various industries. This shift in consumer preferences is leading manufacturers to invest heavily in research and development to produce eco-friendly and efficient thickening solutions. Technological advancements in thickener manufacturing are also playing a pivotal role in market expansion, enabling the production of high-performance thickeners with improved functionality and cost-effectiveness. However, the market faces challenges from the fluctuation in prices of raw materials used in thickener production. These price fluctuations can significantly impact the profitability of manufacturers and require strategic planning to mitigate risks and maintain competitiveness.
- Companies must closely monitor raw material prices and explore alternative sourcing strategies to ensure a steady supply and stable costs. To capitalize on market opportunities and navigate challenges effectively, businesses should focus on innovation, sustainability, and operational efficiency. By investing in R&D, optimizing production processes, and collaborating with suppliers, they can differentiate themselves and stay ahead of the competition.
What will be the Size of the Thickeners Market during the forecast period?

Explore in-depth regional segment analysis with market size data - historical 2018-2022 and forecasts 2024-2028 - in the full report.
Request Free Sample
The market continues to evolve, driven by the diverse applications across various sectors. These essential additives exhibit shear thinning behavior, allowing them to adjust their viscosity in response to applied shear stress. Food grade thickeners, such as guar gum, play a crucial role in viscosity modification, enhancing the texture and consistency of food products. In the pharmaceutical industry, thickeners are employed for emulsion stabilization, ensuring suspension stability and prolonging shelf life. Particle dispersion is another significant application, where thickeners facilitate the uniform distribution of solids in liquid thickeners.. Thixotropic properties enable thickeners to maintain their structure under rest conditions, preventing syneresis and ensuring product quality.
Pharmaceutical and industrial thickeners serve various purposes, including process optimization and rheological property control. Starch-based thickeners and cellulose derivatives are commonly used due to their cost-effectiveness and versatility. However, polymer thickening agents offer superior performance in terms of temperature and pH stability. The ongoing research and development efforts focus on enhancing the functionality of thickeners, such as improving flow behavior index, optimizing concentration effects, and mitigating ionic strength and temperature effects. The market is a dynamic and ever-evolving landscape, with continuous innovation and advancements shaping its future applications.
How is this Thickeners Industry segmented?
The thickeners industry research report provides comprehensive data (region-wise segment analysis), with forecasts and estimates in "USD billion" for the period 2024-2028, as well as historical data from 2018-2022 for the following segments.
- Type
- End-user
- Building and construction
- Automotive
- Packaging
- Others
- Source
- Plant-Based (Guar Gum, Xanthan Gum)
- Animal-Based (Gelatin)
- Microbial
- Synthetic
- Geography
- North America
- Europe
- Middle East and Africa
- APAC
- China
- India
- Indonesia
- Japan
- Malaysia
- South Korea
- Thailand
- South America
- Rest of World (ROW)
By Type Insights
The organic segment is estimated to witness significant growth during the forecast period.
Organic thickeners, derived from natural sources such as cellulosic materials, polyacellulose, and polyurethanes, are gaining popularity due to their sustainability and reduced environmental impact. These materials can be processed and modified to achieve desirable rheological properties, making them suitable for various applications. Cellulosic ethers, like hydroxypropyl methylcellulose (HPMC) and carboxymethyl cellulose (CMC), are water-soluble polymers derived from cellulose. They are extensively used in industries for their ability to modify the viscosity and stability of liquids. HPMC and CMC exhibit thixotropic properties, which allow them to maintain a stable structure under rest but flow easily when agitated.
They are effective in preventing syneresis, a problem where a gel or suspension separates from the liquid. In food applications, these thickeners are used for viscosity modification and texture enhancement, particularly in the production of ice cream and sauces. Pharmaceutical industries rely on these thickeners for emulsion stabilization and suspension stability, ensuring the uniformity and quality of their products. In industrial applications, they are used for process optimization, improving flow behavior and reducing sedimentation. The thickening agents' performance is influenced by factors such as concentration, pH, temperature, and ionic strength. Starch-based thickeners and cellulose derivatives are other classes of organic thickeners that offer advantages such as cost-effectiveness and ease of use.
Xanthan gum, a microbial polysaccharide, is another popular thickener due to its high viscosity and shear thinning behavior, making it suitable for applications where a pourable consistency is required. Rheometer testing is used to evaluate the thickeners' performance, ensuring consistency and quality in various applications. Proper quality control testing is essential to maintain the desired rheological properties and shelf life extension.

Request Free Sample
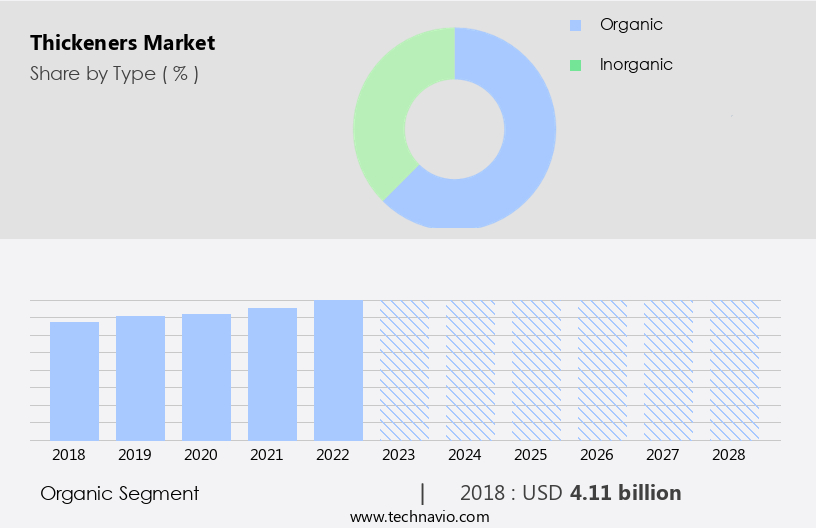
The Organic segment was valued at USD 4.11 billion in 2018 and showed a gradual increase during the forecast period.
Regional Analysis
APAC is estimated to contribute 48% to the growth of the global market during the forecast period.Technavio's analysts have elaborately explained the regional trends and drivers that shape the market during the forecast period.

Request Free Sample
In the dynamic and evolving market for thickeners, various entities play significant roles in shaping trends and driving demand. Yield stress measurement and rheological properties are crucial factors influencing the selection and application of thickeners in industries. PH effects and concentration can impact the consistency coefficient and viscosity modification. Thixotropic properties and syneresis prevention are essential for maintaining desired texture and preventing separation in applications. Application methods vary, with quality control testing ensuring product consistency and compliance. Shear thinning behavior is a critical consideration for industrial thickeners, while food grade thickeners are essential for the food industry. Thickeners enhance performance and functionality in various sectors, including pharmaceuticals for emulsion stabilization, suspension stability, and shelf life extension.
Process optimization through the use of starch-based thickeners, cellulose derivatives, and polymer thickening agents is a focus for manufacturers. Ionic strength and temperature effects can impact thickener performance, necessitating careful consideration. Xanthan gum properties, including gelation mechanism and storage stability, are vital for specific applications. In the APAC region, population growth and urbanization fuel demand for thickeners in industries such as textiles, paints, and coatings. Rising disposable incomes and consumer spending on automobile, building, and construction sectors further boost demand. Rapid industrial development in countries like China and India, particularly in paints and coatings, textiles, and adhesives, underlines the importance of thickeners in regional growth.
Market Dynamics
Our researchers analyzed the data with 2023 as the base year, along with the key drivers, trends, and challenges. A holistic analysis of drivers will help companies refine their marketing strategies to gain a competitive advantage.
What are the key market drivers leading to the rise in the adoption of Thickeners Industry?
- The market's growth is primarily attributed to the rising demand for sustainable and natural thickeners, making their use a key market trend.
- The market is witnessing significant growth due to the increasing demand for sustainable alternatives in various industries, particularly in paints and coatings. Natural thickeners, derived from renewable resources such as plants, starches, or cellulose, are gaining popularity due to their biodegradable and environmentally friendly properties. These alternatives offer comparable or superior performance to traditional thickeners derived from petrochemical sources. Strict regulations, such as the REACH regulation, which aims to ensure the safe use of chemicals while protecting human health and the environment, have prompted manufacturers to seek greener alternatives. The rheological properties of thickeners, including yield stress measurement, consistency coefficient, and thixotropic properties, significantly impact the performance of paints and coatings.
- Concentration effects and pH effects are also crucial factors in determining the suitability of thickeners for specific applications. Syneresis prevention is another essential consideration in the selection of thickeners. Application methods and quality control testing are vital aspects of the market, ensuring the consistent production of high-quality products. Understanding the rheological properties and their effects on the final product is crucial for manufacturers to optimize their formulations and meet the evolving demands of consumers and regulations.
What are the market trends shaping the Thickeners Industry?
- The trend in the market points towards advancements in thickener manufacturing technology. This sector is experiencing significant growth and innovation.
- Advancements in technology are driving the evolution of thickeners, particularly in the extraction processes for natural options. Innovations such as enzymatic extraction and advanced filtration technologies are enhancing efficiency and reducing costs. Academic institutions and research laboratories are at the forefront of this research, investigating enzymatic mechanisms for plant cell wall degradation and optimizing enzyme formulations for efficient extraction of pectin and other valuable compounds from citrus peels. These advancements result in improved product consistency, larger-scale production, and cost savings, making natural thickeners increasingly competitive with synthetic alternatives.
- Furthermore, advancements in material science and biotechnology are leading to the creation of new thickener types with specialized functionalities, such as shear thinning behavior, particle dispersion, viscosity modification, emulsion stabilization, suspension stability, and shelf life extension. These technological advancements underscore the dynamic nature of the market and its potential for continued growth.
What challenges does the Thickeners Industry face during its growth?
- The volatility in the pricing of raw materials utilized in the production of thickeners poses a significant challenge to the industry's growth trajectory.
- The market faces price challenges due to the volatile nature of raw materials used in their production. Raw materials, which include natural polymers, synthetic polymers, gums, and chemical compounds, are subject to price fluctuations caused by various factors such as supply-demand dynamics, geopolitical tensions, weather conditions, and currency fluctuations. For example, natural thickeners like xanthan gum and starch-based thickeners are derived from plants and are susceptible to price fluctuations due to factors like crop yields, weather conditions affecting harvests, and changes in agricultural practices. In addition, process optimization is crucial in the thickeners industry to mitigate these price fluctuations.
- Factors such as the flow behavior index, ionic strength effects, and temperature effects significantly impact viscosity control. Polymer thickening agents, such as cellulose derivatives and xanthan gum, play a vital role in maintaining the desired viscosity in various industries, including food and beverage, pharmaceuticals, and oil and gas. Understanding these factors and their impact on thickener production is essential for market participants to effectively manage their supply chains and maintain profitability.
Exclusive Customer Landscape
The thickeners market forecasting report includes the adoption lifecycle of the market, covering from the innovator's stage to the laggard's stage. It focuses on adoption rates in different regions based on penetration. Furthermore, the thickeners market report also includes key purchase criteria and drivers of price sensitivity to help companies evaluate and develop their market growth analysis strategies.

Customer Landscape
Key Companies & Market Insights
Companies are implementing various strategies, such as strategic alliances, thickeners market forecast, partnerships, mergers and acquisitions, geographical expansion, and product/service launches, to enhance their presence in the industry.
Akzo Nobel NV - The company specializes in providing advanced thickeners, including Polibrid 705E, for the water-based paint and coatings industry. This thickener enhances product viscosity and texture, contributing significantly to the performance and quality of various coatings applications.
The industry research and growth report includes detailed analyses of the competitive landscape of the market and information about key companies, including:
- Akzo Nobel NV
- Altana AG
- Andritz AG
- Archer Daniels Midland Co.
- Arkema Group
- Ashland Inc.
- Axalta Coating Systems Ltd.
- BASF SE
- Berkshire Hathaway Inc.
- Clariant International Ltd.
- Dow Chemical Co.
- DuPont de Nemours Inc.
- Eastman Chemical Co.
- Henkel AG and Co. KGaA
- J M Huber Corp.
- Nouryon Chemicals Holding BV
- PPG Industries Inc.
- RAG Stiftung
- Standard Industries Inc.
- Sumitomo Chemical Co. Ltd.
Qualitative and quantitative analysis of companies has been conducted to help clients understand the wider business environment as well as the strengths and weaknesses of key industry players. Data is qualitatively analyzed to categorize companies as pure play, category-focused, industry-focused, and diversified; it is quantitatively analyzed to categorize companies as dominant, leading, strong, tentative, and weak.
Recent Development and News in Thickeners Market
- In January 2024, DuPont Nutrition & Biosciences announced the launch of its new line of renewable thickeners, Danisco Danisco® PureSolve HM, in collaboration with Danisco A/S. This innovative product line offers improved texture and stability in various food and beverage applications, catering to the growing demand for clean-label and sustainable solutions (DuPont Press Release, 2024).
- In March 2024, Ashland Global Holdings Inc. And Ingredion Incorporated entered into a strategic partnership to expand their offerings in the market. The collaboration combines Ashland's specialty chemicals expertise with Ingredion's broad portfolio of plant-based texturizers, creating a comprehensive range of solutions for food, beverage, and industrial applications (Ashland Press Release, 2024).
- In May 2024, BASF SE completed the acquisition of Solvay's European dispersions business, including its thickeners division. This strategic move significantly expanded BASF's portfolio in the market, strengthening its position in the European market and providing access to Solvay's advanced technologies and customer base (BASF Press Release, 2024).
- In February 2025, the European Commission approved the use of microbial thickeners in food applications, marking a significant regulatory milestone for the market. This approval opens up new opportunities for manufacturers to develop and market innovative, sustainable, and cost-effective thickening solutions for the European food industry (European Commission Press Release, 2025).
Research Analyst Overview
- The market encompasses a range of polymer solutions, including colloidal suspensions and particle size distributions, that significantly influence the binder properties of various industries. Understanding thickener compatibility and chemical structure is crucial for optimizing pumping characteristics and ensuring regulatory compliance. Environmental impact and surface chemistry are increasingly important considerations, as are electrostatic interactions, hydrogen bonding, and rheology characterization. Application techniques, such as film formation and cost-effectiveness analysis, are essential for selecting the most appropriate thickener.
- Molecular weight distribution and hydrophobic interactions play a role in adhesive properties, while steric stabilization and safety data sheets are vital for ensuring safety and performance evaluation. Regulatory bodies continue to prioritize thickener selection based on interaction forces and flow rate optimization.
Dive into Technavio's robust research methodology, blending expert interviews, extensive data synthesis, and validated models for unparalleled Thickeners Market insights. See full methodology.
Market Scope
|
Report Coverage
|
Details
|
Page number
|
184
|
Base year
|
2023
|
Historic period
|
2018-2022 |
Forecast period
|
2024-2028
|
Growth momentum & CAGR
|
Accelerate at a CAGR of 5.46%
|
Market growth 2024-2028
|
USD 2.51 billion
|
Market structure
|
Fragmented
|
YoY growth 2023-2024(%)
|
5.34
|
Key countries
|
US, Malaysia, Indonesia, Germany, UK, South Korea, France, Canada, Brazil, Thailand, UAE, Mexico, China, Japan, and India
|
Competitive landscape
|
Leading Companies, Market Positioning of Companies, Competitive Strategies, and Industry Risks
|
Request Free Sample
What are the Key Data Covered in this Thickeners Market Research and Growth Report?
- CAGR of the Thickeners industry during the forecast period
- Detailed information on factors that will drive the growth and forecasting between 2024 and 2028
- Precise estimation of the size of the market and its contribution of the industry in focus to the parent market
- Accurate predictions about upcoming growth and trends and changes in consumer behaviour
- Growth of the market across APAC, Europe, North America, Middle East and Africa, and South America
- Thorough analysis of the market's competitive landscape and detailed information about companies
- Comprehensive analysis of factors that will challenge the thickeners market growth of industry companies
We can help! Our analysts can customize this thickeners market research report to meet your requirements.
Get in touch
1 Executive Summary
- 1.1 Market overview
- Exhibit 01: Executive Summary – Chart on Market Overview
- Exhibit 02: Executive Summary – Data Table on Market Overview
- Exhibit 03: Executive Summary – Chart on Global Market Characteristics
- Exhibit 04: Executive Summary – Chart on Market by Geography
- Exhibit 05: Executive Summary – Chart on Market Segmentation by Type
- Exhibit 06: Executive Summary – Chart on Market Segmentation by End-user
- Exhibit 07: Executive Summary – Chart on Incremental Growth
- Exhibit 08: Executive Summary – Data Table on Incremental Growth
- Exhibit 09: Executive Summary – Chart on Vendor Market Positioning
2 Market Landscape
- 2.1 Market ecosystem
- Exhibit 10: Parent market
- Exhibit 11: Market Characteristics
3 Market Sizing
- 3.1 Market definition
- Exhibit 12: Offerings of vendors included in the market definition
- 3.2 Market segment analysis
- Exhibit 13: Market segments
- 3.4 Market outlook: Forecast for 2023-2028
- Exhibit 14: Chart on Global - Market size and forecast 2023-2028 ($ million)
- Exhibit 15: Data Table on Global - Market size and forecast 2023-2028 ($ million)
- Exhibit 16: Chart on Global Market: Year-over-year growth 2023-2028 (%)
- Exhibit 17: Data Table on Global Market: Year-over-year growth 2023-2028 (%)
4 Historic Market Size
- 4.1 Global thickeners market 2018 - 2022
- Exhibit 18: Historic Market Size – Data Table on global thickeners market 2018 - 2022 ($ million)
- 4.2 Type Segment Analysis 2018 - 2022
- Exhibit 19: Historic Market Size – Type Segment 2018 - 2022 ($ million)
- 4.3 End-user Segment Analysis 2018 - 2022
- Exhibit 20: Historic Market Size – End-user Segment 2018 - 2022 ($ million)
- 4.4 Geography Segment Analysis 2018 - 2022
- Exhibit 21: Historic Market Size – Geography Segment 2018 - 2022 ($ million)
- 4.5 Country Segment Analysis 2018 - 2022
- Exhibit 22: Historic Market Size – Country Segment 2018 - 2022 ($ million)
5 Five Forces Analysis
- 5.1 Five forces summary
- Exhibit 23: Five forces analysis - Comparison between 2023 and 2028
- 5.2 Bargaining power of buyers
- Exhibit 24: Chart on Bargaining power of buyers – Impact of key factors 2023 and 2028
- 5.3 Bargaining power of suppliers
- Exhibit 25: Bargaining power of suppliers – Impact of key factors in 2023 and 2028
- 5.4 Threat of new entrants
- Exhibit 26: Threat of new entrants – Impact of key factors in 2023 and 2028
- 5.5 Threat of substitutes
- Exhibit 27: Threat of substitutes – Impact of key factors in 2023 and 2028
- 5.6 Threat of rivalry
- Exhibit 28: Threat of rivalry – Impact of key factors in 2023 and 2028
- 5.7 Market condition
- Exhibit 29: Chart on Market condition - Five forces 2023 and 2028
6 Market Segmentation by Type
- 6.1 Market segments
- Chart on Type - Market share (2023-2028) (%)
- Data Table on Type - Market share (2023-2028) (%)
- 6.2 Comparison by Type
- Chart on Comparison by Type
- Data Table on Comparison by Type
- 6.3 Organic - Market size and forecast (2023-2028)
- Chart on Organic - Market size and forecast (2023-2028) ($ million)
- Data Table on Organic - Market size and forecast (2023-2028) ($ million)
- Chart on Organic - Year-over-year growth (2023-2028) (%)
- Data Table on Organic - Year-over-year growth (2023-2028) (%)
- 6.4 Inorganic - Market size and forecast (2023-2028)
- Chart on Inorganic - Market size and forecast (2023-2028) ($ million)
- Data Table on Inorganic - Market size and forecast (2023-2028) ($ million)
- Chart on Inorganic - Year-over-year growth (2023-2028) (%)
- Data Table on Inorganic - Year-over-year growth (2023-2028) (%)
- 6.5 Market opportunity by Type
- Market opportunity by Type ($ million)
- Data Table on Market opportunity by Type ($ million)
7 Market Segmentation by End-user
- 7.1 Market segments
- Chart on End-user - Market share (2023-2028) (%)
- Data Table on End-user - Market share (2023-2028) (%)
- 7.2 Comparison by End-user
- Chart on Comparison by End-user
- Data Table on Comparison by End-user
- 7.3 Building and construction - Market size and forecast (2023-2028)
- Chart on Building and construction - Market size and forecast (2023-2028) ($ million)
- Data Table on Building and construction - Market size and forecast (2023-2028) ($ million)
- Chart on Building and construction - Year-over-year growth (2023-2028) (%)
- Data Table on Building and construction - Year-over-year growth (2023-2028) (%)
- 7.4 Automotive - Market size and forecast (2023-2028)
- Chart on Automotive - Market size and forecast (2023-2028) ($ million)
- Data Table on Automotive - Market size and forecast (2023-2028) ($ million)
- Chart on Automotive - Year-over-year growth (2023-2028) (%)
- Data Table on Automotive - Year-over-year growth (2023-2028) (%)
- 7.5 Packaging - Market size and forecast (2023-2028)
- Chart on Packaging - Market size and forecast (2023-2028) ($ million)
- Data Table on Packaging - Market size and forecast (2023-2028) ($ million)
- Chart on Packaging - Year-over-year growth (2023-2028) (%)
- Data Table on Packaging - Year-over-year growth (2023-2028) (%)
- 7.6 Others - Market size and forecast (2023-2028)
- Chart on Others - Market size and forecast (2023-2028) ($ million)
- Data Table on Others - Market size and forecast (2023-2028) ($ million)
- Chart on Others - Year-over-year growth (2023-2028) (%)
- Data Table on Others - Year-over-year growth (2023-2028) (%)
- 7.7 Market opportunity by End-user
- Market opportunity by End-user ($ million)
- Data Table on Market opportunity by End-user ($ million)
8 Market Segmentation by Source
- 8.1 Market segments
- Chart on Source - Market share (2023-2028) (%)
- Data Table on Source - Market share (2023-2028) (%)
- 8.2 Comparison by Source
- Chart on Comparison by Source
- Data Table on Comparison by Source
- 8.3 Plant-Based (Guar Gum, Xanthan Gum) - Market size and forecast (2023-2028)
- Chart on Plant-Based (Guar Gum, Xanthan Gum) - Market size and forecast (2023-2028) ($ million)
- Data Table on Plant-Based (Guar Gum, Xanthan Gum) - Market size and forecast (2023-2028) ($ million)
- Chart on Plant-Based (Guar Gum, Xanthan Gum) - Year-over-year growth (2023-2028) (%)
- Data Table on Plant-Based (Guar Gum, Xanthan Gum) - Year-over-year growth (2023-2028) (%)
- 8.4 Animal-Based (Gelatin) - Market size and forecast (2023-2028)
- Chart on Animal-Based (Gelatin) - Market size and forecast (2023-2028) ($ million)
- Data Table on Animal-Based (Gelatin) - Market size and forecast (2023-2028) ($ million)
- Chart on Animal-Based (Gelatin) - Year-over-year growth (2023-2028) (%)
- Data Table on Animal-Based (Gelatin) - Year-over-year growth (2023-2028) (%)
- 8.5 Microbial - Market size and forecast (2023-2028)
- Chart on Microbial - Market size and forecast (2023-2028) ($ million)
- Data Table on Microbial - Market size and forecast (2023-2028) ($ million)
- Chart on Microbial - Year-over-year growth (2023-2028) (%)
- Data Table on Microbial - Year-over-year growth (2023-2028) (%)
- 8.6 Synthetic - Market size and forecast (2023-2028)
- Chart on Synthetic - Market size and forecast (2023-2028) ($ million)
- Data Table on Synthetic - Market size and forecast (2023-2028) ($ million)
- Chart on Synthetic - Year-over-year growth (2023-2028) (%)
- Data Table on Synthetic - Year-over-year growth (2023-2028) (%)
- 8.7 Market opportunity by Source
- Market opportunity by Source ($ million)
- Data Table on Market opportunity by Source ($ million)
8 Customer Landscape
- 8.1 Customer landscape overview
- Exhibit 66: Analysis of price sensitivity, lifecycle, customer purchase basket, adoption rates, and purchase criteria
9 Geographic Landscape
- 9.1 Geographic segmentation
- Exhibit 67: Chart on Market share by geography 2023-2028 (%)
- Exhibit 68: Data Table on Market share by geography 2023-2028 (%)
- 9.2 Geographic comparison
- Exhibit 69: Chart on Geographic comparison
- Exhibit 70: Data Table on Geographic comparison
- 9.3 APAC - Market size and forecast 2023-2028
- Exhibit 71: Chart on APAC - Market size and forecast 2023-2028 ($ million)
- Exhibit 72: Data Table on APAC - Market size and forecast 2023-2028 ($ million)
- Exhibit 73: Chart on APAC - Year-over-year growth 2023-2028 (%)
- Exhibit 74: Data Table on APAC - Year-over-year growth 2023-2028 (%)
- 9.4 Europe - Market size and forecast 2023-2028
- Exhibit 75: Chart on Europe - Market size and forecast 2023-2028 ($ million)
- Exhibit 76: Data Table on Europe - Market size and forecast 2023-2028 ($ million)
- Exhibit 77: Chart on Europe - Year-over-year growth 2023-2028 (%)
- Exhibit 78: Data Table on Europe - Year-over-year growth 2023-2028 (%)
- 9.5 North America - Market size and forecast 2023-2028
- Exhibit 79: Chart on North America - Market size and forecast 2023-2028 ($ million)
- Exhibit 80: Data Table on North America - Market size and forecast 2023-2028 ($ million)
- Exhibit 81: Chart on North America - Year-over-year growth 2023-2028 (%)
- Exhibit 82: Data Table on North America - Year-over-year growth 2023-2028 (%)
- 9.6 Middle East and Africa - Market size and forecast 2023-2028
- Exhibit 83: Chart on Middle East and Africa - Market size and forecast 2023-2028 ($ million)
- Exhibit 84: Data Table on Middle East and Africa - Market size and forecast 2023-2028 ($ million)
- Exhibit 85: Chart on Middle East and Africa - Year-over-year growth 2023-2028 (%)
- Exhibit 86: Data Table on Middle East and Africa - Year-over-year growth 2023-2028 (%)
- 9.7 South America - Market size and forecast 2023-2028
- Exhibit 87: Chart on South America - Market size and forecast 2023-2028 ($ million)
- Exhibit 88: Data Table on South America - Market size and forecast 2023-2028 ($ million)
- Exhibit 89: Chart on South America - Year-over-year growth 2023-2028 (%)
- Exhibit 90: Data Table on South America - Year-over-year growth 2023-2028 (%)
- 9.8 China - Market size and forecast 2023-2028
- Exhibit 91: Chart on China - Market size and forecast 2023-2028 ($ million)
- Exhibit 92: Data Table on China - Market size and forecast 2023-2028 ($ million)
- Exhibit 93: Chart on China - Year-over-year growth 2023-2028 (%)
- Exhibit 94: Data Table on China - Year-over-year growth 2023-2028 (%)
- 9.9 US - Market size and forecast 2023-2028
- Exhibit 95: Chart on US - Market size and forecast 2023-2028 ($ million)
- Exhibit 96: Data Table on US - Market size and forecast 2023-2028 ($ million)
- Exhibit 97: Chart on US - Year-over-year growth 2023-2028 (%)
- Exhibit 98: Data Table on US - Year-over-year growth 2023-2028 (%)
- 9.10 Germany - Market size and forecast 2023-2028
- Exhibit 99: Chart on Germany - Market size and forecast 2023-2028 ($ million)
- Exhibit 100: Data Table on Germany - Market size and forecast 2023-2028 ($ million)
- Exhibit 101: Chart on Germany - Year-over-year growth 2023-2028 (%)
- Exhibit 102: Data Table on Germany - Year-over-year growth 2023-2028 (%)
- 9.11 India - Market size and forecast 2023-2028
- Exhibit 103: Chart on India - Market size and forecast 2023-2028 ($ million)
- Exhibit 104: Data Table on India - Market size and forecast 2023-2028 ($ million)
- Exhibit 105: Chart on India - Year-over-year growth 2023-2028 (%)
- Exhibit 106: Data Table on India - Year-over-year growth 2023-2028 (%)
- 9.12 UK - Market size and forecast 2023-2028
- Exhibit 107: Chart on UK - Market size and forecast 2023-2028 ($ million)
- Exhibit 108: Data Table on UK - Market size and forecast 2023-2028 ($ million)
- Exhibit 109: Chart on UK - Year-over-year growth 2023-2028 (%)
- Exhibit 110: Data Table on UK - Year-over-year growth 2023-2028 (%)
- 9.13 Market opportunity by geography
- Exhibit 111: Market opportunity by geography ($ million)
- Exhibit 112: Data Tables on Market opportunity by geography ($ million)
- 10.14 US - Market size and forecast (2023-2028)
- Chart on US - Market size and forecast (2023-2028) ($ million)
- Data Table on US - Market size and forecast (2023-2028) ($ million)
- Chart on US - Year-over-year growth (2023-2028) (%)
- Data Table on US - Year-over-year growth (2023-2028) (%)
- 10.15 Malaysia - Market size and forecast (2023-2028)
- Chart on Malaysia - Market size and forecast (2023-2028) ($ million)
- Data Table on Malaysia - Market size and forecast (2023-2028) ($ million)
- Chart on Malaysia - Year-over-year growth (2023-2028) (%)
- Data Table on Malaysia - Year-over-year growth (2023-2028) (%)
- 10.16 Indonesia - Market size and forecast (2023-2028)
- Chart on Indonesia - Market size and forecast (2023-2028) ($ million)
- Data Table on Indonesia - Market size and forecast (2023-2028) ($ million)
- Chart on Indonesia - Year-over-year growth (2023-2028) (%)
- Data Table on Indonesia - Year-over-year growth (2023-2028) (%)
- 10.17 South Korea - Market size and forecast (2023-2028)
- Chart on South Korea - Market size and forecast (2023-2028) ($ million)
- Data Table on South Korea - Market size and forecast (2023-2028) ($ million)
- Chart on South Korea - Year-over-year growth (2023-2028) (%)
- Data Table on South Korea - Year-over-year growth (2023-2028) (%)
- 10.18 France - Market size and forecast (2023-2028)
- Chart on France - Market size and forecast (2023-2028) ($ million)
- Data Table on France - Market size and forecast (2023-2028) ($ million)
- Chart on France - Year-over-year growth (2023-2028) (%)
- Data Table on France - Year-over-year growth (2023-2028) (%)
- 10.19 Canada - Market size and forecast (2023-2028)
- Chart on Canada - Market size and forecast (2023-2028) ($ million)
- Data Table on Canada - Market size and forecast (2023-2028) ($ million)
- Chart on Canada - Year-over-year growth (2023-2028) (%)
- Data Table on Canada - Year-over-year growth (2023-2028) (%)
- 10.20 Brazil - Market size and forecast (2023-2028)
- Chart on Brazil - Market size and forecast (2023-2028) ($ million)
- Data Table on Brazil - Market size and forecast (2023-2028) ($ million)
- Chart on Brazil - Year-over-year growth (2023-2028) (%)
- Data Table on Brazil - Year-over-year growth (2023-2028) (%)
- 10.21 Thailand - Market size and forecast (2023-2028)
- Chart on Thailand - Market size and forecast (2023-2028) ($ million)
- Data Table on Thailand - Market size and forecast (2023-2028) ($ million)
- Chart on Thailand - Year-over-year growth (2023-2028) (%)
- Data Table on Thailand - Year-over-year growth (2023-2028) (%)
- 10.22 UAE - Market size and forecast (2023-2028)
- Chart on UAE - Market size and forecast (2023-2028) ($ million)
- Data Table on UAE - Market size and forecast (2023-2028) ($ million)
- Chart on UAE - Year-over-year growth (2023-2028) (%)
- Data Table on UAE - Year-over-year growth (2023-2028) (%)
- 10.23 Mexico - Market size and forecast (2023-2028)
- Chart on Mexico - Market size and forecast (2023-2028) ($ million)
- Data Table on Mexico - Market size and forecast (2023-2028) ($ million)
- Chart on Mexico - Year-over-year growth (2023-2028) (%)
- Data Table on Mexico - Year-over-year growth (2023-2028) (%)
- 10.24 Japan - Market size and forecast (2023-2028)
- Chart on Japan - Market size and forecast (2023-2028) ($ million)
- Data Table on Japan - Market size and forecast (2023-2028) ($ million)
- Chart on Japan - Year-over-year growth (2023-2028) (%)
- Data Table on Japan - Year-over-year growth (2023-2028) (%)
- 10.25 Rest of World (ROW) - Market size and forecast (2023-2028)
- Chart on Rest of World (ROW) - Market size and forecast (2023-2028) ($ million)
- Data Table on Rest of World (ROW) - Market size and forecast (2023-2028) ($ million)
- Chart on Rest of World (ROW) - Year-over-year growth (2023-2028) (%)
- Data Table on Rest of World (ROW) - Year-over-year growth (2023-2028) (%)
10 Drivers, Challenges, and Trends
- 10.3 Impact of drivers and challenges
- Exhibit 113: Impact of drivers and challenges in 2023 and 2028
11 Vendor Landscape
- 11.2 Vendor landscape
- Exhibit 114: Overview on Criticality of inputs and Factors of differentiation
- 11.3 Landscape disruption
- Exhibit 115: Overview on factors of disruption
- 11.4 Industry risks
- Exhibit 116: Impact of key risks on business
12 Vendor Analysis
- 12.1 Vendors covered
- Exhibit 117: Vendors covered
- 12.2 Market positioning of vendors
- Exhibit 118: Matrix on vendor position and classification
- 12.3 Akzo Nobel NV
- Exhibit 119: Akzo Nobel NV - Overview
- Exhibit 120: Akzo Nobel NV - Business segments
- Exhibit 121: Akzo Nobel NV - Key offerings
- Exhibit 122: Akzo Nobel NV - Segment focus
- 12.4 Altana AG
- Exhibit 123: Altana AG - Overview
- Exhibit 124: Altana AG - Business segments
- Exhibit 125: Altana AG - Key news
- Exhibit 126: Altana AG - Key offerings
- Exhibit 127: Altana AG - Segment focus
- 12.5 Andritz AG
- Exhibit 128: Andritz AG - Overview
- Exhibit 129: Andritz AG - Business segments
- Exhibit 130: Andritz AG - Key news
- Exhibit 131: Andritz AG - Key offerings
- Exhibit 132: Andritz AG - Segment focus
- 12.6 Archer Daniels Midland Co.
- Exhibit 133: Archer Daniels Midland Co. - Overview
- Exhibit 134: Archer Daniels Midland Co. - Business segments
- Exhibit 135: Archer Daniels Midland Co. - Key news
- Exhibit 136: Archer Daniels Midland Co. - Key offerings
- Exhibit 137: Archer Daniels Midland Co. - Segment focus
- 12.7 Arkema Group
- Exhibit 138: Arkema Group - Overview
- Exhibit 139: Arkema Group - Business segments
- Exhibit 140: Arkema Group - Key news
- Exhibit 141: Arkema Group - Key offerings
- Exhibit 142: Arkema Group - Segment focus
- 12.8 Ashland Inc.
- Exhibit 143: Ashland Inc. - Overview
- Exhibit 144: Ashland Inc. - Business segments
- Exhibit 145: Ashland Inc. - Key news
- Exhibit 146: Ashland Inc. - Key offerings
- Exhibit 147: Ashland Inc. - Segment focus
- 12.9 Axalta Coating Systems Ltd.
- Exhibit 148: Axalta Coating Systems Ltd. - Overview
- Exhibit 149: Axalta Coating Systems Ltd. - Business segments
- Exhibit 150: Axalta Coating Systems Ltd. - Key offerings
- Exhibit 151: Axalta Coating Systems Ltd. - Segment focus
- 12.10 BASF SE
- Exhibit 152: BASF SE - Overview
- Exhibit 153: BASF SE - Business segments
- Exhibit 154: BASF SE - Key news
- Exhibit 155: BASF SE - Key offerings
- Exhibit 156: BASF SE - Segment focus
- 12.11 Dow Chemical Co.
- Exhibit 157: Dow Chemical Co. - Overview
- Exhibit 158: Dow Chemical Co. - Business segments
- Exhibit 159: Dow Chemical Co. - Key news
- Exhibit 160: Dow Chemical Co. - Key offerings
- Exhibit 161: Dow Chemical Co. - Segment focus
- 12.12 DuPont de Nemours Inc.
- Exhibit 162: DuPont de Nemours Inc. - Overview
- Exhibit 163: DuPont de Nemours Inc. - Business segments
- Exhibit 164: DuPont de Nemours Inc. - Key news
- Exhibit 165: DuPont de Nemours Inc. - Key offerings
- Exhibit 166: DuPont de Nemours Inc. - Segment focus
- 12.13 Eastman Chemical Co.
- Exhibit 167: Eastman Chemical Co. - Overview
- Exhibit 168: Eastman Chemical Co. - Business segments
- Exhibit 169: Eastman Chemical Co. - Key offerings
- Exhibit 170: Eastman Chemical Co. - Segment focus
- 12.14 Henkel AG and Co. KGaA
- Exhibit 171: Henkel AG and Co. KGaA - Overview
- Exhibit 172: Henkel AG and Co. KGaA - Business segments
- Exhibit 173: Henkel AG and Co. KGaA - Key offerings
- Exhibit 174: Henkel AG and Co. KGaA - Segment focus
- 12.15 J M Huber Corp.
- Exhibit 175: J M Huber Corp. - Overview
- Exhibit 176: J M Huber Corp. - Product / Service
- Exhibit 177: J M Huber Corp. - Key offerings
- 12.16 Nouryon Chemicals Holding BV
- Exhibit 178: Nouryon Chemicals Holding BV - Overview
- Exhibit 179: Nouryon Chemicals Holding BV - Business segments
- Exhibit 180: Nouryon Chemicals Holding BV - Key news
- Exhibit 181: Nouryon Chemicals Holding BV - Key offerings
- Exhibit 182: Nouryon Chemicals Holding BV - Segment focus
- 12.17 PPG Industries Inc.
- Exhibit 183: PPG Industries Inc. - Overview
- Exhibit 184: PPG Industries Inc. - Business segments
- Exhibit 185: PPG Industries Inc. - Key news
- Exhibit 186: PPG Industries Inc. - Key offerings
- Exhibit 187: PPG Industries Inc. - Segment focus
13 Appendix
- 13.2 Inclusions and exclusions checklist
- Exhibit 188: Inclusions checklist
- Exhibit 189: Exclusions checklist
- 13.3 Currency conversion rates for US$
- Exhibit 190: Currency conversion rates for US$
- 13.4 Research methodology
- Exhibit 191: Research methodology
- Exhibit 192: Validation techniques employed for market sizing
- Exhibit 193: Information sources
- 13.5 List of abbreviations
- Exhibit 194: List of abbreviations