
India Third-Party Logistics Market Size 2025-2029
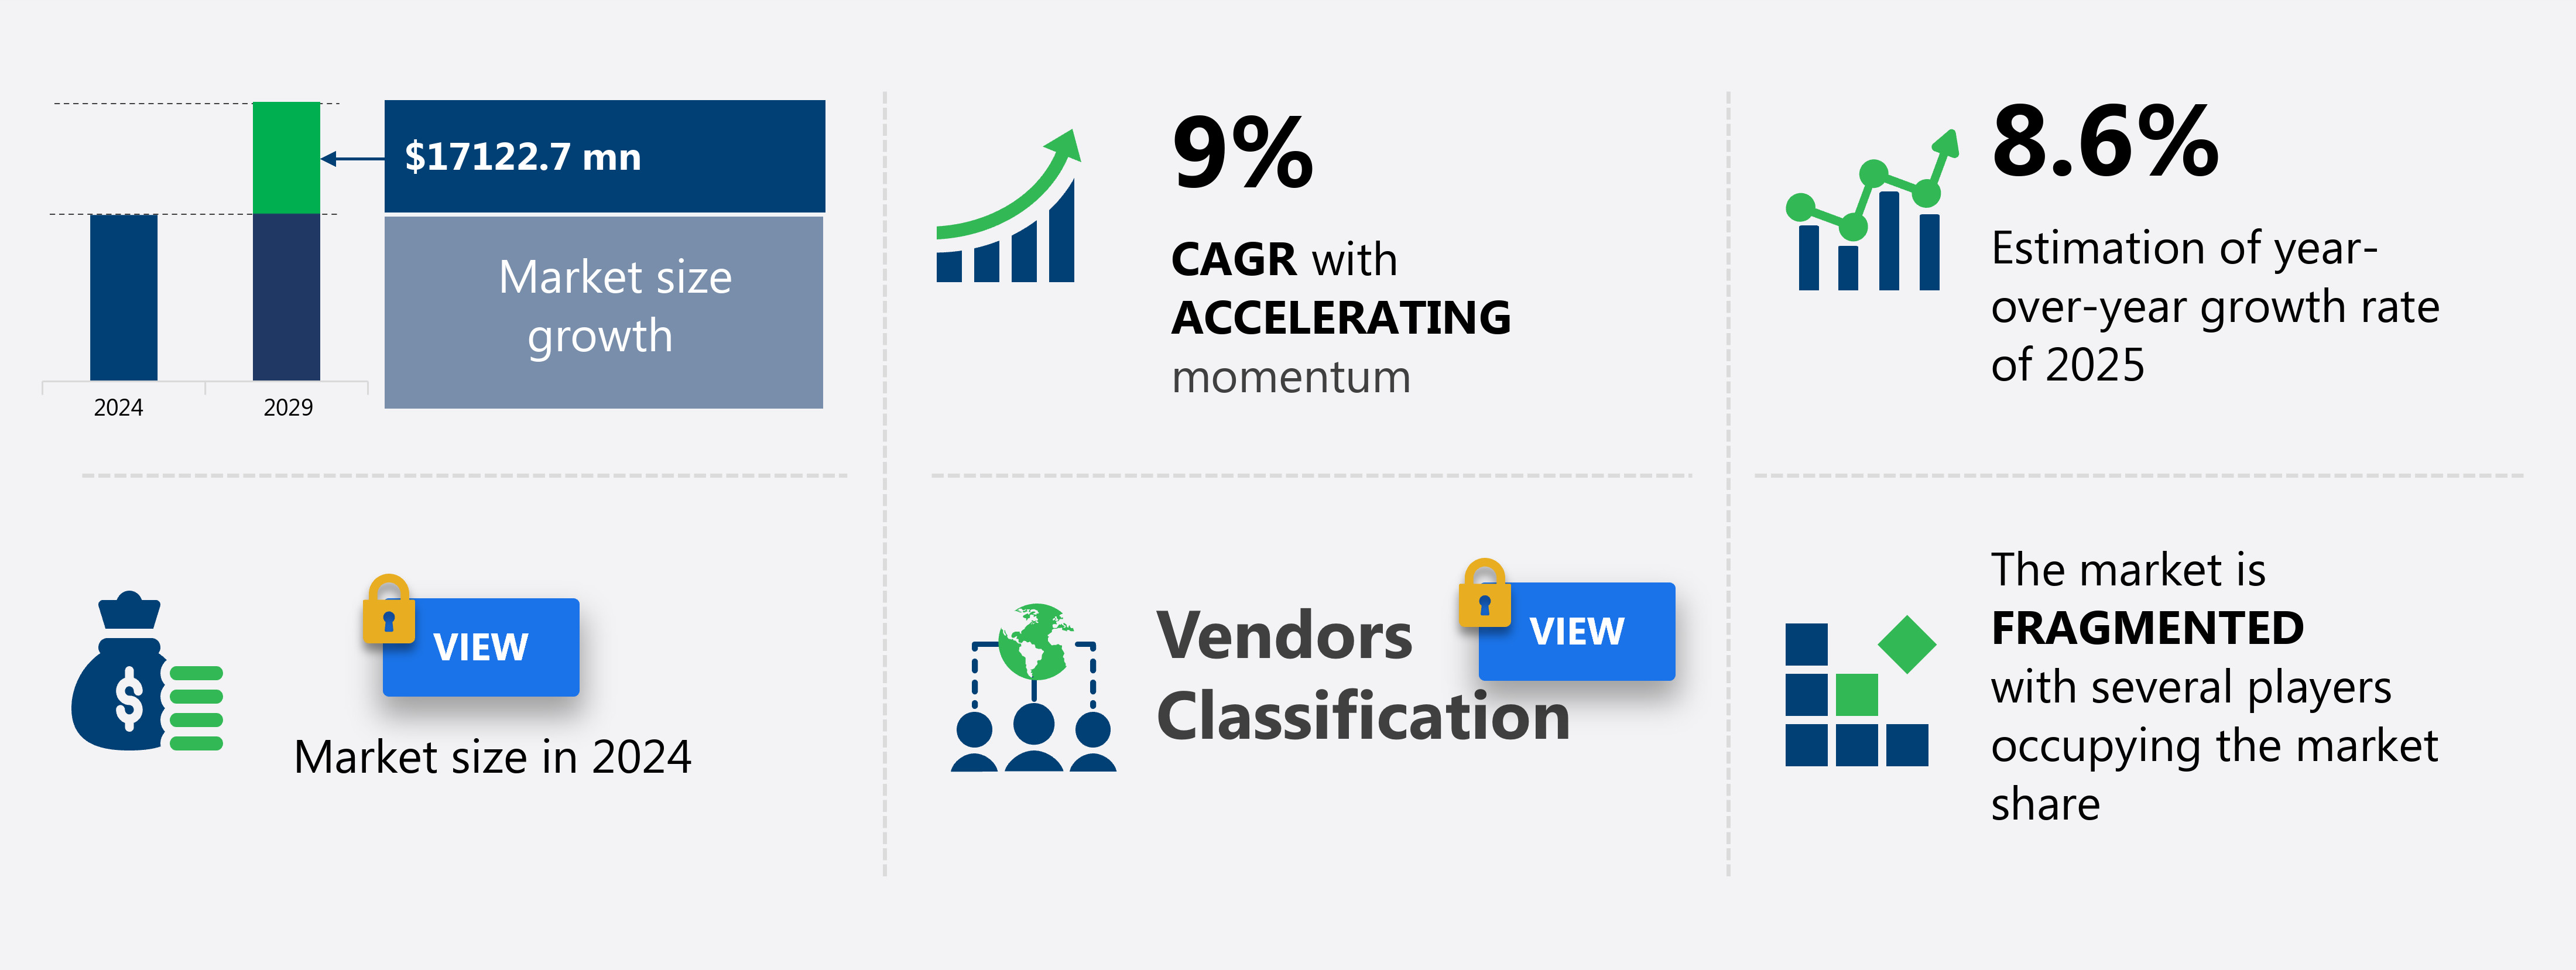
The third-party logistics market in India size is forecast to increase by USD 17.12 billion at a CAGR of 9% between 2024 and 2029.
- The third-party logistics (3PL) market in India is experiencing significant growth due to several key factors. One of the major drivers is the introduction of tax reforms and initiatives, such as the Goods and Services Tax (GST), which have streamlined the logistics industry and increased the demand for 3PL services. Another trend is the emergence of digitalization in third-party logistics, which is enabling more efficient and cost-effective operations. This can include the use of alternative fuels and transportation modes, such as electric vehicles and rail, as well as the implementation of circular supply chain models to reduce waste and improve resource efficiency. This market continues to expand due to increasing globalization, e-commerce growth, and the complexities of modern supply chains. However, high operational costs remain a challenge for 3PL providers in India, as they strive to maintain competitive pricing while delivering high-quality services to their clients. Overall, the Indian 3PL market is poised for continued growth, driven by these market trends and the increasing demand for logistics solutions in a rapidly developing economy.
What will be the Size of the market During the Forecast Period?
- The third-party logistics (3PL) market encompasses the outsourcing of logistical functions, including warehousing, transportation, and fulfillment, to specialized companies. 3PLs leverage advanced technologies and analytical techniques, such as DNA microarrays and gene assembly technologies, to optimize operations and improve efficiency. Error correction methods, including next-generation sequencing and PCR-based reactions, play a crucial role in ensuring accuracy and quality In the handling of goods.
- Additionally, large-scale gene synthesis and new chemistry advancements in enzymology are also driving innovation In the biotechnology sector, further expanding the scope of the 3PL market. The market is characterized by continuous advancements in gene synthesis technologies, oligonucleotide quality and quantity, and the use of plasmid vectors and gene constructs for gene assembly. Overall, the 3PL market is a dynamic and evolving industry that is essential for businesses seeking to streamline their logistics operations and stay competitive in today's global marketplace.
How is this market segmented and which is the largest segment?
The market research report provides comprehensive data (region-wise segment analysis), with forecasts and estimates in "USD billion" for the period 2025-2029, as well as historical data from 2019-2023 for the following segments.
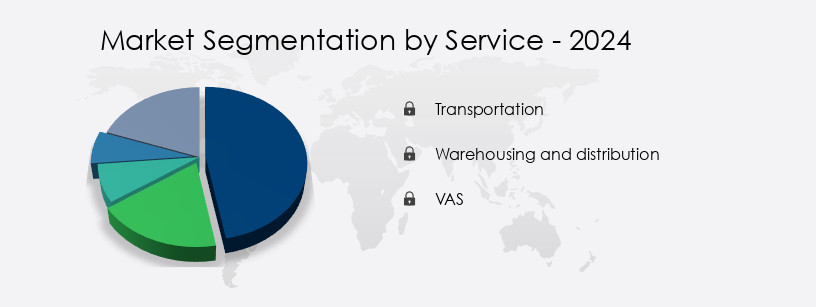
- Service
- Transportation
- Warehousing and distribution
- VAS
- End-user
- Manufacturing
- Consumer goods
- Food and beverage
- Automotive
- Others
- Mode Of Transportation
- Land transportation
- Sea transportation
- Air transportation
- Geography
- India
By Service Insights
- The transportation segment is estimated to witness significant growth during the forecast period.
The third-party logistics market involves the transportation and management of goods through various modes, including road, rail, air, and water. In India, a significant portion of logistics relies on road transport. Due to the high investment and expertise required, many companies opt for third-party logistics providers to manage their supply chain operations. However, the Indian logistics industry is characterized by the presence of both organized and unorganized operators. Unorganized operators, consisting of local truckers and drivers, dominate the market due to their cost advantage. Organized operators face intense competition from these intermediaries, who evade taxes and capitalize on price disparities across regions.
Gene technology applications in logistics include genetic networks, whole genomes, DNA, bacterial genome, cell, oligonucleotides, errors, deletions, insertions, base substitutions, DNA replication, prokaryotic and eukaryotic replication machineries, gene synthesis, enzymatic assembly, chemical synthesis, cloning, sequencing, error filtration, and analytical techniques. These technologies facilitate gene assembly through methods like PCR-based reactions, ligation, plasmid vector, gene construct, gene assembly, oligo quality, oligo quantity, PCR amplification, chip synthesis technology, polymerase chain assembly, LCR, SLIC, RED recombination, synthetic genes, protein production, structural characterization, codon optimization, gene regulation, and gene synthesis industry. Biosafety, biosecurity, dual-use technology, pathogens, and biological weapons are critical considerations In the gene synthesis industry, subject to export control regulations. Synthetic DNA, recombinant DNA, gene sequences, gene structure, gene expression, and gene function are essential aspects of gene synthesis. Enzymatic ligation and polymerase chain reaction are fundamental techniques in gene synthesis. DNA microchips are used for gene expression analysis and diagnostics.
Get a glance at the market report of share of various segments Request Free Sample
Market Dynamics
Our India Third-Party Logistics Market researchers analyzed the data with 2024 as the base year, along with the key drivers, trends, and challenges. A holistic analysis of drivers will help companies refine their marketing strategies to gain a competitive advantage.
What are the key market drivers leading to the rise in adoption of India Third-Party Logistics Market?
Introduction of tax reforms and initiatives for third-party logistics in India is the key driver of the market.
- The Third-Party Logistics (3PL) market in India is undergoing significant changes due to various reforms and initiatives. One of the most notable changes is the implementation of the Goods and Services Tax (GST), which has streamlined the logistics sector by reducing price differences between states and making tax liabilities uniform. Prior to GST, companies managed multiple warehouses in each state to avoid cross-border taxes, leading to an unorganized logistics sector and increased costs. Gene synthesis technologies, including error filtration techniques and analytical methods like DNA microarrays and gene assembly technologies, play a crucial role In the biotechnology industry. These methods enable the production of synthetic genes for protein production and structural characterization, utilizing various techniques such as enzymatic ligation, polymerase chain reaction (PCR), and ligase-mediated reactions (LCR, SLIC, RED recombination).
- Gene synthesis capabilities, including large-scale gene synthesis and new chemistry, are essential for gene expression, gene function research, and gene regulation. The industry faces challenges in ensuring oligo quality and quantity during PCR amplification and chip synthesis technology. Error correction methods and codon optimization are also essential to minimize errors, such as deletions, insertions, and base substitutions, during DNA replication in both prokaryotic and eukaryotic replication machineries. Biosafety and biosecurity concerns, including the potential use of gene synthesis capabilities for dual-use technology, such as biological weapons, have led to export control regulations. These regulations aim to prevent the misuse of synthetic DNA and recombinant DNA, ensuring the responsible use of gene sequences and gene structures for beneficial purposes.
- In summary, the market is undergoing significant changes due to tax reforms, while gene synthesis technologies continue to advance, enabling the production of synthetic genes for various applications In the biotechnology industry. The industry faces challenges in ensuring oligo quality, minimizing errors, and addressing biosafety and biosecurity concerns.
What are the market trends shaping the India Third-Party Logistics Market?
Emergence of digitalization in third-party logistics is the upcoming trend In the market.
- The Third-Party Logistics (3PL) market is witnessing significant advancements in technology, particularly In the area of genetic networks and genomic research. Companies are leveraging the power of Whole genomes, DNA, and bacterial genome sequences for various applications, including gene synthesis, enzymatic assembly, and chemical synthesis. Error filtration techniques are employed to minimize mistakes during DNA replication, such as Deletions, Insertions, and Base substitutions. Advancements in Prokaryotic and Eukaryotic replication machineries have led to the development of new Gene assembly technologies, Error correction methods, and Biotechnology techniques. Large-scale gene synthesis is a growing area of focus, with New chemistry and Enzymology playing crucial roles.
- Next-generation sequencing technologies and Gene synthesis technologies, such as PCR-based reactions, SCR, Ligation, and Plasmid vector use, are revolutionizing the industry. Chip synthesis technology, Polymerase chain assembly, LCR, SLIC, RED recombination, and Synthetic genes are some of the advanced techniques used for Protein production and Structural characterization. Codon optimization, Gene regulation, and Gene expression are essential aspects of Gene function research. The Gene synthesis industry is subject to stringent Biosafety and Biosecurity regulations due to the potential Dual-use technology implications. Export control regulations govern the production and distribution of Synthetic DNA, Recombinant DNA, and Gene sequences.
- Thus, the Third-Party Logistics market is experiencing a technological revolution, with a focus on genetic networks and genomic research. Companies are investing in advanced Gene synthesis technologies, Error filtration methods, and Biotechnology to drive innovation and efficiency. The industry is subject to stringent regulations due to the potential applications of this technology in areas like Pathogens and Biological weapons.
What challenges doesIndia Third-Party Logistics Market face during the growth?
High operational costs is a key challenge affecting the market growth.
- The Third-Party Logistics (3PL) market is a significant sector In the global supply chain industry, characterized by the use of advanced technologies and techniques in gene synthesis, enzymatic assembly, chemical synthesis, cloning, sequencing, and error filtration. Genetic networks and whole genomes, including bacterial genome, are decoded using analytical techniques such as DNA microarrays and gene assembly technologies. Error correction methods like SCR, Ligation, SLIC, RED recombination, and synthetic genes are employed to ensure accuracy in gene sequences and gene structure. The biotechnology industry's advancements in large-scale gene synthesis, new chemistry, enzymology, and next-generation sequencing have significantly impacted the 3PL market.
- Gene synthesis technologies, including PCR-based reactions, polymerase chain assembly, and ligation, are crucial in producing high-quality oligonucleotides for various applications. The production of proteins and their structural characterization are facilitated through codon optimization and gene regulation. The 3PL market faces various challenges, including biosafety and biosecurity concerns, dual-use technology risks, and export control regulations.
- In summary, pathogens and biological weapons pose potential threats, necessitating stringent gene synthesis capabilities and regulatory compliance. Ensuring oligo quality and oligo quantity during PCR amplification and chip synthesis technology is also essential. The 3PL market continues to evolve, driven by technological advancements and the growing demand for efficient and cost-effective logistics solutions.
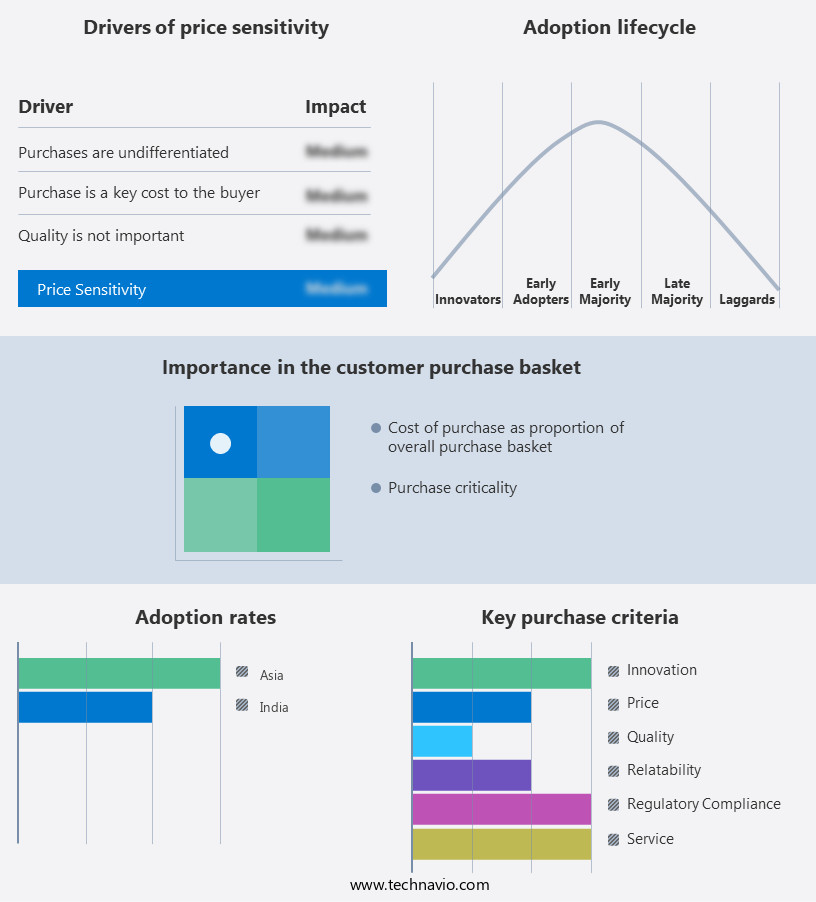
Exclusive Customer Landscape
The market forecasting report includes the adoption lifecycle of the market, covering from the innovator's stage to the laggard's stage. It focuses on adoption rates in different regions based on penetration. Furthermore, the market report also includes key purchase criteria and drivers of price sensitivity to help companies evaluate and develop their market growth analysis strategies.
Customer Landscape
Key Companies & Market Insights
Companies are implementing various strategies, such as strategic alliances, market forecast, partnerships, mergers and acquisitions, geographical expansion, and product/service launches, to enhance their presence In the market.
Aegis Logistics Ltd. - The company offers third-party logistics including gas logistics, to manage and optimize supply chain operations for businesses.
The market research and growth report includes detailed analyses of the competitive landscape of the market and information about key companies, including:
- Aegis Logistics Ltd.
- Allcargo Logistics Ltd.
- AP Moller Maersk AS
- ARK Supply Chain Solutions Pvt. Ltd.
- AWL India Pvt. Ltd.
- Blue Dart Express Ltd.
- Container Corp. of India Ltd.
- Delhivery Ltd.
- Deutsche Bahn AG
- FedEx Corp.
- Allcargo Gati Ltd.
- Mahindra Logistics Ltd.
- Meesan Logistics Pvt. Ltd.
- Pyramis Cargo Management Pvt. Ltd.
- Safexpress Pvt. Ltd.
- SICAL Logistics Ltd.
- TCI Express Ltd
- T V Sundram Iyengar and Sons Ltd.
- United Parcel Service Inc.
- VRL Logistics Ltd
Qualitative and quantitative analysis of companies has been conducted to help clients understand the wider business environment as well as the strengths and weaknesses of key market players. Data is qualitatively analyzed to categorize companies as pure play, category-focused, industry-focused, and diversified; it is quantitatively analyzed to categorize companies as dominant, leading, strong, tentative, and weak.
Research Analyst Overview
The third-party logistics (3PL) market encompasses a broad range of services that enable businesses to outsource their logistics operations. These services can include transportation management, warehousing, order fulfillment, and inventory management, among others. The 3PL market is driven by various factors, including the increasing complexity of global supply chains, the need for cost savings, and the growing demand for faster delivery times. One key trend In the 3PL market is the increasing adoption of technology to streamline operations and improve efficiency. This can include the use of automation and robotics in warehouses, real-time tracking and monitoring of shipments, and the implementation of electronic data interchange (EDI) systems to facilitate seamless communication between different parties In the supply chain.
Additionally, another trend is the growing importance of sustainability in logistics operations. The 3PL market is also influenced by various regulatory and compliance issues. For example, there are strict regulations governing the transportation of certain goods, such as hazardous materials, and failure to comply can result in significant fines and reputational damage. Additionally, there are increasing concerns around the security and biosecurity implications of certain logistics operations, particularly those involving the transportation of sensitive or dual-use technologies.
Thus, despite these challenges, the 3PL market is expected to continue growing In the coming years, driven by the increasing complexity of global supply chains and the need for businesses to focus on their core competencies. This is likely to lead to increased consolidation In the market, with larger players acquiring smaller players to expand their offerings and geographic reach. In summary, the third-party logistics market is a dynamic and complex industry that is driven by various trends and challenges. These include the adoption of technology to improve efficiency, the importance of sustainability, and the impact of regulatory and compliance issues. Despite these challenges, the market is expected to continue growing In the coming years, driven by the increasing complexity of global supply chains and the need for businesses to focus on their core competencies.
|
Market Scope |
|
|
Report Coverage |
Details |
|
Page number |
0 |
|
Base year |
2024 |
|
Historic period |
2019-2023 |
|
Forecast period |
2025-2029 |
|
Growth momentum & CAGR |
Accelerate at a CAGR of 9% |
|
Market growth 2025-2029 |
USD 17.12 billion |
|
Market structure |
Fragmented |
|
YoY growth 2024-2025(%) |
8.6 |
|
Key countries |
India and Asia |
|
Competitive landscape |
Leading Companies, Market Positioning of Companies, Competitive Strategies, and Industry Risks |
What are the Key Data Covered in this Market Research and Growth Report?
- CAGR of the market during the forecast period
- Detailed information on factors that will drive the market growth and forecasting between 2025 and 2029
- Precise estimation of the size of the market and its contribution of the market in focus to the parent market
- Accurate predictions about upcoming market growth and trends and changes in consumer behaviour
- Growth of the market across India
- Thorough analysis of the market's competitive landscape and detailed information about companies
- Comprehensive analysis of factors that will challenge the growth of market companies
We can help! Our analysts can customize this market research report to meet your requirements. Get in touch