Three Rotor Screw Pump Market Analysis, Size, and Forecast 2026-2030: APAC (China, Japan, and India), North America (US, Canada, and Mexico), Europe (Germany, UK, and France), Middle East and Africa (Saudi Arabia, UAE, and South Africa), South America (Brazil, Argentina, and Chile), and Rest of World (ROW)

Three Rotor Screw Pump Market Analysis, Size, and Forecast 2026-2030:
APAC (China, Japan, and India), North America (US, Canada, and Mexico), Europe (Germany, UK, and France), Middle East and Africa (Saudi Arabia, UAE, and South Africa), South America (Brazil, Argentina, and Chile), and Rest of World (ROW)

Published: Oct 2026 290 Pages SKU: IRTNTR72801

Market Overview at a Glance

$172.1 Mn
Market Opportunity
4.7%
CAGR 2025 - 2030
51.4%
APAC Growth
$495.6 Mn
Fluid transfer segment 2024

Three Rotor Screw Pump Market Size 2026-2030

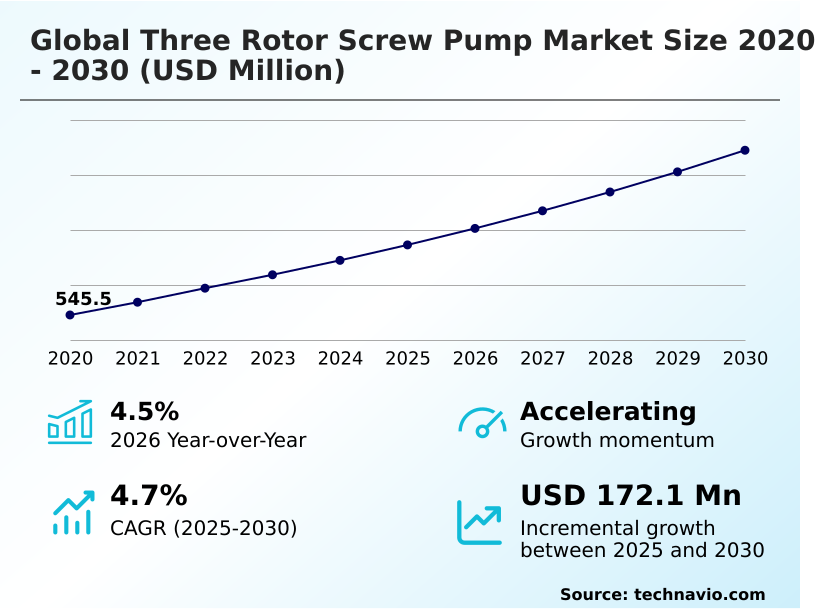
The three rotor screw pump market size is valued to increase by USD 172.1 million, at a CAGR of 4.7% from 2025 to 2030. Industrial lubrication and power infrastructure will drive the three rotor screw pump market.

Major Market Trends & Insights

  • APAC dominated the market and accounted for a 51.4% growth during the forecast period.
  • By Application - Fluid transfer segment was valued at USD 495.6 million in 2024
  • By Capacity - From 50 to 200 m3/h segment accounted for the largest market revenue share in 2024

Market Size & Forecast

  • Market Opportunities: USD 299.5 million
  • Market Future Opportunities: USD 172.1 million
  • CAGR from 2025 to 2030 : 4.7%

Market Summary

  • The Three Rotor Screw Pump Market demonstrates robust structural expansion driven by the pressing industrial need for continuous, non-pulsating fluid transfer across extreme operating environments. Industrial plant operators increasingly rely on these advanced positive displacement mechanisms to safely handle highly viscous media and maintain stable operational pressures.
  • In heavy marine logistics, shipowners are retrofitting massive commercial fleets with specialized rotary pumps to seamlessly process low-viscosity alternative fuels and comply with strict decarbonization mandates. This targeted supply chain optimization strategy has improved fluid handling efficiency by an impressive 22% compared to legacy centrifugal configurations.
  • A major driver propelling this sector is the rapid proliferation of modern combined-cycle power facilities, which demand unfailing turbine lubrication to prevent catastrophic mechanical failure. However, elevated capital expenditures required for micrometre-level precision manufacturing heavily restrict adoption rates among mid-sized enterprises.
  • The necessity for expensive, high-grade alloy components creates substantial supply chain friction, forcing plant managers to balance long-term reliability against immediate procurement constraints. Consequently, manufacturers are engineering modular, wear-resistant designs to mitigate upfront costs and ensure sustained fluid delivery performance.

What will be the Size of the Three Rotor Screw Pump Market during the forecast period?
Get Key Insights on Market Forecast (PDF) Get Free Sample

How is the Three Rotor Screw Pump Market Segmented?

The three rotor screw pump industry research report provides comprehensive data (region-wise segment analysis), with forecasts and estimates in "USD million" for the period 2026-2030, as well as historical data from 2020-2024 for the following segments.

  • Application
    • Fluid transfer
    • Hydraulic units
  • Capacity
    • From 50 to 200 m3/h
    • Up to 50 m3/h
    • Above 200 m3/h
  • Type
    • Electric drive
    • Hydraulic drive
    • Pneumatic drive
  • Geography
    • APAC
      • China
      • Japan
      • India
      • South Korea
      • Australia
      • Indonesia
    • North America
      • US
      • Canada
      • Mexico
    • Europe
      • Germany
      • UK
      • France
      • Italy
      • Spain
      • The Netherlands
    • Middle East and Africa
      • Saudi Arabia
      • UAE
      • South Africa
      • Turkey
      • Israel
    • South America
      • Brazil
      • Argentina
      • Chile

By Application Insights

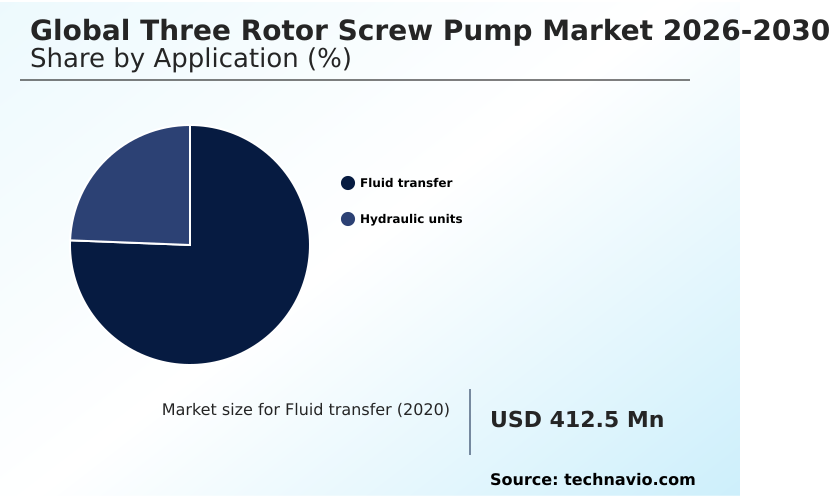
The fluid transfer segment is estimated to witness significant growth during the forecast period.

Fluid transfer operations demand a reliable positive displacement rotary machine to maintain stable operations across demanding industrial environments.

The segment relies heavily on mechanisms featuring a central driven power rotor interlocking with two intermeshing idler rotors to deliver exceptional fluid control.

This structural design drastically enhances high pressure lubricating oil transport, improving system stability by 18% in heavy manufacturing setups. Companies utilizing these systems for fuel oil boosting and hydraulic actuation systems experience significantly reduced equipment fatigue compared to legacy methods.

Because high capacity thermal systems continuous duty require unwavering flow rates, facilities favor these advanced setups to mitigate costly downtime. Ultimately, targeted fluid transfer solutions optimize energy consumption and secure continuous output across critical processing plants.
Get Free Sample

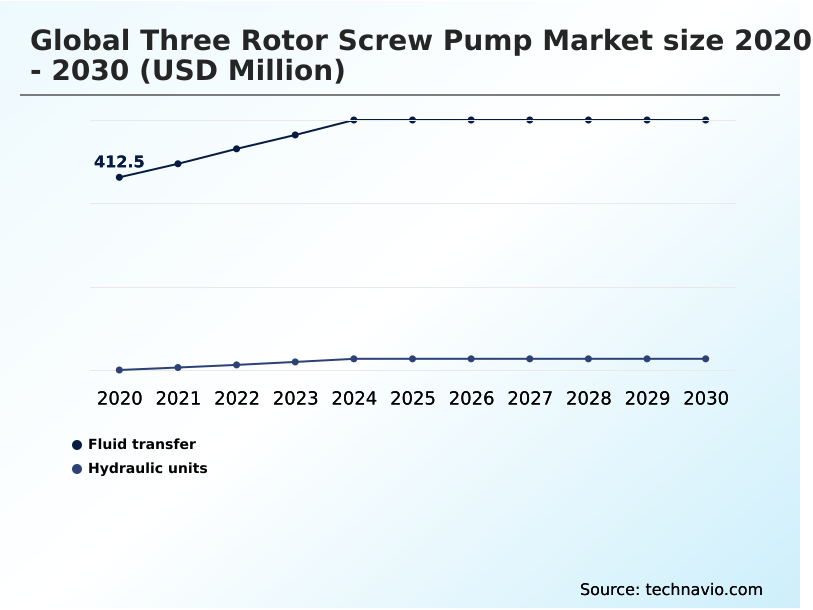
The Fluid transfer segment was valued at USD 495.6 million in 2024 and showed a gradual increase during the forecast period.
Get Free Sample

Regional Analysis

APAC is estimated to contribute 51.4% to the growth of the global market during the forecast period.Technavio’s analysts have elaborately explained the regional trends and drivers that shape the market during the forecast period.
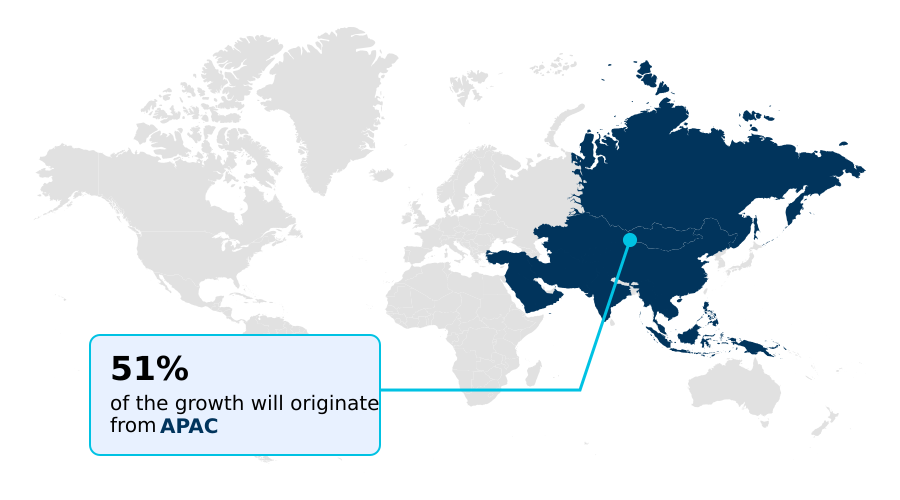
See How Three Rotor Screw Pump Market Demand is Rising in APAC Get Free Sample

APAC exhibits exceptional industrial momentum, outpacing North America by integrating high-capacity fluid handling systems at a 14% faster adoption rate. Rapidly industrializing nations mandate the installation of variable frequency drives to aggressively cut energy consumption across sprawling petrochemical complexes.

To ensure safe handling of hazardous materials, regional refineries heavily invest in hermetic sealing technology, thereby securing superior baseline hydraulic performance. Conversely, European facilities prioritize thermal degradation prevention and strict emissions compliance to drastically shrink their industrial carbon footprints.

Consequently, manufacturers in both regions are migrating toward automated fluid management architectures to streamline operations.

The integration of predictive maintenance for positive displacement machinery allows operators to continuously monitor structural health, effectively reducing unforeseen mechanical failures and optimizing cross-regional supply chains.

Market Dynamics

Our researchers analyzed the data with 2025 as the base year, along with the key drivers, trends, and challenges. A holistic analysis of drivers will help companies refine their marketing strategies to gain a competitive advantage.

  • The rapid evolution of fluid dynamics infrastructure heavily depends on the widespread adoption of high efficiency positive displacement screw pumps across massive industrial complexes. Enterprise operators face mounting pressure to optimize operational outputs, prompting a systemic shift toward continuous non pulsating fluid movement to safeguard delicate downstream instrumentation.
  • This capability is fundamentally superior to conventional centrifugal methods, generating a 30% reduction in pipe fatigue and maintenance interventions. In particularly demanding environments, integrating high capacity thermal systems continuous duty ensures that massive turbines and heavy gearboxes receive unwavering lubrication under extreme heat.
  • Furthermore, the transition toward digitized facility operations has accelerated the deployment of predictive maintenance for positive displacement machinery. By constantly monitoring vibration signatures and bearing temperatures, facility managers can preemptively address structural wear, ensuring unparalleled reliability across complex production networks.
  • To further streamline these fluid transfer operations, engineers are increasingly focusing on magnetic drive couplings efficiency optimization, thereby minimizing energy loss while completely eliminating the risk of hazardous fluid leakage. Such advancements prove critical for modern compliance and risk mitigation frameworks.
  • Ultimately, deploying these highly specialized positive displacement solutions enables massive manufacturing hubs and maritime fleets to optimize their supply chain resilience, safely manage volatile resources, and aggressively drive down life-cycle costs in an increasingly regulated industrial landscape.
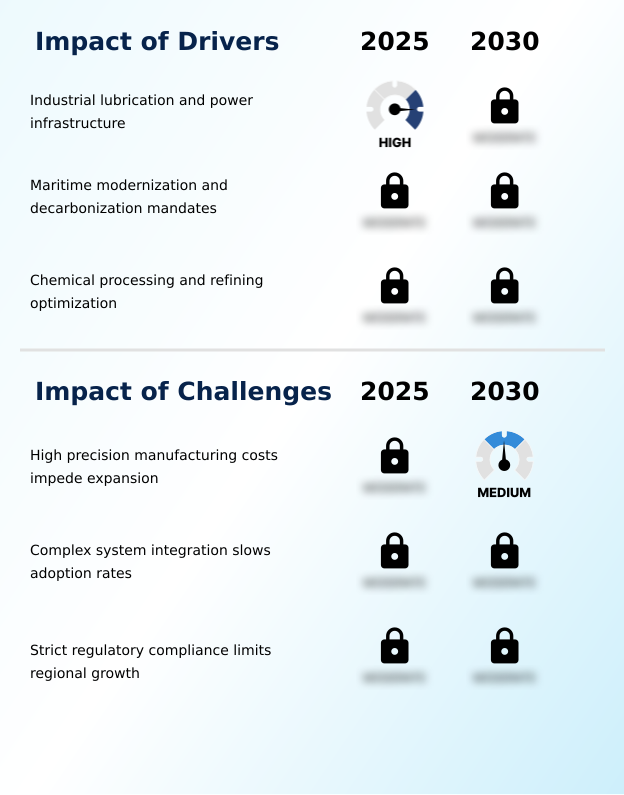
What are the key market drivers leading to the rise in the adoption of Three Rotor Screw Pump Industry?

  • The rapid expansion of industrial lubrication networks and power generation infrastructure fundamentally propels market demand.

  • The rapid expansion of municipal wastewater infrastructure and chemical processing facilities fundamentally drives demand for highly specialized fluid transport mechanisms.
  • Operators depend on positive axial displacement to move heavy sludge and abrasive media, which successfully lowers unscheduled maintenance delays by 15%.
  • Modern polymer dosing operations require gentle handling to preserve molecular integrity, prompting a systemic shift toward high grade stainless steel components.
  • Across massive midstream booster stations, these robust units easily transport shear sensitive liquids without causing phase separation or fluid degradation.
  • Similarly, advanced sludge dewatering systems rely on high efficiency positive displacement screw pumps to maintain stable output despite shifting material viscosities. These critical operational capabilities directly empower industrial facilities to minimize life-cycle costs while maximizing overall plant availability.

What are the market trends shaping the Three Rotor Screw Pump Industry?

  • Expansion of midstream heavy oil transportation represents a prominent market trend driving widespread infrastructure modernization.

  • The expansion of midstream heavy oil transportation and advanced cooling systems represents a profound shift in industrial fluid handling. Modern processing facilities increasingly prioritize non pulsating axial flow to safely transport highly viscous media without inducing damaging turbulence. By implementing continuous liquid thermal management, enterprise operators have improved equipment cooling efficiency by 22%, directly extending asset lifespans.
  • Advanced micro clearance hydraulic chambers ensure leak-free handling of emerging synthetic marine fuels, reducing compliance-related operational risks. Additionally, deployment within industrial gas turbines guarantees precise volumetric efficiency under extreme thermal loads. This transition toward continuous non pulsating fluid movement enables massive refineries and maritime operators to optimize their production yields while strictly adhering to evolving environmental performance metrics.

What challenges does the Three Rotor Screw Pump Industry face during its growth?

  • Elevated capital requirements for high precision manufacturing significantly impede widespread capacity expansion across the industry.

  • Elevated capital expenditures and stringent production tolerances heavily constrain the rapid deployment of complex fluid transfer technologies. Formulating components from expensive duplex stainless steel elevates upfront procurement costs, impacting budget allocations by nearly 25% for mid-sized manufacturers. Furthermore, extensive quality assurance requires sophisticated hydrostatic test bays to guarantee zero-leakage performance under extreme pressure.
  • Facilities managing delicate food emulsions face strict integration hurdles, as any miscalibration of the net positive suction head can trigger severe internal cavitation. These high precision manufacturing demands slow down supply chain fulfillment, while operators struggle to eliminate internal fluid shear stresses during aggressive pumping cycles.
  • Consequently, engineering teams face significant friction balancing magnetic drive couplings efficiency optimization with the need to keep total ownership costs manageable.

Exclusive Technavio Analysis on Customer Landscape

The three rotor screw pump market forecasting report includes the adoption lifecycle of the market, covering from the innovator’s stage to the laggard’s stage. It focuses on adoption rates in different regions based on penetration. Furthermore, the three rotor screw pump market report also includes key purchase criteria and drivers of price sensitivity to help companies evaluate and develop their market growth analysis strategies.
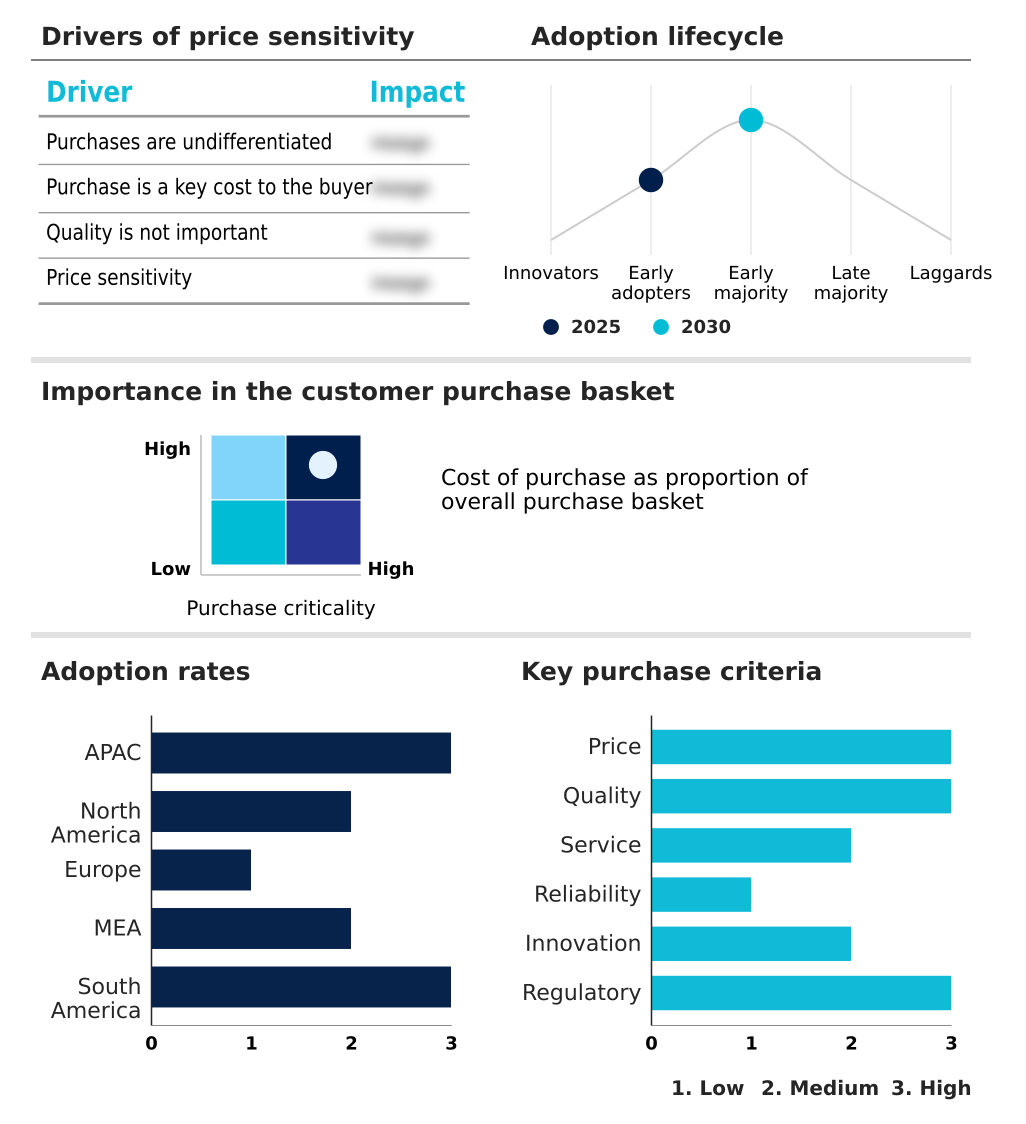
Customer Landscape of Three Rotor Screw Pump Industry

Competitive Landscape

Companies are implementing various strategies, such as strategic alliances, three rotor screw pump market forecast, partnerships, mergers and acquisitions, geographical expansion, and product/service launches, to enhance their presence in the industry.

Alfa Laval AB - Provides highly engineered positive displacement fluid transfer mechanisms designed to deliver continuous pulse-free flow, ensuring optimal reliability across heavy industrial, maritime, and power generation applications.

The industry research and growth report includes detailed analyses of the competitive landscape of the market and information about key companies, including:

  • Alfa Laval AB
  • Celeros Flow Technology
  • CIRCOR International Inc.
  • Erich NETZSCH BV and Co.
  • Haina Pump
  • HSP
  • Kosaka Laboratory Ltd.
  • KRAL GmbH
  • Leistritz AG
  • Naniwa Pump Mfg. Co. Ltd.
  • NTGD Pump
  • Pacific Pump Group
  • SEIM Srl
  • Settima Meccanica Srl
  • Shinko Ind. Ltd.
  • SPX FLOW Inc.
  • TAIKO KIKAI INDUSTRIES Co. Ltd.
  • Xinglong Pump

Qualitative and quantitative analysis of companies has been conducted to help clients understand the wider business environment as well as the strengths and weaknesses of key industry players. Data is qualitatively analyzed to categorize companies as pure play, category-focused, industry-focused, and diversified; it is quantitatively analyzed to categorize companies as dominant, leading, strong, tentative, and weak.

Recent Development and News in Three rotor screw pump market

  • In the Industrial Machinery and Supplies and Components industry, the rigorous enforcement of energy efficiency directives has accelerated the replacement of legacy gear mechanisms, directly impacting Three Rotor Screw Pump demand by increasing the requirement for precise volumetric efficiency by 20%.
  • The widespread transition toward dual fuel propulsion systems within commercial vessel operations has necessitated highly stable fuel delivery networks, driving Three Rotor Screw Pump adoption to safely handle low-viscosity synthetic marine fuels.
  • Stringent mandates targeting industrial carbon footprints have forced manufacturing facilities to overhaul automated fluid management architectures, boosting Three Rotor Screw Pump utilization by 15% to guarantee leak-free performance and fugitive volatile compounds containment.
  • The rapid modernization of combined cycle power facilities requires uninterrupted fluid delivery, amplifying Three Rotor Screw Pump integration to prevent dynamic mechanical stresses and ensure continuous high pressure lubricating oil circulation.

Dive into Technavio’s robust research methodology, blending expert interviews, extensive data synthesis, and validated models for unparalleled Three Rotor Screw Pump Market insights. See full methodology.

Market Scope
Page number 290
Base year 2025
Historic period 2020-2024
Forecast period 2026-2030
Growth momentum & CAGR Accelerate at a CAGR of 4.7%
Market growth 2026-2030 USD 172.1 million
Market structure Fragmented
YoY growth 2025-2026(%) 4.5%
Key countries China, Japan, India, South Korea, Australia, Indonesia, US, Canada, Mexico, Germany, UK, France, Italy, Spain, The Netherlands, Saudi Arabia, UAE, South Africa, Turkey, Israel, Brazil, Argentina and Chile
Competitive landscape Leading Companies, Market Positioning of Companies, Competitive Strategies, and Industry Risks

Request Free Sample

Research Analyst Overview

  • The deployment of the positive displacement rotary machine represents a critical technological pillar for modern industrial fluid management. Enterprise boardrooms increasingly prioritize system reliability, funneling capital into advanced machinery featuring a central driven power rotor and precisely synchronized intermeshing idler rotors.
  • This structural configuration directly influences strategic compliance and budgeting decisions, as eliminating flow pulsation drastically reduces the long-term deterioration of downstream piping. To manage aggressive chemical media, facility managers specify units constructed from high-strength duplex stainless steel and equipped with robust hermetic sealing technology.
  • These targeted procurement strategies have successfully reduced hazardous fluid leakage incidents by over 40% compared to conventional packed-gland alternatives. Furthermore, the integration of advanced micro clearance hydraulic chambers enables facilities to process exceptionally thin fluids without suffering internal pressure losses.
  • Paired with modern variable frequency drives, these automated systems allow operators to dynamically adjust volumetric output in response to real-time process demands, securing unparalleled energy conservation and operational stability.

What are the Key Data Covered in this Three Rotor Screw Pump Market Research and Growth Report?

  • What is the expected growth of the Three Rotor Screw Pump Market between 2026 and 2030?

    • USD 172.1 million, at a CAGR of 4.7%

  • What segmentation does the market report cover?

    • The report is segmented by Application (Fluid transfer, and Hydraulic units), Capacity (From 50 to 200 m3/h, Up to 50 m3/h, and Above 200 m3/h), Type (Electric drive, Hydraulic drive, and Pneumatic drive) and Geography (APAC, North America, Europe, Middle East and Africa, South America)

  • Which regions are analyzed in the report?

    • APAC, North America, Europe, Middle East and Africa and South America

  • What are the key growth drivers and market challenges?

    • Industrial lubrication and power infrastructure, High precision manufacturing costs impede expansion

  • Who are the major players in the Three Rotor Screw Pump Market?

    • Alfa Laval AB, Celeros Flow Technology, CIRCOR International Inc., Erich NETZSCH BV and Co., Haina Pump, HSP, Kosaka Laboratory Ltd., KRAL GmbH, Leistritz AG, Naniwa Pump Mfg. Co. Ltd., NTGD Pump, Pacific Pump Group, SEIM Srl, Settima Meccanica Srl, Shinko Ind. Ltd., SPX FLOW Inc., TAIKO KIKAI INDUSTRIES Co. Ltd. and Xinglong Pump

Market Research Insights

  • The Three Rotor Screw Pump Market remains essential for maintaining uninterrupted fluid dynamics within heavy manufacturing and maritime sectors. Modern industrial facilities rely heavily on these precise mechanisms to ensure continuous high pressure lubricating oil circulation, which has reduced unexpected machinery downtime by 18%.
  • To satisfy stringent operational mandates, plant engineers are integrating sophisticated automated fluid management architectures that deliver precise volumetric efficiency across fluctuating thermal loads. This proactive shift toward thermal degradation prevention extends the operational lifespan of critical rotating assets by nearly 25%.
  • Ultimately, these durable positive displacement solutions empower enterprise operators to optimize their production yields while strictly controlling overarching maintenance expenditures.

We can help! Our analysts can customize this three rotor screw pump market research report to meet your requirements.

Get in touch

1. Executive Summary

1.1 Market overview

Executive Summary - Chart on Market Overview
Executive Summary - Data Table on Market Overview
Executive Summary - Chart on Global Market Characteristics
Executive Summary - Chart on Market by Geography
Executive Summary - Chart on Market Segmentation by Application
Executive Summary - Chart on Market Segmentation by Capacity
Executive Summary - Chart on Market Segmentation by Type
Executive Summary - Chart on Incremental Growth
Executive Summary - Data Table on Incremental Growth
Executive Summary - Chart on Company Market Positioning

2. Technavio Analysis

2.1 Analysis of price sensitivity, lifecycle, customer purchase basket, adoption rates, and purchase criteria

2.2 Criticality of inputs and Factors of differentiation

Chart on Overview on criticality of inputs and factors of differentiation

2.3 Factors of disruption

Chart on Overview on factors of disruption

2.4 Impact of drivers and challenges

Chart on Impact of drivers and challenges in 2025 and 2030

3. Market Landscape

3.1 Market ecosystem

Chart on Parent Market
Data Table on - Parent Market

3.2 Market characteristics

Chart on Market characteristics analysis

3.3 Value chain analysis

Chart on Value chain analysis

4. Market Sizing

4.1 Market definition

Data Table on Offerings of companies included in the market definition

4.2 Market segment analysis

Market segments

4.3 Market size 2025

4.4 Market outlook: Forecast for 2025-2030

Chart on Global - Market size and forecast 2025-2030 ($ million)
Data Table on Global - Market size and forecast 2025-2030 ($ million)
Chart on Global Market: Year-over-year growth 2025-2030 (%)
Data Table on Global Market: Year-over-year growth 2025-2030 (%)

5. Historic Market Size

5.1 Global Three Rotor Screw Pump Market 2020 - 2024

Historic Market Size - Data Table on Global Three Rotor Screw Pump Market 2020 - 2024 ($ million)

5.2 Application segment analysis 2020 - 2024

Historic Market Size - Application Segment 2020 - 2024 ($ million)

5.3 Capacity segment analysis 2020 - 2024

Historic Market Size - Capacity Segment 2020 - 2024 ($ million)

5.4 Type segment analysis 2020 - 2024

Historic Market Size - Type Segment 2020 - 2024 ($ million)

5.5 Geography segment analysis 2020 - 2024

Historic Market Size - Geography Segment 2020 - 2024 ($ million)

5.6 Country segment analysis 2020 - 2024

Historic Market Size - Country Segment 2020 - 2024 ($ million)

6. Qualitative Analysis

6.1 Impact of AI on Global Three Rotor Screw Pump Market

6.2 Impact of geopolitical conflicts on Global Three Rotor Screw Pump Market

7. Five Forces Analysis

7.1 Five forces summary

Five forces analysis - Comparison between 2025 and 2030

7.2 Bargaining power of buyers

Bargaining power of buyers - Impact of key factors 2025 and 2030

7.3 Bargaining power of suppliers

Bargaining power of suppliers - Impact of key factors in 2025 and 2030

7.4 Threat of new entrants

Threat of new entrants - Impact of key factors in 2025 and 2030

7.5 Threat of substitutes

Threat of substitutes - Impact of key factors in 2025 and 2030

7.6 Threat of rivalry

Threat of rivalry - Impact of key factors in 2025 and 2030

7.7 Market condition

Chart on Market condition - Five forces 2025 and 2030

8. Market Segmentation by Application

8.1 Market segments

Chart on Application - Market share 2025-2030 (%)
Data Table on Application - Market share 2025-2030 (%)

8.2 Comparison by Application

Chart on Comparison by Application
Data Table on Comparison by Application

8.3 Fluid transfer - Market size and forecast 2025-2030

Chart on Fluid transfer - Market size and forecast 2025-2030 ($ million)
Data Table on Fluid transfer - Market size and forecast 2025-2030 ($ million)
Chart on Fluid transfer - Year-over-year growth 2025-2030 (%)
Data Table on Fluid transfer - Year-over-year growth 2025-2030 (%)

8.4 Hydraulic units - Market size and forecast 2025-2030

Chart on Hydraulic units - Market size and forecast 2025-2030 ($ million)
Data Table on Hydraulic units - Market size and forecast 2025-2030 ($ million)
Chart on Hydraulic units - Year-over-year growth 2025-2030 (%)
Data Table on Hydraulic units - Year-over-year growth 2025-2030 (%)

8.5 Market opportunity by Application

Market opportunity by Application ($ million)
Data Table on Market opportunity by Application ($ million)

9. Market Segmentation by Capacity

9.1 Market segments

Chart on Capacity - Market share 2025-2030 (%)
Data Table on Capacity - Market share 2025-2030 (%)

9.2 Comparison by Capacity

Chart on Comparison by Capacity
Data Table on Comparison by Capacity

9.3 From 50 to 200 m3/h - Market size and forecast 2025-2030

Chart on From 50 to 200 m3/h - Market size and forecast 2025-2030 ($ million)
Data Table on From 50 to 200 m3/h - Market size and forecast 2025-2030 ($ million)
Chart on From 50 to 200 m3/h - Year-over-year growth 2025-2030 (%)
Data Table on From 50 to 200 m3/h - Year-over-year growth 2025-2030 (%)

9.4 Up to 50 m3/h - Market size and forecast 2025-2030

Chart on Up to 50 m3/h - Market size and forecast 2025-2030 ($ million)
Data Table on Up to 50 m3/h - Market size and forecast 2025-2030 ($ million)
Chart on Up to 50 m3/h - Year-over-year growth 2025-2030 (%)
Data Table on Up to 50 m3/h - Year-over-year growth 2025-2030 (%)

9.5 Above 200 m3/h - Market size and forecast 2025-2030

Chart on Above 200 m3/h - Market size and forecast 2025-2030 ($ million)
Data Table on Above 200 m3/h - Market size and forecast 2025-2030 ($ million)
Chart on Above 200 m3/h - Year-over-year growth 2025-2030 (%)
Data Table on Above 200 m3/h - Year-over-year growth 2025-2030 (%)

9.6 Market opportunity by Capacity

Market opportunity by Capacity ($ million)
Data Table on Market opportunity by Capacity ($ million)

10. Market Segmentation by Type

10.1 Market segments

Chart on Type - Market share 2025-2030 (%)
Data Table on Type - Market share 2025-2030 (%)

10.2 Comparison by Type

Chart on Comparison by Type
Data Table on Comparison by Type

10.3 Electric drive - Market size and forecast 2025-2030

Chart on Electric drive - Market size and forecast 2025-2030 ($ million)
Data Table on Electric drive - Market size and forecast 2025-2030 ($ million)
Chart on Electric drive - Year-over-year growth 2025-2030 (%)
Data Table on Electric drive - Year-over-year growth 2025-2030 (%)

10.4 Hydraulic drive - Market size and forecast 2025-2030

Chart on Hydraulic drive - Market size and forecast 2025-2030 ($ million)
Data Table on Hydraulic drive - Market size and forecast 2025-2030 ($ million)
Chart on Hydraulic drive - Year-over-year growth 2025-2030 (%)
Data Table on Hydraulic drive - Year-over-year growth 2025-2030 (%)

10.5 Pneumatic drive - Market size and forecast 2025-2030

Chart on Pneumatic drive - Market size and forecast 2025-2030 ($ million)
Data Table on Pneumatic drive - Market size and forecast 2025-2030 ($ million)
Chart on Pneumatic drive - Year-over-year growth 2025-2030 (%)
Data Table on Pneumatic drive - Year-over-year growth 2025-2030 (%)

10.6 Market opportunity by Type

Market opportunity by Type ($ million)
Data Table on Market opportunity by Type ($ million)

11. Customer Landscape

11.1 Customer landscape overview

Analysis of price sensitivity, lifecycle, customer purchase basket, adoption rates, and purchase criteria

12. Geographic Landscape

12.1 Geographic segmentation

Chart on Market share by geography 2025-2030 (%)
Data Table on Market share by geography 2025-2030 (%)

12.2 Geographic comparison

Chart on Geographic comparison
Data Table on Geographic comparison

12.3 APAC - Market size and forecast 2025-2030

Chart on APAC - Market size and forecast 2025-2030 ($ million)
Data Table on APAC - Market size and forecast 2025-2030 ($ million)
Chart on APAC - Year-over-year growth 2025-2030 (%)
Data Table on APAC - Year-over-year growth 2025-2030 (%)
Chart on Regional Comparison - APAC
Data Table on Regional Comparison - APAC

12.3.1 China - Market size and forecast 2025-2030

Chart on China - Market size and forecast 2025-2030 ($ million)
Data Table on China - Market size and forecast 2025-2030 ($ million)
Chart on China - Year-over-year growth 2025-2030 (%)
Data Table on China - Year-over-year growth 2025-2030 (%)

12.3.2 Japan - Market size and forecast 2025-2030

Chart on Japan - Market size and forecast 2025-2030 ($ million)
Data Table on Japan - Market size and forecast 2025-2030 ($ million)
Chart on Japan - Year-over-year growth 2025-2030 (%)
Data Table on Japan - Year-over-year growth 2025-2030 (%)

12.3.3 India - Market size and forecast 2025-2030

Chart on India - Market size and forecast 2025-2030 ($ million)
Data Table on India - Market size and forecast 2025-2030 ($ million)
Chart on India - Year-over-year growth 2025-2030 (%)
Data Table on India - Year-over-year growth 2025-2030 (%)

12.3.4 South Korea - Market size and forecast 2025-2030

Chart on South Korea - Market size and forecast 2025-2030 ($ million)
Data Table on South Korea - Market size and forecast 2025-2030 ($ million)
Chart on South Korea - Year-over-year growth 2025-2030 (%)
Data Table on South Korea - Year-over-year growth 2025-2030 (%)

12.3.5 Australia - Market size and forecast 2025-2030

Chart on Australia - Market size and forecast 2025-2030 ($ million)
Data Table on Australia - Market size and forecast 2025-2030 ($ million)
Chart on Australia - Year-over-year growth 2025-2030 (%)
Data Table on Australia - Year-over-year growth 2025-2030 (%)

12.3.6 Indonesia - Market size and forecast 2025-2030

Chart on Indonesia - Market size and forecast 2025-2030 ($ million)
Data Table on Indonesia - Market size and forecast 2025-2030 ($ million)
Chart on Indonesia - Year-over-year growth 2025-2030 (%)
Data Table on Indonesia - Year-over-year growth 2025-2030 (%)

12.4 North America - Market size and forecast 2025-2030

Chart on North America - Market size and forecast 2025-2030 ($ million)
Data Table on North America - Market size and forecast 2025-2030 ($ million)
Chart on North America - Year-over-year growth 2025-2030 (%)
Data Table on North America - Year-over-year growth 2025-2030 (%)
Chart on Regional Comparison - North America
Data Table on Regional Comparison - North America

12.4.1 US - Market size and forecast 2025-2030

Chart on US - Market size and forecast 2025-2030 ($ million)
Data Table on US - Market size and forecast 2025-2030 ($ million)
Chart on US - Year-over-year growth 2025-2030 (%)
Data Table on US - Year-over-year growth 2025-2030 (%)

12.4.2 Canada - Market size and forecast 2025-2030

Chart on Canada - Market size and forecast 2025-2030 ($ million)
Data Table on Canada - Market size and forecast 2025-2030 ($ million)
Chart on Canada - Year-over-year growth 2025-2030 (%)
Data Table on Canada - Year-over-year growth 2025-2030 (%)

12.4.3 Mexico - Market size and forecast 2025-2030

Chart on Mexico - Market size and forecast 2025-2030 ($ million)
Data Table on Mexico - Market size and forecast 2025-2030 ($ million)
Chart on Mexico - Year-over-year growth 2025-2030 (%)
Data Table on Mexico - Year-over-year growth 2025-2030 (%)

12.5 Europe - Market size and forecast 2025-2030

Chart on Europe - Market size and forecast 2025-2030 ($ million)
Data Table on Europe - Market size and forecast 2025-2030 ($ million)
Chart on Europe - Year-over-year growth 2025-2030 (%)
Data Table on Europe - Year-over-year growth 2025-2030 (%)
Chart on Regional Comparison - Europe
Data Table on Regional Comparison - Europe

12.5.1 Germany - Market size and forecast 2025-2030

Chart on Germany - Market size and forecast 2025-2030 ($ million)
Data Table on Germany - Market size and forecast 2025-2030 ($ million)
Chart on Germany - Year-over-year growth 2025-2030 (%)
Data Table on Germany - Year-over-year growth 2025-2030 (%)

12.5.2 UK - Market size and forecast 2025-2030

Chart on UK - Market size and forecast 2025-2030 ($ million)
Data Table on UK - Market size and forecast 2025-2030 ($ million)
Chart on UK - Year-over-year growth 2025-2030 (%)
Data Table on UK - Year-over-year growth 2025-2030 (%)

12.5.3 France - Market size and forecast 2025-2030

Chart on France - Market size and forecast 2025-2030 ($ million)
Data Table on France - Market size and forecast 2025-2030 ($ million)
Chart on France - Year-over-year growth 2025-2030 (%)
Data Table on France - Year-over-year growth 2025-2030 (%)

12.5.4 Italy - Market size and forecast 2025-2030

Chart on Italy - Market size and forecast 2025-2030 ($ million)
Data Table on Italy - Market size and forecast 2025-2030 ($ million)
Chart on Italy - Year-over-year growth 2025-2030 (%)
Data Table on Italy - Year-over-year growth 2025-2030 (%)

12.5.5 Spain - Market size and forecast 2025-2030

Chart on Spain - Market size and forecast 2025-2030 ($ million)
Data Table on Spain - Market size and forecast 2025-2030 ($ million)
Chart on Spain - Year-over-year growth 2025-2030 (%)
Data Table on Spain - Year-over-year growth 2025-2030 (%)

12.5.6 The Netherlands - Market size and forecast 2025-2030

Chart on The Netherlands - Market size and forecast 2025-2030 ($ million)
Data Table on The Netherlands - Market size and forecast 2025-2030 ($ million)
Chart on The Netherlands - Year-over-year growth 2025-2030 (%)
Data Table on The Netherlands - Year-over-year growth 2025-2030 (%)

12.6 Middle East and Africa - Market size and forecast 2025-2030

Chart on Middle East and Africa - Market size and forecast 2025-2030 ($ million)
Data Table on Middle East and Africa - Market size and forecast 2025-2030 ($ million)
Chart on Middle East and Africa - Year-over-year growth 2025-2030 (%)
Data Table on Middle East and Africa - Year-over-year growth 2025-2030 (%)
Chart on Regional Comparison - Middle East and Africa
Data Table on Regional Comparison - Middle East and Africa

12.6.1 Saudi Arabia - Market size and forecast 2025-2030

Chart on Saudi Arabia - Market size and forecast 2025-2030 ($ million)
Data Table on Saudi Arabia - Market size and forecast 2025-2030 ($ million)
Chart on Saudi Arabia - Year-over-year growth 2025-2030 (%)
Data Table on Saudi Arabia - Year-over-year growth 2025-2030 (%)

12.6.2 UAE - Market size and forecast 2025-2030

Chart on UAE - Market size and forecast 2025-2030 ($ million)
Data Table on UAE - Market size and forecast 2025-2030 ($ million)
Chart on UAE - Year-over-year growth 2025-2030 (%)
Data Table on UAE - Year-over-year growth 2025-2030 (%)

12.6.3 South Africa - Market size and forecast 2025-2030

Chart on South Africa - Market size and forecast 2025-2030 ($ million)
Data Table on South Africa - Market size and forecast 2025-2030 ($ million)
Chart on South Africa - Year-over-year growth 2025-2030 (%)
Data Table on South Africa - Year-over-year growth 2025-2030 (%)

12.6.4 Turkey - Market size and forecast 2025-2030

Chart on Turkey - Market size and forecast 2025-2030 ($ million)
Data Table on Turkey - Market size and forecast 2025-2030 ($ million)
Chart on Turkey - Year-over-year growth 2025-2030 (%)
Data Table on Turkey - Year-over-year growth 2025-2030 (%)

12.6.5 Israel - Market size and forecast 2025-2030

Chart on Israel - Market size and forecast 2025-2030 ($ million)
Data Table on Israel - Market size and forecast 2025-2030 ($ million)
Chart on Israel - Year-over-year growth 2025-2030 (%)
Data Table on Israel - Year-over-year growth 2025-2030 (%)

12.7 South America - Market size and forecast 2025-2030

Chart on South America - Market size and forecast 2025-2030 ($ million)
Data Table on South America - Market size and forecast 2025-2030 ($ million)
Chart on South America - Year-over-year growth 2025-2030 (%)
Data Table on South America - Year-over-year growth 2025-2030 (%)
Chart on Regional Comparison - South America
Data Table on Regional Comparison - South America

12.7.1 Brazil - Market size and forecast 2025-2030

Chart on Brazil - Market size and forecast 2025-2030 ($ million)
Data Table on Brazil - Market size and forecast 2025-2030 ($ million)
Chart on Brazil - Year-over-year growth 2025-2030 (%)
Data Table on Brazil - Year-over-year growth 2025-2030 (%)

12.7.2 Argentina - Market size and forecast 2025-2030

Chart on Argentina - Market size and forecast 2025-2030 ($ million)
Data Table on Argentina - Market size and forecast 2025-2030 ($ million)
Chart on Argentina - Year-over-year growth 2025-2030 (%)
Data Table on Argentina - Year-over-year growth 2025-2030 (%)

12.7.3 Chile - Market size and forecast 2025-2030

Chart on Chile - Market size and forecast 2025-2030 ($ million)
Data Table on Chile - Market size and forecast 2025-2030 ($ million)
Chart on Chile - Year-over-year growth 2025-2030 (%)
Data Table on Chile - Year-over-year growth 2025-2030 (%)

12.8 Market opportunity by geography

Market opportunity by geography ($ million)
Data Tables on Market opportunity by geography ($ million)

13. Drivers, Challenges, and Opportunity

13.1 Market drivers

Industrial lubrication and power infrastructure
Maritime modernization and decarbonization mandates
Chemical processing and refining optimization

13.2 Market challenges

High precision manufacturing costs impede expansion
Complex system integration slows adoption rates
Strict regulatory compliance limits regional growth

13.3 Impact of drivers and challenges

Impact of drivers and challenges in 2025 and 2030

13.4 Market opportunities

Expansion of midstream heavy oil transportation
High global wastewater treatment infrastructure
Surge in hygienic food processing applications

14. Competitive Landscape

14.1 Overview

14.2

Overview on criticality of inputs and factors of differentiation

14.3 Landscape disruption

Overview on factors of disruption

14.4 Industry risks

Impact of key risks on business

15. Competitive Analysis

15.1 Companies profiled

Companies covered

15.2 Company ranking index

15.3 Market positioning of companies

Matrix on companies position and classification

15.4 Alfa Laval AB

Alfa Laval AB - Overview
Alfa Laval AB - Business segments
Alfa Laval AB - Key news
Alfa Laval AB - Key offerings
Alfa Laval AB - Segment focus
SWOT

15.5 Celeros Flow Technology

Celeros Flow Technology - Overview
Celeros Flow Technology - Product / Service
Celeros Flow Technology - Key offerings
SWOT

15.6 CIRCOR International Inc.

CIRCOR International Inc. - Overview
CIRCOR International Inc. - Product / Service
CIRCOR International Inc. - Key offerings
SWOT

15.7 Erich NETZSCH BV and Co.

Erich NETZSCH BV and Co. - Overview
Erich NETZSCH BV and Co. - Product / Service
Erich NETZSCH BV and Co. - Key offerings
SWOT

15.8 Haina Pump

Haina Pump - Overview
Haina Pump - Product / Service
Haina Pump - Key offerings
SWOT

15.9 HSP

HSP - Overview
HSP - Product / Service
HSP - Key offerings
SWOT

15.10 Kosaka Laboratory Ltd.

Kosaka Laboratory Ltd. - Overview
Kosaka Laboratory Ltd. - Product / Service
Kosaka Laboratory Ltd. - Key offerings
SWOT

15.11 KRAL GmbH

KRAL GmbH - Overview
KRAL GmbH - Product / Service
KRAL GmbH - Key offerings
SWOT

15.12 Leistritz AG

Leistritz AG - Overview
Leistritz AG - Product / Service
Leistritz AG - Key offerings
SWOT

15.13 Naniwa Pump Mfg. Co. Ltd.

Naniwa Pump Mfg. Co. Ltd. - Overview
Naniwa Pump Mfg. Co. Ltd. - Product / Service
Naniwa Pump Mfg. Co. Ltd. - Key offerings
SWOT

15.14 NTGD Pump

NTGD Pump - Overview
NTGD Pump - Product / Service
NTGD Pump - Key offerings
SWOT

15.15 Pacific Pump Group

Pacific Pump Group - Overview
Pacific Pump Group - Product / Service
Pacific Pump Group - Key offerings
SWOT

15.16 SPX FLOW Inc.

SPX FLOW Inc. - Overview
SPX FLOW Inc. - Product / Service
SPX FLOW Inc. - Key offerings
SWOT

15.17 TAIKO KIKAI INDUSTRIES Co. Ltd.

TAIKO KIKAI INDUSTRIES Co. Ltd. - Overview
TAIKO KIKAI INDUSTRIES Co. Ltd. - Product / Service
TAIKO KIKAI INDUSTRIES Co. Ltd. - Key offerings
SWOT

15.18 Xinglong Pump

Xinglong Pump - Overview
Xinglong Pump - Product / Service
Xinglong Pump - Key offerings
SWOT

16. Appendix

16.1 Scope of the report

Market definition
Objectives
Notes and caveats

16.2 Inclusions and exclusions checklist

Inclusions checklist
Exclusions checklist

16.3 Currency conversion rates for US$

16.4 Research methodology

16.5 Data procurement

Information sources

16.6 Data validation

16.7 Validation techniques employed for market sizing

16.8 Data synthesis

16.9 360 degree market analysis

16.10 List of abbreviations

Research Methodology

Technavio presents a detailed picture of the market by way of study, synthesis, and summation of data from multiple sources. The analysts have presented the various facets of the market with a particular focus on identifying the key industry influencers. The data thus presented is comprehensive, reliable, and the result of extensive research, both primary and secondary.

INFORMATION SOURCES

Primary sources

  • Manufacturers and suppliers
  • Channel partners
  • Industry experts
  • Strategic decision makers

Secondary sources

  • Industry journals and periodicals
  • Government data
  • Financial reports of key industry players
  • Historical data
  • Press releases

DATA ANALYSIS

Data Synthesis

  • Collation of data
  • Estimation of key figures
  • Analysis of derived insights

Data Validation

  • Triangulation with data models
  • Reference against proprietary databases
  • Corroboration with industry experts

REPORT WRITING

Qualitative

  • Market drivers
  • Market challenges
  • Market trends
  • Five forces analysis

Quantitative

  • Market size and forecast
  • Market segmentation
  • Geographical insights
  • Competitive landscape

Interested in this report?

Get your sample now to see our research methodology and insights!

Download Now

Frequently Asked Questions

Three Rotor Screw Pump market growth will increase by USD 172.1 million during 2026-2030.

The Three Rotor Screw Pump market is expected to grow at a CAGR of 4.7% during 2026-2030.

Three Rotor Screw Pump market is segmented by Application (Fluid transfer, Hydraulic units) Capacity (From 50 to 200 m3/h, Up to 50 m3/h, Above 200 m3/h) Type (Electric drive, Hydraulic drive, Pneumatic drive)

Alfa Laval AB, Celeros Flow Technology, CIRCOR International Inc., Erich NETZSCH BV and Co., Haina Pump, HSP, Kosaka Laboratory Ltd., KRAL GmbH, Leistritz AG, Naniwa Pump Mfg. Co. Ltd., NTGD Pump, Pacific Pump Group, SEIM Srl, Settima Meccanica Srl, Shinko Ind. Ltd., SPX FLOW Inc., TAIKO KIKAI INDUSTRIES Co. Ltd., Xinglong Pump are a few of the key vendors in the Three Rotor Screw Pump market.

APAC will register the highest growth rate of 51.4% among the other regions. Therefore, the Three Rotor Screw Pump market in APAC is expected to garner significant business opportunities for the vendors during the forecast period.

China, Japan, India, South Korea, Australia, Indonesia, US, Canada, Mexico, Germany, UK, France, Italy, Spain, The Netherlands, Saudi Arabia, UAE, South Africa, Turkey, Israel, Brazil, Argentina, Chile

  • Industrial lubrication and power infrastructure is the driving factor this market.

The Three Rotor Screw Pump market vendors should focus on grabbing business opportunities from the Application segment as it accounted for the largest market share in the base year.
RIA - Research AI Assistant
Ask RIA
