Tilt Sensor Market Analysis APAC, Europe, North America, South America, Middle East and Africa - US, China, Germany, Japan, UK - Size and Forecast 2024-2028

Tilt Sensor Market Analysis APAC, Europe, North America, South America, Middle East and Africa - US, China, Germany, Japan, UK - Size and Forecast 2024-2028

Published: Oct 2024 151 Pages SKU: IRTNTR46613

Market Overview at a Glance

$56.4 Mn
Market Opportunity
5%
CAGR
4.8
YoY growth 2023-2024(%)

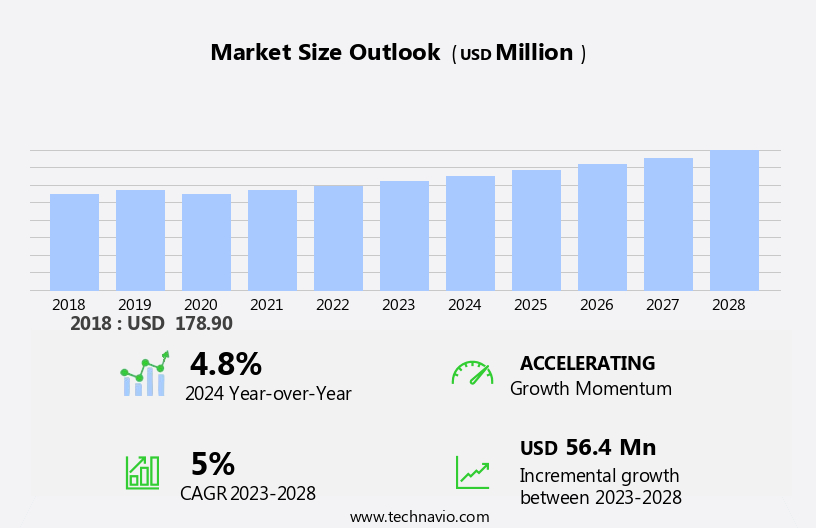
Tilt Sensor Market Size 2024-2028

The tilt sensor market size is forecast to increase by USD 56.4 million at a CAGR of 5% between 2023 and 2028.

  • Tilt sensors, a crucial component in various industries, are experiencing significant growth due to their increasing application in the automotive and aerospace sectors. MEMS (Micro-Electro-Mechanical Systems) and Tunnel Magnetoresistance (TMR) technologies are driving this trend, offering enhanced accuracy and reliability. Tilt sensors find extensive use in automotive applications, such as image stabilization for advanced driver assistance systems and motion detection for airbag deployment. In aerospace, they ensure safety in aircraft and spacecraft by monitoring tilt angles and maintaining stability. Additionally, these are increasingly used in industrial sectors for machine tool control, robotics, and crane safety systems. TMR sensors, with their high sensitivity and immunity to magnetic interference, are particularly favored.
  • These are also gaining popularity in niche applications like tilt-shift photography and smartphone sensors for motion detection and gaming experiences. Tilt sensors have also found applications in gaming and entertainment industries, enabling great experiences in virtual reality and augmented reality applications. 

What will be the Size of the Tilt Sensor Market During the Forecast Period?

Tilt Sensor Market Size

 Request Free Sample

  • Tilt sensors, a crucial component of various industries and applications, have gained significant traction in recent years due to their ability to detect changes in angular position. These sensors play a vital role in ensuring reliable operation in various sectors, including construction, automotive, aerospace, and consumer electronics. The market has witnessed steady growth, driven by the increasing demand for smart devices, home automation, and IoT applications. These are essential components in wearables, enabling features such as activity tracking and fall detection. In-home automation, tilt sensors are used for leveling and horizontal alignment in various appliances and systems.
  • Micro-electro-mechanical systems (MEMS) and force balance technology are the two primary technologies used in tilt sensors. MEMS technology offers advantages such as small size, low power consumption, and high accuracy. Force balance technology, on the other hand, offers high sensitivity and low hysteresis. This find extensive applications In the construction industry for structural monitoring systems, ensuring the safety and stability of buildings and infrastructure. In the mining sector, it is used for monitoring the angle of dump trucks and other mobile machinery, optimizing efficiency and reducing wear and tear. In the aerospace and defense industry, tilt sensors are used for attitude and heading reference systems, ensuring the stability and control of aircraft and spacecraft.

How is this Tilt Sensor Industry segmented and which is the largest segment?

The tilt sensor industry research report provides comprehensive data (region-wise segment analysis), with forecasts and estimates in "USD million" for the period 2024-2028, as well as historical data from 2018-2022 for the following segments.

  • End-user
    • Mining and construction industry
    • Automotive and transportation industry
    • Aerospace and defense industry
    • Telecommunications industry
    • Others
  • Geography
    • APAC
      • China
      • Japan
    • Europe
      • Germany
      • UK
    • North America
      • US
    • South America
    • Middle East and Africa

By End-user Insights

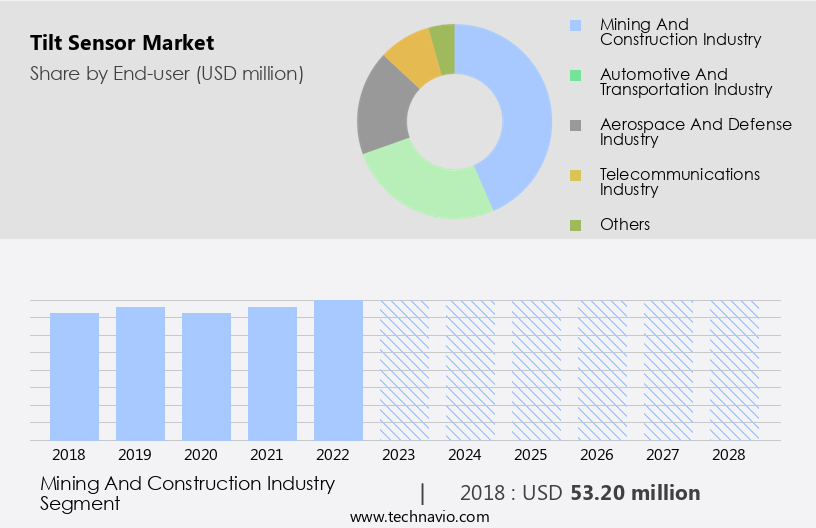
  • The mining and construction industry segment is estimated to witness significant growth during the forecast period.

In the market, the mining and construction industry sector held the largest share in 2023. Tilt sensors play a significant role in this industry due to their extensive applications in mining and construction machinery and equipment. These sensors are utilized in various machines such as drill machines, stationary and mobile cranes, and for structural monitoring systems. In construction environments, where the production of combustible dust occurs,  it is like vehicle inclinometers are employed to determine the crane's tilt angle to ensure the crane complies with necessary safety certifications. Beyond the mining and construction industry, tilt sensors also find extensive usage in other sectors, including automotive and aerospace applications, industrial sectors, image stabilization for tilt-shift photography, smartphone sensors, motion detection, and gaming experiences.

For instance, in automotive applications, these are used for airbag deployment and stability control systems. In aerospace applications, they are employed for attitude and heading reference systems. In the industrial sector, it is used for level sensing and machine monitoring. In image stabilization for tilt-shift photography, tilt sensors help maintain the image's stability during the shooting process. In smartphone sensors, this enables various functionalities such as auto-rotation and motion detection. In gaming experiences, tilt sensors offer enhanced immersion by allowing users to control game movements based on the device's tilt. Canon, a leading company In the imaging industry, holds a patent for a tilt sensor used in image stabilization systems.

Tilt Sensor Market Size

Get a glance at the  Tilt Sensor Industry report of share of various segments Request Free Sample

The Mining and construction industry segment was valued at USD 53.20 million in 2018 and showed a gradual increase during the forecast period.

Regional Analysis

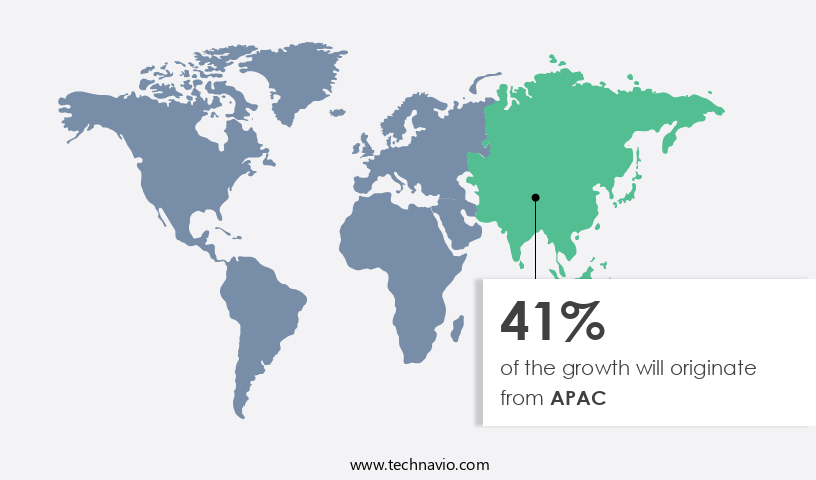
  • APAC is estimated to contribute 41% to the growth of the global market during the forecast period.

Technavio's analysts have elaborately explained the regional trends and drivers that shape the market during the forecast period.

Tilt Sensor Market Share by Geography

For more insights on the market share of various regions, Request Free Sample

The APAC region held the largest share of the market in 2023, driven by the expanding construction industry In the area. Factors such as urbanization, infrastructure development, and the rise of affordable housing projects are fueling this growth. China, being the most populous country In the world and boasting a strong economy, is the largest construction market in APAC. The region's market is anticipated to continue its leading position throughout the forecast period, with significant contributions from countries like China, Japan, India, Vietnam, South Korea, Malaysia, and Australia. In the automotive and transportation sector, tilt sensors employ Force Balance Technology for improved stability and safety in vehicles.

Additionally, the market finds applications in mining, structural monitoring systems, aerospace and defense, telecommunications, and both metal and nonmetal industries.

Market Dynamics

Our researchers analyzed the data with 2023 as the base year, along with the key drivers, trends, and challenges. A holistic analysis of drivers will help companies refine their marketing strategies to gain a competitive advantage.

What are the key market drivers leading to the rise In the adoption of Tilt Sensor Industry?

The growing adoption in industrial sectors is the key driver of the market.

  • Tilt sensors, which detect angular position and provide leveling information, have witnessed significant growth in various industries due to their increasing applications. These sensors, often filled with fluid for enhanced stability, have evolved from primarily being used for safety parameters such as measuring vehicle reaction and boom angles in mobile machinery, to enhancing driver comfort and ensuring horizontal and vertical alignment in aerospace, telecommunication, gaming, agricultural, and precision sensor applications.
  • The shift from analog to digital technology and the implementation of stringent regulations have expanded the integration in diverse sectors. With the focus on reliable operation, these are essential for ensuring safety and efficiency in numerous industries.

What are the market trends shaping the Tilt Sensor Industry?

New safety regulations about tilt sensors and MEWPs is the upcoming market trend.

  • Tilt sensors play a crucial role in various industries, including heating systems and consumer electronics. These sensors, which measure the degree of tilt or incline, are essential components in applications such as solar radiation sensors. Global solar radiation and reflected solar radiation are two types of solar radiation measurements that rely. Heating systems use to optimize energy efficiency by adjusting the angle of solar panels based on the sun's position. In the realm of consumer electronics, these are used in smart devices, wearables, and home automation systems. Micro-electro-mechanical systems (MEMS) technology is commonly used to manufacture these sensors due to their small size and high accuracy.
  • The Internet of Things (IoT) revolution has further increased the demand, as they enable the collection and analysis of data in real time. MEWPs, which include bucket lifts, scissor lifts, boom lifts, and vehicle-mounted boom buckets, will now be the universal term for this equipment, replacing Aerial Work Platform (AWP). This update aligns North American manufacturers more closely with global markets in Australia, Europe, and China.

What challenges does the Tilt Sensor Industry face during its growth?

The downturn in the mining industry is a key challenge affecting the industry growth.

  • The market is currently facing challenges due to the decline In the mining industry, particularly in Asia, specifically China. The decreasing demand for mining activities and the subsequent reduction in investments and new projects, primarily in Australia, are significant factors contributing to this market downturn. Furthermore, the strengthening US dollar has led to a decrease in greenfield and brownfield investments In the mining sector. Consequently, the closure of mines in various countries is resulting in a decrease in demand, thereby impeding market growth. Autonomous Control systems, Tip-over Protection, Platform Leveling, Electronic Parking Brakes, Roll Over Detection, and Electronic Stability Control are crucial applications in the transportation industry. The increasing adoption of these safety features in autonomous vehicles and the growing Semiconductor Market are expected to drive the market's growth In the long term.
  • However, the current market dynamics in the mining industry pose a significant challenge. The market's growth is also influenced by the Safety Management Systems in various industries, including construction and manufacturing. These systems rely on tilt sensors to ensure platform leveling and prevent tip-overs. The increasing focus on safety regulations and compliance is expected to drive the demand for tilt sensors in these industries.

Exclusive Customer Landscape

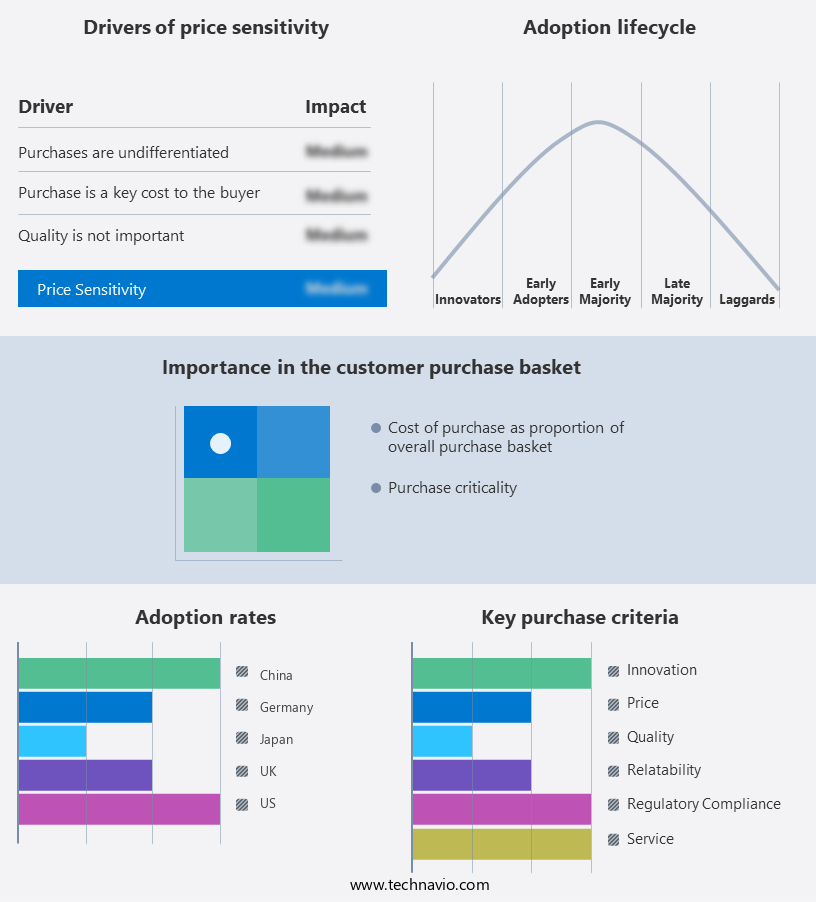
The market forecasting report includes the adoption lifecycle of the market, covering from the innovator's stage to the laggard's stage. It focuses on adoption rates in different regions based on penetration. Furthermore, the tilt sensor market report also includes key purchase criteria and drivers of price sensitivity to help companies evaluate and develop their market growth analysis strategies.

Tilt Sensor Market Share by Geography

 Customer Landscape

Key Companies & Market Insights

Companies are implementing various strategies, such as strategic alliances, tilt sensor market forecast, partnerships, mergers and acquisitions, geographical expansion, and product/service launches, to enhance their presence In the industry.

The industry research and growth report includes detailed analyses of the competitive landscape of the market and information about key companies, including:

  • ALTHEN GmbH
  • Balluff GmbH
  • Baumer Holding AG
  • Digipas Technologies Inc.
  • ELGO ELECTRONIC GmbH and Co. KG
  • ifm electronic gmbh
  • Jewell Instruments LLC
  • MP-SENSOR GmbH
  • OMRON Corp.
  • Pepperl and Fuchs SE
  • Rotero Holding
  • SICK AG
  • SignalQuest LLC
  • STG Germany GmbH
  • TE Connectivity Ltd.
  • TEKBOX DIGITAL SOLUTIONS
  • TSM SENSORS SRL
  • TURCK India Automation Pvt. Ltd.
  • WIKA Alexander Wiegand SE and Co. KG
  • WYLER AG

Qualitative and quantitative analysis of companies has been conducted to help clients understand the wider business environment as well as the strengths and weaknesses of key industry players. Data is qualitatively analyzed to categorize companies as pure play, category-focused, industry-focused, and diversified; it is quantitatively analyzed to categorize companies as dominant, leading, strong, tentative, and weak.

Research Analyst Overview

Tilt sensors, a type of angular position detection device, have gained significant traction in various industries due to their ability to measure the angle or orientation of an object. These sensors play a crucial role in various applications, including consumer electronics, IoT-enabled smart devices, wearables, home automation, robotics, navigation systems, and industrial automation. In the renewable energy sector, tilt sensors are used in solar panels to optimize energy generation by tracking global solar radiation and reflected solar radiation. Micro-electro-mechanical systems (MEMS) and tunnel magnetoresistance (TMR) technologies are commonly used in manufacturing tilt sensors. These sensors find extensive applications in automotive and aerospace industries for force balance technology and precision tilt sensors.

Moreover, in the automotive sector, tilt sensors are used for tip-over protection, platform leveling, electronic parking brakes, roll over detection, and electronic stability control. In the industrial sector, tilt sensors are used for structural monitoring systems, mining, and precision sensors for autonomous control in agricultural machinery. Tilt sensors are also used in image stabilization for cameras, tilt-shift photography, and gaming experiences. The semiconductor market is expected to grow due to the increasing demand for reliable tilt sensors in various applications, including safety management systems and autonomous vehicles. The market for tilt sensors is diverse, with applications ranging from consumer electronics to industrial automation and aerospace and defense. Both metal and nonmetal tilt sensors, as well as fluid-filled and solid-state technologies, are used to cater to the varying requirements of different applications.

Market Scope

Report Coverage

Details

Page number

151

Base year

2023

Historic period

2018-2022

Forecast period

2024-2028

Growth momentum & CAGR

Accelerate at a CAGR of 5%

Market Growth 2024-2028

USD 56.4 million

Market structure

Fragmented

YoY growth 2023-2024(%)

4.8

Key countries

US, China, Germany, Japan, and UK

Competitive landscape

Leading Companies, Market Positioning of Companies, Competitive Strategies, and Industry Risks

Request Free Sample

What are the Key Data Covered in this Tilt Sensor Market Research and Growth Report?

  • CAGR of the Tilt Sensor industry during the forecast period
  • Detailed information on factors that will drive the market growth and forecasting between 2024 and 2028
  • Precise estimation of the size of the market and its contribution of the industry in focus to the parent market
  • Accurate predictions about upcoming growth and trends and changes in consumer behaviour
  • Growth of the market across APAC, Europe, North America, South America, and Middle East and Africa
  • Thorough analysis of the market's competitive landscape and detailed information about companies
  • Comprehensive analysis of factors that will challenge the tilt sensor market growth of industry companies

We can help! Our analysts can customize this tilt sensor market research report to meet your requirements.

Get in touch

1 Executive Summary

  • 1.1 Market overview
    • Executive Summary - Chart on Market Overview
    • Executive Summary - Data Table on Market Overview
    • Executive Summary - Chart on Global Market Characteristics
    • Executive Summary - Chart on Market by Geography
    • Executive Summary - Chart on Market Segmentation by End-user
    • Executive Summary - Chart on Incremental Growth
    • Executive Summary - Data Table on Incremental Growth
    • Executive Summary - Chart on Company Market Positioning

2 Market Landscape

  • 2.1 Market ecosystem
    • Parent Market
    • Data Table on - Parent Market
  • 2.2 Market characteristics
    • Market characteristics analysis
  • 2.3 Value chain analysis
    • Value Chain Analysis

3 Market Sizing

  • 3.1 Market definition
    • Offerings of companies included in the market definition
  • 3.2 Market segment analysis
    • Market segments
  • 3.3 Market size 2023
    • 3.4 Market outlook: Forecast for 2023-2028
      • Chart on Global - Market size and forecast 2023-2028 ($ million)
      • Data Table on Global - Market size and forecast 2023-2028 ($ million)
      • Chart on Global Market: Year-over-year growth 2023-2028 (%)
      • Data Table on Global Market: Year-over-year growth 2023-2028 (%)

    4 Historic Market Size

    • 4.1 Global Tilt Sensor Market 2018 - 2022
      • Historic Market Size - Data Table on Global Tilt Sensor Market 2018 - 2022 ($ million)
    • 4.2 End-user segment analysis 2018 - 2022
      • Historic Market Size - End-user Segment 2018 - 2022 ($ million)
    • 4.3 Geography segment analysis 2018 - 2022
      • Historic Market Size - Geography Segment 2018 - 2022 ($ million)
    • 4.4 Country segment analysis 2018 - 2022
      • Historic Market Size - Country Segment 2018 - 2022 ($ million)

    5 Five Forces Analysis

    • 5.1 Five forces summary
      • Five forces analysis - Comparison between 2023 and 2028
    • 5.2 Bargaining power of buyers
      • Bargaining power of buyers - Impact of key factors 2023 and 2028
    • 5.3 Bargaining power of suppliers
      • Bargaining power of suppliers - Impact of key factors in 2023 and 2028
    • 5.4 Threat of new entrants
      • Threat of new entrants - Impact of key factors in 2023 and 2028
    • 5.5 Threat of substitutes
      • Threat of substitutes - Impact of key factors in 2023 and 2028
    • 5.6 Threat of rivalry
      • Threat of rivalry - Impact of key factors in 2023 and 2028
    • 5.7 Market condition
      • Chart on Market condition - Five forces 2023 and 2028

    6 Market Segmentation by End-user

    • 6.1 Market segments
      • Chart on End-user - Market share 2023-2028 (%)
      • Data Table on End-user - Market share 2023-2028 (%)
    • 6.2 Comparison by End-user
      • Chart on Comparison by End-user
      • Data Table on Comparison by End-user
    • 6.3 Mining and construction industry - Market size and forecast 2023-2028
      • Chart on Mining and construction industry - Market size and forecast 2023-2028 ($ million)
      • Data Table on Mining and construction industry - Market size and forecast 2023-2028 ($ million)
      • Chart on Mining and construction industry - Year-over-year growth 2023-2028 (%)
      • Data Table on Mining and construction industry - Year-over-year growth 2023-2028 (%)
    • 6.4 Automotive and transportation industry - Market size and forecast 2023-2028
      • Chart on Automotive and transportation industry - Market size and forecast 2023-2028 ($ million)
      • Data Table on Automotive and transportation industry - Market size and forecast 2023-2028 ($ million)
      • Chart on Automotive and transportation industry - Year-over-year growth 2023-2028 (%)
      • Data Table on Automotive and transportation industry - Year-over-year growth 2023-2028 (%)
    • 6.5 Aerospace and defense industry - Market size and forecast 2023-2028
      • Chart on Aerospace and defense industry - Market size and forecast 2023-2028 ($ million)
      • Data Table on Aerospace and defense industry - Market size and forecast 2023-2028 ($ million)
      • Chart on Aerospace and defense industry - Year-over-year growth 2023-2028 (%)
      • Data Table on Aerospace and defense industry - Year-over-year growth 2023-2028 (%)
    • 6.6 Telecommunications industry - Market size and forecast 2023-2028
      • Chart on Telecommunications industry - Market size and forecast 2023-2028 ($ million)
      • Data Table on Telecommunications industry - Market size and forecast 2023-2028 ($ million)
      • Chart on Telecommunications industry - Year-over-year growth 2023-2028 (%)
      • Data Table on Telecommunications industry - Year-over-year growth 2023-2028 (%)
    • 6.7 Others - Market size and forecast 2023-2028
      • Chart on Others - Market size and forecast 2023-2028 ($ million)
      • Data Table on Others - Market size and forecast 2023-2028 ($ million)
      • Chart on Others - Year-over-year growth 2023-2028 (%)
      • Data Table on Others - Year-over-year growth 2023-2028 (%)
    • 6.8 Market opportunity by End-user
      • Market opportunity by End-user ($ million)
      • Data Table on Market opportunity by End-user ($ million)

    7 Customer Landscape

    • 7.1 Customer landscape overview
      • Analysis of price sensitivity, lifecycle, customer purchase basket, adoption rates, and purchase criteria

    8 Geographic Landscape

    • 8.1 Geographic segmentation
      • Chart on Market share by geography 2023-2028 (%)
      • Data Table on Market share by geography 2023-2028 (%)
    • 8.2 Geographic comparison
      • Chart on Geographic comparison
      • Data Table on Geographic comparison
    • 8.3 APAC - Market size and forecast 2023-2028
      • Chart on APAC - Market size and forecast 2023-2028 ($ million)
      • Data Table on APAC - Market size and forecast 2023-2028 ($ million)
      • Chart on APAC - Year-over-year growth 2023-2028 (%)
      • Data Table on APAC - Year-over-year growth 2023-2028 (%)
    • 8.4 Europe - Market size and forecast 2023-2028
      • Chart on Europe - Market size and forecast 2023-2028 ($ million)
      • Data Table on Europe - Market size and forecast 2023-2028 ($ million)
      • Chart on Europe - Year-over-year growth 2023-2028 (%)
      • Data Table on Europe - Year-over-year growth 2023-2028 (%)
    • 8.5 North America - Market size and forecast 2023-2028
      • Chart on North America - Market size and forecast 2023-2028 ($ million)
      • Data Table on North America - Market size and forecast 2023-2028 ($ million)
      • Chart on North America - Year-over-year growth 2023-2028 (%)
      • Data Table on North America - Year-over-year growth 2023-2028 (%)
    • 8.6 South America - Market size and forecast 2023-2028
      • Chart on South America - Market size and forecast 2023-2028 ($ million)
      • Data Table on South America - Market size and forecast 2023-2028 ($ million)
      • Chart on South America - Year-over-year growth 2023-2028 (%)
      • Data Table on South America - Year-over-year growth 2023-2028 (%)
    • 8.7 Middle East and Africa - Market size and forecast 2023-2028
      • Chart on Middle East and Africa - Market size and forecast 2023-2028 ($ million)
      • Data Table on Middle East and Africa - Market size and forecast 2023-2028 ($ million)
      • Chart on Middle East and Africa - Year-over-year growth 2023-2028 (%)
      • Data Table on Middle East and Africa - Year-over-year growth 2023-2028 (%)
    • 8.8 US - Market size and forecast 2023-2028
      • Chart on US - Market size and forecast 2023-2028 ($ million)
      • Data Table on US - Market size and forecast 2023-2028 ($ million)
      • Chart on US - Year-over-year growth 2023-2028 (%)
      • Data Table on US - Year-over-year growth 2023-2028 (%)
    • 8.9 China - Market size and forecast 2023-2028
      • Chart on China - Market size and forecast 2023-2028 ($ million)
      • Data Table on China - Market size and forecast 2023-2028 ($ million)
      • Chart on China - Year-over-year growth 2023-2028 (%)
      • Data Table on China - Year-over-year growth 2023-2028 (%)
    • 8.10 Germany - Market size and forecast 2023-2028
      • Chart on Germany - Market size and forecast 2023-2028 ($ million)
      • Data Table on Germany - Market size and forecast 2023-2028 ($ million)
      • Chart on Germany - Year-over-year growth 2023-2028 (%)
      • Data Table on Germany - Year-over-year growth 2023-2028 (%)
    • 8.11 Japan - Market size and forecast 2023-2028
      • Chart on Japan - Market size and forecast 2023-2028 ($ million)
      • Data Table on Japan - Market size and forecast 2023-2028 ($ million)
      • Chart on Japan - Year-over-year growth 2023-2028 (%)
      • Data Table on Japan - Year-over-year growth 2023-2028 (%)
    • 8.12 UK - Market size and forecast 2023-2028
      • Chart on UK - Market size and forecast 2023-2028 ($ million)
      • Data Table on UK - Market size and forecast 2023-2028 ($ million)
      • Chart on UK - Year-over-year growth 2023-2028 (%)
      • Data Table on UK - Year-over-year growth 2023-2028 (%)
    • 8.13 Market opportunity by geography
      • Market opportunity by geography ($ million)
      • Data Tables on Market opportunity by geography ($ million)

    9 Drivers, Challenges, and Opportunity/Restraints

    • 9.1 Market drivers
      • 9.2 Market challenges
        • 9.3 Impact of drivers and challenges
          • Impact of drivers and challenges in 2023 and 2028
        • 9.4 Market opportunities/restraints

          10 Competitive Landscape

          • 10.1 Overview
            • 10.2 Competitive Landscape
              • Overview on criticality of inputs and factors of differentiation
            • 10.3 Landscape disruption
              • Overview on factors of disruption
            • 10.4 Industry risks
              • Impact of key risks on business

            11 Competitive Analysis

            • 11.1 Companies profiled
              • Companies covered
            • 11.2 Market positioning of companies
              • Matrix on companies position and classification
            • 11.3 ALTHEN GmbH
              • ALTHEN GmbH - Overview
              • ALTHEN GmbH - Product / Service
              • ALTHEN GmbH - Key offerings
            • 11.4 Balluff GmbH
              • Balluff GmbH - Overview
              • Balluff GmbH - Product / Service
              • Balluff GmbH - Key offerings
            • 11.5 Baumer Holding AG
              • Baumer Holding AG - Overview
              • Baumer Holding AG - Product / Service
              • Baumer Holding AG - Key offerings
            • 11.6 ifm electronic gmbh
              • ifm electronic gmbh - Overview
              • ifm electronic gmbh - Product / Service
              • ifm electronic gmbh - Key offerings
            • 11.7 Pepperl and Fuchs SE
              • Pepperl and Fuchs SE - Overview
              • Pepperl and Fuchs SE - Product / Service
              • Pepperl and Fuchs SE - Key offerings
            • 11.8 Rotero Holding
              • Rotero Holding - Overview
              • Rotero Holding - Product / Service
              • Rotero Holding - Key offerings
            • 11.9 SICK AG
              • SICK AG - Overview
              • SICK AG - Product / Service
              • SICK AG - Key news
              • SICK AG - Key offerings
            • 11.10 TE Connectivity Ltd.
              • TE Connectivity Ltd. - Overview
              • TE Connectivity Ltd. - Business segments
              • TE Connectivity Ltd. - Key news
              • TE Connectivity Ltd. - Key offerings
              • TE Connectivity Ltd. - Segment focus
            • 11.11 TURCK India Automation Pvt. Ltd.
              • TURCK India Automation Pvt. Ltd. - Overview
              • TURCK India Automation Pvt. Ltd. - Product / Service
              • TURCK India Automation Pvt. Ltd. - Key offerings
            • 11.12 WIKA Alexander Wiegand SE and Co. KG
              • WIKA Alexander Wiegand SE and Co. KG - Overview
              • WIKA Alexander Wiegand SE and Co. KG - Product / Service
              • WIKA Alexander Wiegand SE and Co. KG - Key offerings

            12 Appendix

            • 12.1 Scope of the report
              • 12.2 Inclusions and exclusions checklist
                • Inclusions checklist
                • Exclusions checklist
              • 12.3 Currency conversion rates for US$
                • Currency conversion rates for US$
              • 12.4 Research methodology
                • Research methodology
              • 12.5 Data procurement
                • Information sources
              • 12.6 Data validation
                • Data validation
              • 12.7 Validation techniques employed for market sizing
                • Validation techniques employed for market sizing
              • 12.8 Data synthesis
                • Data synthesis
              • 12.9 360 degree market analysis
                • 360 degree market analysis
              • 12.10 List of abbreviations
                • List of abbreviations

              Research Methodology

              Technavio presents a detailed picture of the market by way of study, synthesis, and summation of data from multiple sources. The analysts have presented the various facets of the market with a particular focus on identifying the key industry influencers. The data thus presented is comprehensive, reliable, and the result of extensive research, both primary and secondary.

              INFORMATION SOURCES

              Primary sources

              • Manufacturers and suppliers
              • Channel partners
              • Industry experts
              • Strategic decision makers

              Secondary sources

              • Industry journals and periodicals
              • Government data
              • Financial reports of key industry players
              • Historical data
              • Press releases

              DATA ANALYSIS

              Data Synthesis

              • Collation of data
              • Estimation of key figures
              • Analysis of derived insights

              Data Validation

              • Triangulation with data models
              • Reference against proprietary databases
              • Corroboration with industry experts

              REPORT WRITING

              Qualitative

              • Market drivers
              • Market challenges
              • Market trends
              • Five forces analysis

              Quantitative

              • Market size and forecast
              • Market segmentation
              • Geographical insights
              • Competitive landscape

              Interested in this report?

              Get your sample now to see our research methodology and insights!

              Download Now

              Frequently Asked Questions

              Tilt Sensor market growth will increase by $ 56.4 mn during 2024-2028.

              The Tilt Sensor market is expected to grow at a CAGR of 5% during 2024-2028.

              Tilt Sensor market is segmented by End-user( Mining and construction industry, Automotive and transportation industry, Aerospace and defense industry, Telecommunications industry, Others) Geographic( APAC, Europe, North America, South America, MEA)

              ALTHEN GmbH, Balluff GmbH, Baumer Holding AG, Digipas Technologies Inc., ELGO ELECTRONIC GmbH and Co. KG, ifm electronic gmbh, Jewell Instruments LLC, MP-SENSOR GmbH, OMRON Corp., Pepperl and Fuchs SE, Rotero Holding, SICK AG, SignalQuest LLC, STG Germany GmbH, TE Connectivity Ltd., TEKBOX DIGITAL SOLUTIONS, TSM SENSORS SRL, TURCK India Automation Pvt. Ltd., WIKA Alexander Wiegand SE and Co. KG, WYLER AG are a few of the key vendors in the Tilt Sensor market.

              APAC will register the highest growth rate of 41% among the other regions. Therefore, the Tilt Sensor market in APAC is expected to garner significant business opportunities for the vendors during the forecast period.

              US, China, Germany, Japan, UK

              • Growing adoption of tilt sensors in industrial sectorsThe demand for tilt sensor technology has grown in terms of use and popularity. Tilt sensors are undergoing a series of technological advances. In addition is the driving factor this market.
              • with the ongoing shift of technology from analog to digital and growth in the number of stringent regulations that ensure the safe operation of tilt sensors is the driving factor this market.
              • there is an increase in the number of ways through which technology experts are integrating tilt sensors in their applications. For instance is the driving factor this market.
              • these sensors were primarily used for measuring safety parameters such as vehicle reaction and boom angles. However is the driving factor this market.
              • presently is the driving factor this market.
              • tilt sensors serve a wide spectrum of applications. They are now used to drive improvements in areas such as driver comfort. It is necessary to maintain the safe operation of vehicles/equipment such as tractors is the driving factor this market.
              • off-road vehicles working at a construction site is the driving factor this market.
              • man lifts is the driving factor this market.
              • lift platforms is the driving factor this market.
              • and cranes. Safety has always been of paramount importance is the driving factor this market.
              • specifically in the agriculture and construction industries. Being an indispensable part of these industries is the driving factor this market.
              • tilt sensors are used for applications such as platform leveling is the driving factor this market.
              • tip-over protection is the driving factor this market.
              • and tilt alarms. The growing adoption of tilt sensors in the industrial sector will foster the growth of the global tilt sensor market during the forecast period. is the driving factor this market.

              The Tilt Sensor market vendors should focus on grabbing business opportunities from the Mining and construction industry segment as it accounted for the largest market share in the base year.