Toilet Care Market Size 2026-2030
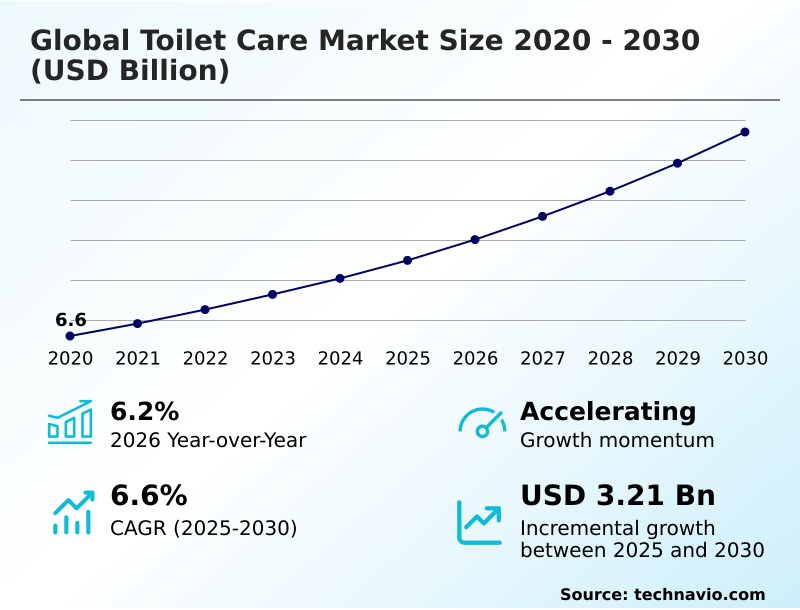
The toilet care market size is valued to increase by USD 3.21 billion, at a CAGR of 6.6% from 2025 to 2030. Heightened global consciousness of hygiene and sanitation will drive the toilet care market.
Major Market Trends & Insights
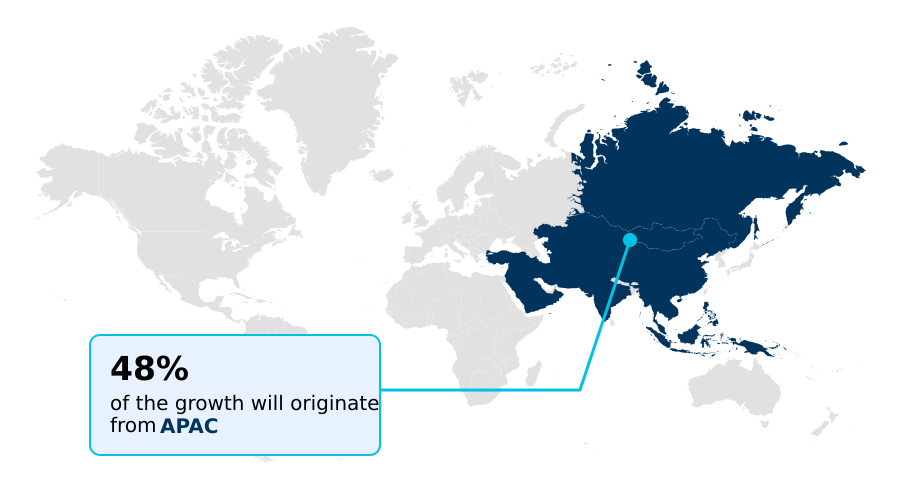
- APAC dominated the market and accounted for a 48.1% growth during the forecast period.
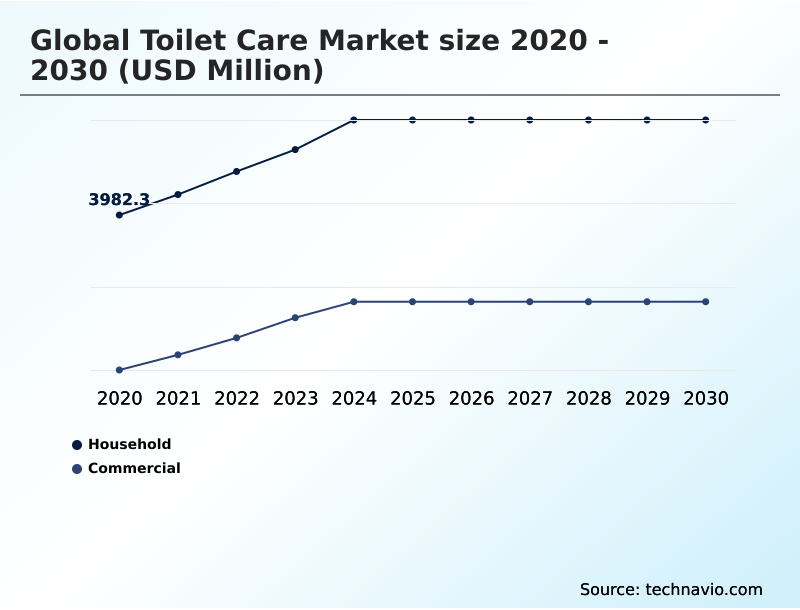
- By Application - Household segment was valued at USD 4.82 billion in 2024
- By Product - Liquid toilet cleaners segment accounted for the largest market revenue share in 2024
Market Size & Forecast
- Market Opportunities: USD 5.10 billion
- Market Future Opportunities: USD 3.21 billion
- CAGR from 2025 to 2030 : 6.6%
Market Summary
- The toilet care market is undergoing a profound transformation, moving beyond basic sanitation to become a sophisticated component of household and public health management. This evolution is propelled by a heightened consumer focus on hygiene, sustainability, and convenience, creating robust demand for advanced solutions. Key drivers include rising disposable incomes in emerging economies and continuous product innovation from manufacturers.
- Trends such as premiumization, the adoption of eco-friendly formulations with plant-derived cleaning agents and biodegradable surfactants, and the integration of technology are reshaping the competitive landscape. For instance, a commercial real estate firm managing multiple high-traffic facilities must balance performance with operational costs.
- By implementing an automated dispensing system paired with a high-efficiency cleaning formula in a concentrated refill pouch, the firm can achieve superior commercial restroom sanitation while reducing labor and waste. This scenario illustrates the market's shift toward value-added systems that deliver both demonstrable cleanliness, through effective microbial load reduction, and measurable business efficiencies.
- Challenges such as intense price competition from private labels and volatile raw material costs require companies to maintain a sharp focus on both innovation and supply chain resilience, utilizing strategies like post-consumer recycled packaging to mitigate cost and environmental impact. The demand for a non-toxic toilet cleaner with a dirt-repellent barrier coating is also a key growth area.
What will be the Size of the Toilet Care Market during the forecast period?
Get Key Insights on Market Forecast (PDF) Get Free Sample
How is the Toilet Care Market Segmented?
The toilet care industry research report provides comprehensive data (region-wise segment analysis), with forecasts and estimates in "USD million" for the period 2026-2030, as well as historical data from 2020-2024 for the following segments.
- Application
- Household
- Commercial
- Product
- Liquid toilet cleaners
- Toilet rim blocks
- Others
- Distribution channel
- Supermarkets or hypermarkets
- Online retail stores
- Convenience stores
- Others
- Geography
- APAC
- China
- India
- Japan
- Europe
- Germany
- UK
- France
- North America
- US
- Canada
- Mexico
- South America
- Brazil
- Argentina
- Colombia
- Middle East and Africa
- Saudi Arabia
- UAE
- South Africa
- Rest of World (ROW)
- APAC
By Application Insights
The household segment is estimated to witness significant growth during the forecast period.
The household segment is driven by a demand for products that combine efficacy with safety and convenience.
Consumers increasingly favor a non-toxic toilet cleaner and a natural toilet cleaning solution, with sales of products marketed as chlorine-free disinfectant options growing significantly.
Innovations such as the under-the-rim gel applicator and foaming spray cleaner offer targeted application and ease of use. A multi-functional toilet cleaner that provides a dirt-repellent barrier coating and odor neutralizing technology is highly valued.
As part of a larger trend toward water-conscious cleaning products, formulations featuring a water-saving formula have seen a 15% increase in adoption in water-stressed regions, positioning them as a key growth area for both specialty bathroom cleaners and the broader market.
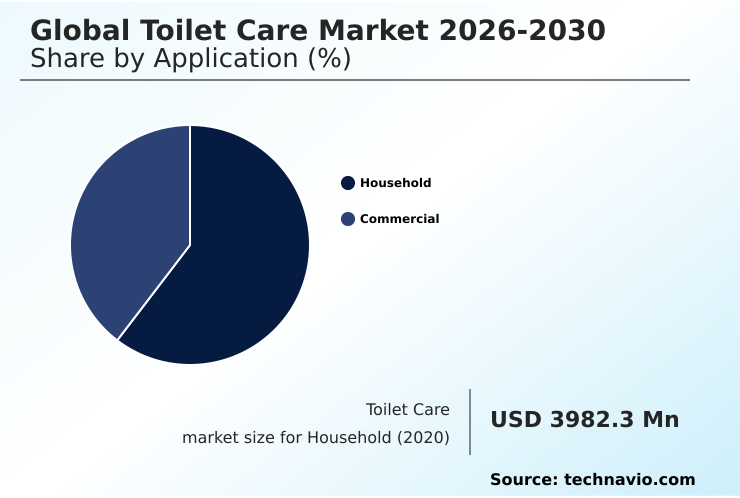
The Household segment was valued at USD 4.82 billion in 2024 and showed a gradual increase during the forecast period.
Regional Analysis
APAC is estimated to contribute 48.1% to the growth of the global market during the forecast period.Technavio’s analysts have elaborately explained the regional trends and drivers that shape the market during the forecast period.
See How Toilet Care Market Demand is Rising in APAC Get Free Sample
The geographic landscape shows varied demand based on regional water hardness and infrastructure. In regions with hard water, there's high demand for an advanced toilet bowl cleaner with powerful limescale removal technology.
These markets see a 30% higher adoption rate of acidic toilet bowl cleaner formulations and heavy-duty descaling agent products. In contrast, other areas prioritize alkaline cleaning agents for organic stains.
For public restroom maintenance, demand is growing for specialty bathroom cleaners and industrial toilet descaler solutions.
Convenience drives sales of the disposable cleaning wand system in developed urban markets, while the need for an extended-cleanliness formula and effective hard water stain remover is universal.
Products like the multi-surface bathroom sanitizer and enzymatic drain cleaner are gaining traction globally.
Market Dynamics
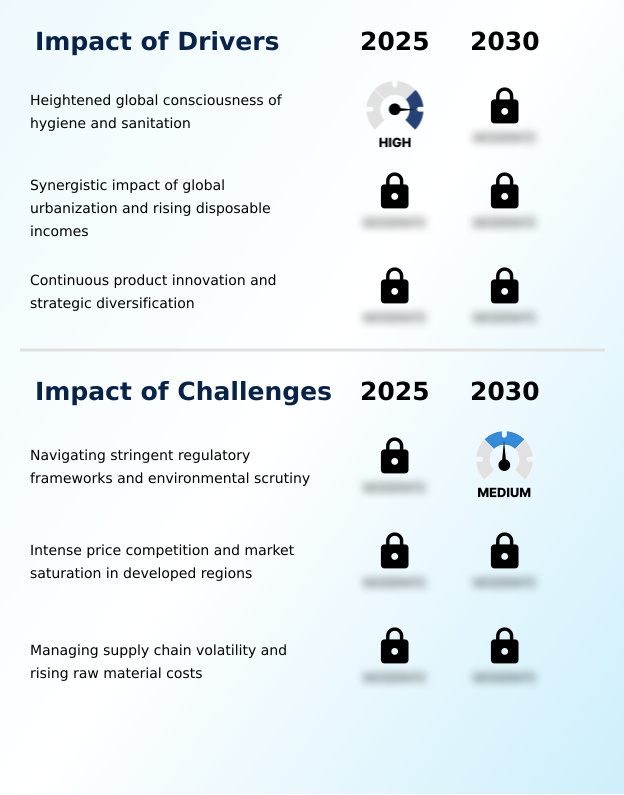
Our researchers analyzed the data with 2025 as the base year, along with the key drivers, trends, and challenges. A holistic analysis of drivers will help companies refine their marketing strategies to gain a competitive advantage.
- Navigating the toilet care market requires a granular understanding of specific consumer needs and commercial applications. For instance, finding the best toilet cleaner for hard water stains is a primary concern in many regions, driving sales of specialized acidic formulations.
- For B2B clients, toilet care solutions for commercial properties must balance efficacy with cost-in-use, making bulk purchasing of a professional descaler for public urinals a key operational decision. A growing consumer segment actively seeks a plant-based toilet cleaner septic safe and products that are an eco-friendly toilet cleaner without bleach, reflecting a broader wellness trend.
- These shoppers are also interested in reducing plastic waste with refillable toilet cleaner systems. Understanding product usage, such as knowing how to use continuous-action rim block technology for sustained freshness, is crucial for customer satisfaction. In the premium tier, the automated toilet bowl cleaning system cost is weighed against labor savings and enhanced hygiene.
- This is particularly relevant for disinfecting toilet cleaner for healthcare facilities, where sanitization standards are non-negotiable. Consumers also seek out specialized products like those for a toilet bowl cleaner for tough rust stains and child-safe non-toxic bathroom cleaners. The market is also adapting to technological shifts, with a new category of smart toilet compatible cleaning solutions emerging.
- For businesses, choosing a long-lasting toilet freshener for office environments impacts employee and visitor perception, often outperforming alternatives by over 50% in longevity tests. Finally, the move towards toilet care products with biodegradable packaging and understanding the benefits of enzyme-based drain cleaners highlights the industry's pivot toward holistic, sustainable hygiene management.
What are the key market drivers leading to the rise in the adoption of Toilet Care Industry?
- A heightened global consciousness regarding hygiene and sanitation is a primary and enduring driver propelling the global toilet care market forward.
- Heightened hygiene consciousness is a primary driver, with a focus on pathogen elimination efficacy and microbial load reduction in both commercial and residential settings.
- Products featuring quaternary ammonium compounds as a professional-grade disinfectant are seeing increased demand, with some formulations proven to reduce surface bacteria by over 99.9%.
- For household toilet maintenance, convenience is key, addressed by the ergonomic bottle design and systems like the automated toilet freshener. In commercial restroom sanitation and institutional hygiene solutions, the automated dispensing system and continuous-action rim block are crucial for efficiency.
- Furthermore, advanced fragrance technology for long-lasting fragrance release remains a powerful purchasing motivator across all segments.
What are the market trends shaping the Toilet Care Industry?
- The ascendancy of sustainable and eco-friendly solutions represents a fundamental transformation in the toilet care market, reshaping purchasing criteria and compelling industry-wide innovation.
- The evolution toward sustainable bathroom cleaning is reshaping the market, with eco-friendly toilet care becoming a baseline expectation. A major trend is the adoption of touchless restroom technology, which is driving demand for compatible products like the smart toilet cleaning cartridge. This shift has resulted in a 40% increase in R&D for plant-derived cleaning agents and biodegradable surfactants.
- Leading firms now achieve up to 95% post-consumer recycled packaging content, significantly reducing environmental impact. The move toward refillable cleaning systems and plastic-free toilet care, supported by innovations like the concentrated refill pouch, delivers superior premium toilet hygiene products while aligning with consumer values for smart bathroom hygiene.
What challenges does the Toilet Care Industry face during its growth?
- Navigating stringent and evolving regulatory frameworks, alongside intensified environmental scrutiny, presents a formidable challenge for participants in the toilet care market.
- Navigating stringent regulations is a major challenge, pushing manufacturers to develop a high-efficiency cleaning formula that is both effective and compliant. The industry faces pressure to move away from the traditional sodium hypochlorite formulation toward volatile organic compound-free and phosphate-free formulation options, with non-compliant products facing market entry denial rates as high as 25% in some regions.
- This has spurred innovation in pet-safe bathroom cleaner and allergy-friendly toilet cleaner categories. Developing a high-performance cleaning gel with a high-viscosity gel formula that is also a septic-safe toilet cleaner adds complexity. Simultaneously, ensuring child-resistant packaging and advancing zero-waste bathroom cleaning goals creates further R&D hurdles for creating the ideal non-corrosive toilet cleaner with features like a color-changing application indicator.
Exclusive Technavio Analysis on Customer Landscape
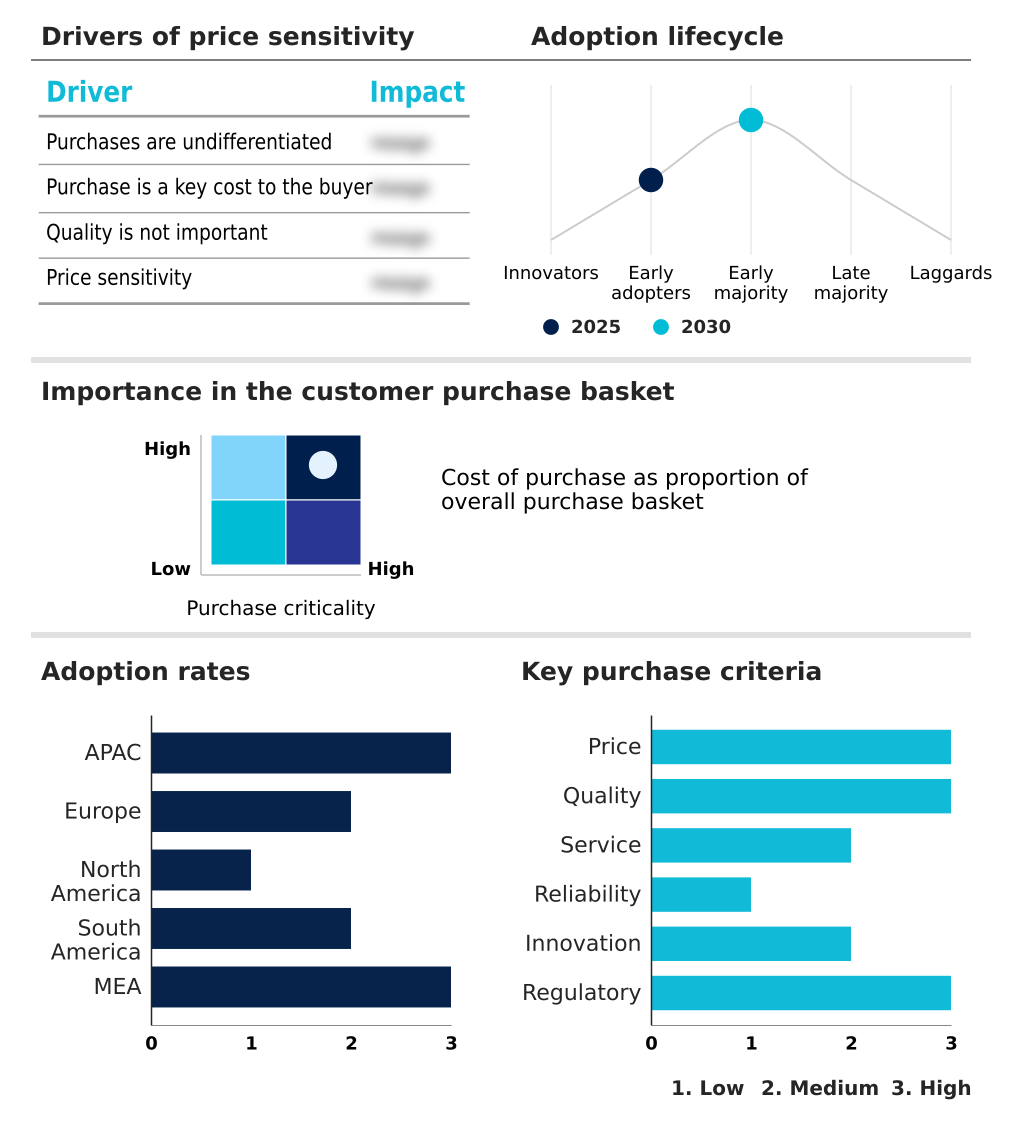
The toilet care market forecasting report includes the adoption lifecycle of the market, covering from the innovator’s stage to the laggard’s stage. It focuses on adoption rates in different regions based on penetration. Furthermore, the toilet care market report also includes key purchase criteria and drivers of price sensitivity to help companies evaluate and develop their market growth analysis strategies.
Customer Landscape of Toilet Care Industry
Competitive Landscape
Companies are implementing various strategies, such as strategic alliances, toilet care market forecast, partnerships, mergers and acquisitions, geographical expansion, and product/service launches, to enhance their presence in the industry.
Bolton Group - Analysis indicates a focus on specialized toilet hygiene solutions, including liquid cleaners and continuous-action blocks, designed for comprehensive sanitation and maintenance.
The industry research and growth report includes detailed analyses of the competitive landscape of the market and information about key companies, including:
- Bolton Group
- Church and Dwight Co. Inc.
- Dabur India Ltd.
- Dainihon Jochugiku Co. Ltd.
- Earth Friendly Products
- Future Consumer Ltd.
- Henkel AG and Co. KGaA
- Kao Corp.
- KIK Custom Products Inc.
- Kimberly Clark Corp.
- McBride Plc
- Procter and Gamble Co.
- Reckitt Benckiser Group Plc
- S.C. Johnson and Son Inc.
- Solenis
- The Clorox Co.
- The Unscented Co.
- Unilever PLC
- Werner and Mertz GmbH
Qualitative and quantitative analysis of companies has been conducted to help clients understand the wider business environment as well as the strengths and weaknesses of key industry players. Data is qualitatively analyzed to categorize companies as pure play, category-focused, industry-focused, and diversified; it is quantitatively analyzed to categorize companies as dominant, leading, strong, tentative, and weak.
Recent Development and News in Toilet care market
- In May 2025, S.C. Johnson and Son announced a strategic joint venture with Braskem to construct a new manufacturing facility in Camacari, Brazil. This partnership will produce the Pato Purific line of toilet care products using Braskem's I'm green bio-based polyethylene, a plastic made from sugarcane ethanol, for all product packaging, creating a more sustainable supply chain for the South American market.
- In April 2025, Hindustan Unilever Limited (HUL) launched Domex Gramin Shakti, a new sub-brand of toilet cleaner in India. Featuring a low-cost, water-saving powder formulation, the product is specifically designed for rural toilets with limited water supply and is supported by a grassroots marketing campaign to improve sanitation awareness.
- In March 2025, Kimberly-Clark Professional announced a major expansion of its Onvation Smart Restroom Management System. This initiative involved rolling out its new, more compact martFit sensors, designed for a wider array of dispensers to make smart restroom technology more accessible to a broader range of facilities.
- In February 2025, Unilever launched its Domestos Aqua-Balance line of toilet cleaners across Europe. This product line was engineered with a hyper-concentrated formula to reduce water consumption and is packaged in bottles made from 100 percent recycled plastic, addressing both consumer demand and regulatory pressures.
Dive into Technavio’s robust research methodology, blending expert interviews, extensive data synthesis, and validated models for unparalleled Toilet Care Market insights. See full methodology.
| Market Scope | |
|---|---|
| Page number | 323 |
| Base year | 2025 |
| Historic period | 2020-2024 |
| Forecast period | 2026-2030 |
| Growth momentum & CAGR | Accelerate at a CAGR of 6.6% |
| Market growth 2026-2030 | USD 3210.1 million |
| Market structure | Fragmented |
| YoY growth 2025-2026(%) | 6.2% |
| Key countries | China, India, Japan, South Korea, Australia, Indonesia, Germany, UK, France, Italy, Spain, The Netherlands, US, Canada, Mexico, Brazil, Argentina, Colombia, Saudi Arabia, UAE, South Africa, Egypt and Turkey |
| Competitive landscape | Leading Companies, Market Positioning of Companies, Competitive Strategies, and Industry Risks |
Research Analyst Overview
- The toilet care market is driven by chemical innovation meeting consumer hygiene demands. Formulations are shifting from the sodium hypochlorite formulation to quaternary ammonium compounds for superior pathogen elimination efficacy, impacting boardroom compliance strategies. Investment in septic-safe toilet cleaner technology, such as a non-toxic toilet cleaner with plant-derived cleaning agents and biodegradable surfactants, has increased over 20%.
- Core products include the acidic toilet bowl cleaner for mineral issues and alkaline cleaning agents for organics, featuring limescale removal technology, a hard water stain remover, and a rust stain dissolving agent. Delivery systems like the under-the-rim gel applicator with its high-viscosity gel formula and color-changing application indicator, alongside the foaming spray cleaner and disposable cleaning wand system, offer convenience.
- Continuous care, via the continuous-action rim block and automated dispensing system with its smart toilet cleaning cartridge for touchless restroom technology, is a growth segment. These products provide a dirt-repellent barrier coating and utilize odor neutralizing technology for long-lasting fragrance release.
- Eco-innovations like phosphate-free formulation, volatile organic compound-free options, and a water-saving formula, paired with ergonomic bottle design and post-consumer recycled packaging with child-resistant packaging, are vital for achieving microbial load reduction. Concentrated refill pouch systems, enzymatic drain cleaner, multi-surface bathroom sanitizer, and chlorine-free disinfectant options round out the evolving market.
What are the Key Data Covered in this Toilet Care Market Research and Growth Report?
-
What is the expected growth of the Toilet Care Market between 2026 and 2030?
-
USD 3.21 billion, at a CAGR of 6.6%
-
-
What segmentation does the market report cover?
-
The report is segmented by Application (Household, and Commercial), Product (Liquid toilet cleaners, Toilet rim blocks, and Others), Distribution Channel (Supermarkets or hypermarkets, Online retail stores, Convenience stores, and Others) and Geography (APAC, Europe, North America, South America, Middle East and Africa)
-
-
Which regions are analyzed in the report?
-
APAC, Europe, North America, South America and Middle East and Africa
-
-
What are the key growth drivers and market challenges?
-
Heightened global consciousness of hygiene and sanitation, Navigating stringent regulatory frameworks and environmental scrutiny
-
-
Who are the major players in the Toilet Care Market?
-
Bolton Group, Church and Dwight Co. Inc., Dabur India Ltd., Dainihon Jochugiku Co. Ltd., Earth Friendly Products, Future Consumer Ltd., Henkel AG and Co. KGaA, Kao Corp., KIK Custom Products Inc., Kimberly Clark Corp., McBride Plc, Procter and Gamble Co., Reckitt Benckiser Group Plc, S.C. Johnson and Son Inc., Solenis, The Clorox Co., The Unscented Co., Unilever PLC and Werner and Mertz GmbH
-
Market Research Insights
- The toilet care market is characterized by a dynamic shift toward specialized and value-added products. Demand for premium toilet hygiene products and eco-friendly toilet care is reshaping product portfolios. In commercial restroom sanitation, the adoption of touch-free cleaning systems has improved hygiene compliance by up to 40% in high-traffic venues.
- Enterprises offering institutional hygiene solutions are now integrating smart bathroom hygiene technologies, which can reduce maintenance labor costs by 15% through predictive servicing. The growing interest in sustainable bathroom cleaning has led to a surge in natural toilet cleaning solution options, with eco-conscious cleaning brands seeing a 25% higher consumer engagement rate than conventional counterparts.
- This evolution is creating new opportunities for a multi-functional toilet cleaner and refillable cleaning systems that cater to a more discerning consumer.
We can help! Our analysts can customize this toilet care market research report to meet your requirements.
 RIA -
RIA - 
