Total Reflection X-Ray Fluorescence Spectrometer Market Size 2025-2029
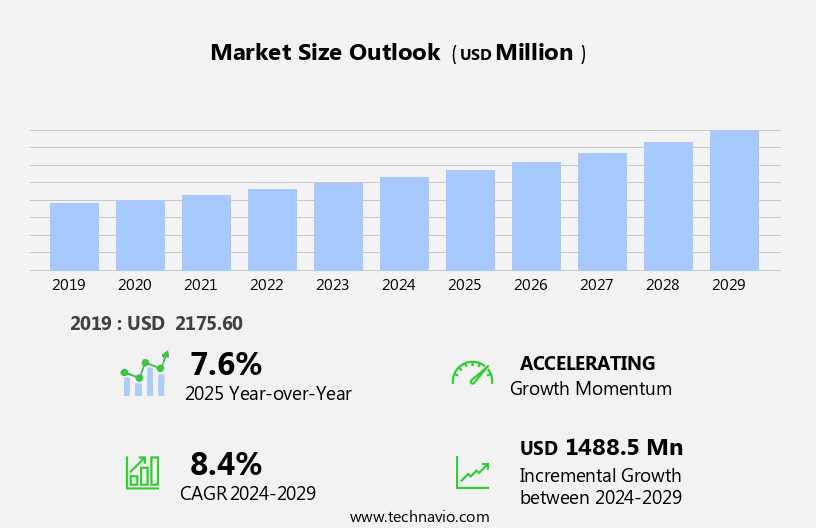
The total reflection x-ray fluorescence spectrometer market size is forecast to increase by USD 1.49 billion, at a CAGR of 8.4% between 2024 and 2029.
- The market is experiencing significant growth due to the increasing emphasis on drug discovery and development. This sector relies heavily on advanced analytical tools, including TR-XRF spectrometers, to identify and quantify elements in complex samples. Furthermore, emerging markets are demonstrating a rising demand for these instruments, driven by the expanding pharmaceutical and chemical industries in regions such as Asia Pacific and Latin America. It indicates that innovations in digital X-Ray technology, such as high-resolution imaging and 3D imaging, are enhancing diagnostic accuracy and enabling faster diagnosis.
- By focusing on these key drivers and challenges, companies can effectively capitalize on market opportunities and navigate obstacles in the evolving market landscape. However, the high cost of TR-XRF spectrometers remains a notable challenge for market expansion. Manufacturers must address this issue through innovation and cost reduction strategies to make these instruments more accessible to a wider customer base and maintain their competitive edge. Computed tomography (CT) and digital radiography (DR) are transforming diagnostic imaging, offering high-definition imaging and 3D reconstruction.
What will be the Size of the Total Reflection X-Ray Fluorescence Spectrometer Market during the forecast period?
- The Total Reflection X-Ray Fluorescence (TXRF) spectrometer market encompasses various applications, including material science and pharmaceutical industries. Quality assurance is a significant driver, with TXRF's ability to ensure product consistency and compliance. Detector technology advancements and instrument validation are crucial for market growth. In quality control procedures, analytical method validation, sample storage, and preparation techniques are essential. Sensitivity optimization and food safety applications are gaining traction, addressing matrix effects and environmental concerns. Method performance evaluation, software packages, and sample handling are integral to the analytical services market.
- XRF spectrometer design, calibration strategies, and sample homogeneity are key considerations. Standard reference materials and data analysis techniques ensure accuracy and reliability. Excitation source selection and analytical method transfer are ongoing research topics. Signal processing and method development continue to advance the capabilities of TXRF technology. The market is further driven by the integration of deep learning and AI in X-ray image recognition, enabling remote and automated diagnosis.
How is this Total Reflection X-Ray Fluorescence Spectrometer Industry segmented?
The total reflection x-ray fluorescence spectrometer industry research report provides comprehensive data (region-wise segment analysis), with forecasts and estimates in "USD million" for the period 2025-2029, as well as historical data from 2019-2023 for the following segments.
- End-user
- Pharmaceutical industry
- Food and beverage industry
- Environment monitoring
- Others
- Type
- Atomic spectrometers
- Molecular spectrometers
- Mass spectrometers
- Technology
- Energy dispersive X-ray fluorescence
- Micro X-ray fluorescence
- Spectrum processing algorithms
- Others
- Geography
- North America
- US
- Canada
- Europe
- France
- Germany
- Italy
- Spain
- UK
- APAC
- China
- India
- Japan
- Rest of World (ROW)
- North America
By End-user Insights
The pharmaceutical industry segment is estimated to witness significant growth during the forecast period. Total reflection X-ray fluorescence spectrometry (TXRF) is a versatile analytical technique that utilizes synchrotron radiation or laboratory X-ray sources to provide quantitative elemental analysis of thin films and surfaces. This technique offers several advantages, including high sensitivity, spectral interpretation capabilities, and a wide dynamic range. In the realm of pharmaceutical analysis, TXRF plays a crucial role in the development of new drugs through high-throughput screening, quantitative analysis, and sensitivity enhancement. TXRF's non-destructive nature sets it apart from other techniques, such as mass spectrometry. This attribute is particularly valuable in the pharmaceutical industry, where preserving sample integrity is essential. The technique's ability to rapidly screen and map the binding sites of small molecules to various protein targets further increases its appeal.
TXRF's application scope extends beyond pharmaceuticals to encompass various industries, including food safety, semiconductor analysis, and material science. Sample preparation is a critical aspect of TXRF analysis, and advanced techniques, such as on-site analysis and portable spectrometers, facilitate ease of use and flexibility. In the realm of data analysis, TXRF benefits from the integration of artificial intelligence, expert systems, and machine learning algorithms to enhance data interpretation and improve method development. Spectrometer calibration, data processing, and quality control are essential components of TXRF analysis, ensuring accurate and reliable results. TXRF's applications are vast, ranging from elemental analysis and trace element analysis to thin film analysis and regulatory compliance. The technology segment is fragmented into atomic absorption, X-ray fluorescence, X-ray diffraction, and others.
The technique's ability to provide in-situ analysis and real-time data acquisition is increasingly valuable in industries such as environmental monitoring and remote sensing. In summary, the market is driven by the technique's versatility, non-destructive nature, and ability to provide high-resolution spectral data. Its applications span various industries, including pharmaceuticals, food safety, semiconductor analysis, and material science. The integration of advanced technologies, such as artificial intelligence and machine learning, further enhances the technique's capabilities, making it an indispensable tool for analytical chemistry and research organizations.
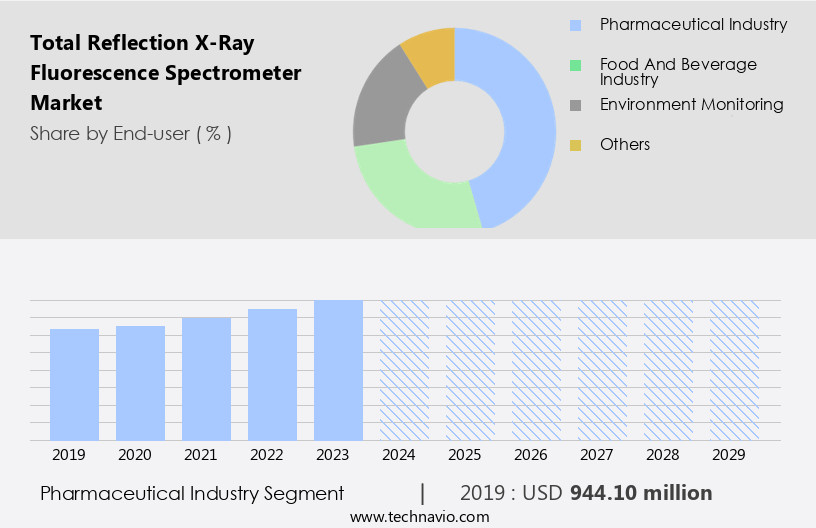
The Pharmaceutical industry segment was valued at USD 944.10 billion in 2019 and showed a gradual increase during the forecast period.
Regional Analysis
Europe is estimated to contribute 39% to the growth of the global market during the forecast period. Technavio's analysts have elaborately explained the regional trends and drivers that shape the market during the forecast period.
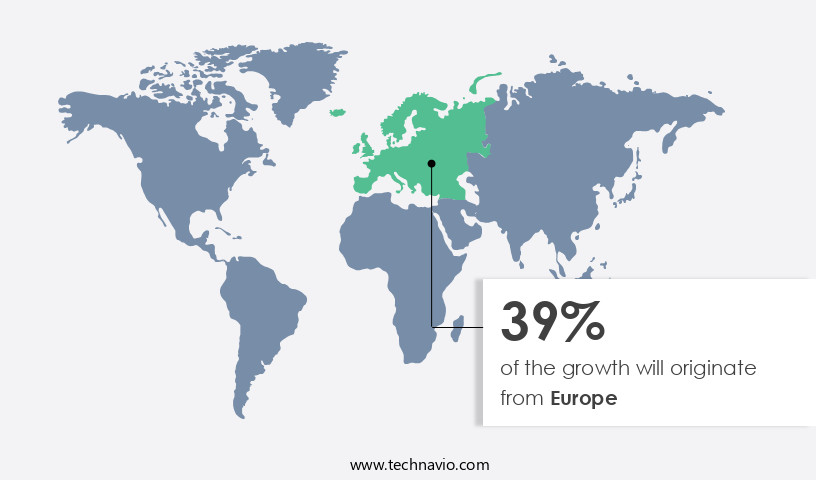
Total Reflection X-ray Fluorescence (TXRF) spectrometry plays a pivotal role in various industries, particularly in Europe, where stringent regulations demand accurate trace element analysis in environmental samples and rigorous quality control in manufacturing, pharmaceuticals, food, and electronics sectors. TXRF spectrometry's ability to analyze thin films, electronic components, and environmental samples such as soil, water, and air, has fueled its adoption. In the electronics industry, TXRF is used for materials analysis and quality control in semiconductor manufacturing. Advancements in TXRF instrumentation, including enhanced sensitivity, resolution, and automation, have expanded its application scope. Pharmaceutical analysis benefits from TXRF's high-throughput screening capabilities and quantitative analysis, ensuring regulatory compliance.
Food safety is another sector that leverages TXRF for trace element analysis, ensuring consumer protection. Surface analysis is another significant application of TXRF, providing valuable information about the composition and properties of materials. Material science and contract research organizations also use TXRF for method development and transfer, thin film analysis, and method validation. In-situ analysis and on-site analysis are becoming increasingly popular due to the portability of TXRF spectrometers. Data acquisition, processing, and interpretation are facilitated by advanced analytical software, while calibration standards ensure instrument performance. Data management and quality control applications are essential for maintaining accurate and reliable results.
Machine learning and artificial intelligence are integrated into TXRF systems, enhancing data visualization and interpretation. Time-resolved analysis and synchrotron radiation are also employed to improve sensitivity and spectral interpretation. The integration of expert systems and X-ray detectors further boosts the technique's capabilities. TXRF's versatility and continuous advancements make it an indispensable tool for various industries, ensuring regulatory compliance, enhancing product quality, and driving innovation. The technology segment is fragmented into atomic absorption, X-ray fluorescence, X-ray diffraction, and others.
Market Dynamics
Our researchers analyzed the data with 2024 as the base year, along with the key drivers, trends, and challenges. A holistic analysis of drivers will help companies refine their marketing strategies to gain a competitive advantage.
What are the Total Reflection X-Ray Fluorescence Spectrometer market drivers leading to the rise in the adoption of Industry?
- The increasing prioritization of drug discovery and development is the primary catalyst driving market growth. Total Reflection X-ray Fluorescence Spectrometers (TRXRF) have gained significant importance in the scientific community, particularly in the pharmaceutical industry and research institutes, due to the rising prevalence of chronic diseases worldwide. Four major chronic conditions, including cardiovascular diseases (CVDs), cancer, chronic obstructive pulmonary disease, and type 2 diabetes, are prevalent globally and are caused by factors such as high blood pressure, high blood cholesterol, obesity, lack of physical activity, unhealthy diet, and tobacco use. The increase in research and development spending in the pharmaceutical industry to combat these diseases has led to the adoption of TRXRF spectrometers.
- These instruments are versatile and efficient in discovering high-affinity ligands for biologically related macromolecules, clarifying ligand-binding sites, and detecting small molecules with broad ranges of binding affinity. This makes TRXRF a robust and valuable tool in structure-based drug design. Moreover, TRXRF offers several advantages, such as high sensitivity, excellent signal-to-noise ratio, and data visualization capabilities, which enable precise elemental analysis, trace element analysis, and thin film analysis. The instrument's performance is crucial for analytical method development, method validation, method transfer, and analytical services. The ability to perform on-site analysis and remote sensing further enhances the instrument's utility, making it an indispensable tool for researchers and scientists. Overall, the demand for TRXRF spectrometers is expected to continue growing due to their role in advancing scientific research and drug discovery.
What are the Total Reflection X-Ray Fluorescence Spectrometer market trends shaping the Industry?
- The increasing demand for total reflection X-ray fluorescence spectrometers is a notable market trend, particularly in emerging economies. This technology is gaining popularity due to its applications in various industries, including material analysis and environmental monitoring. The market is experiencing significant growth due to several factors. In the realm of analytical chemistry, regulatory compliance plays a pivotal role, driving the demand for advanced and accurate analytical tools. Total reflection X-Ray Fluorescence Spectrometers (TXRF) offer high precision and sensitivity, making them indispensable for quality control applications. Moreover, the advent of handheld spectrometers has expanded the scope of TXRF applications, enabling in-situ analysis. Machine learning algorithms are increasingly being integrated into data acquisition and processing systems, enhancing the efficiency and accuracy of data management.
- Process industries, particularly the chemical industry, are experiencing rapid growth, leading to an increased need for advanced analytical tools like TXRF spectrometers. Private investments in research and development are also contributing to the market's expansion. Furthermore, the trend of relocating R&D facilities from developed countries to emerging economies in Asia Pacific, due to lower labor and capital costs and stable economies, is expected to fuel the demand for TXRF spectrometers during the forecast period. Calibration standards are crucial for maintaining the reliability and accuracy of TXRF systems, and ongoing research and development efforts are focused on improving calibration methods.
How does Total Reflection X-Ray Fluorescence Spectrometer market face challenges during its growth?
- The high cost of X-ray fluorescence spectrometers, which utilize total reflection X-ray fluorescence (TXRF) technology, poses a significant challenge to the industry's growth. This advanced analytical technique offers numerous benefits, including high sensitivity and elemental identification capabilities. However, the high capital expenditure required to acquire and maintain these instruments can hinder market expansion, particularly for smaller businesses and research institutions. Total reflection X-ray fluorescence (TXRF) spectrometers offer high-performance quantitative analysis in various industries, including pharmaceutical and semiconductor analysis. Synchrotron radiation, a powerful X-ray source, enhances sensitivity in TXRF spectrometry, making it an essential tool for trace element analysis. However, the high cost of these spectrometers, ranging from USD7,000 to USD700,000, and the subsequent maintenance expenses can pose a challenge to their adoption. The total cost of ownership for a TXRF spectrometer includes the initial investment, as well as ongoing expenses for maintenance, service, and repair. Advancements in technology, such as spectral interpretation and artificial intelligence, contribute to the market's growth.
- These technologies improve the accuracy and efficiency of TXRF spectrometry, making it a valuable tool for industries requiring precise quantitative analysis. In food safety and pharmaceutical analysis, TXRF spectrometry's limit of quantification is a crucial factor, ensuring regulatory compliance and product quality. Sample preparation is also a critical aspect, as proper preparation ensures accurate and reliable results. The high initial investment and maintenance costs of TXRF spectrometers can be a barrier to entry for some organizations. However, the benefits of this advanced analytical technique, including high sensitivity, accuracy, and efficiency, make it an indispensable tool for industries requiring trace element analysis. The integration of advanced technologies, such as artificial intelligence and spectral interpretation, further enhances the capabilities of TXRF spectrometry, making it a valuable investment for businesses seeking to improve their analytical capabilities.
Exclusive Customer Landscape
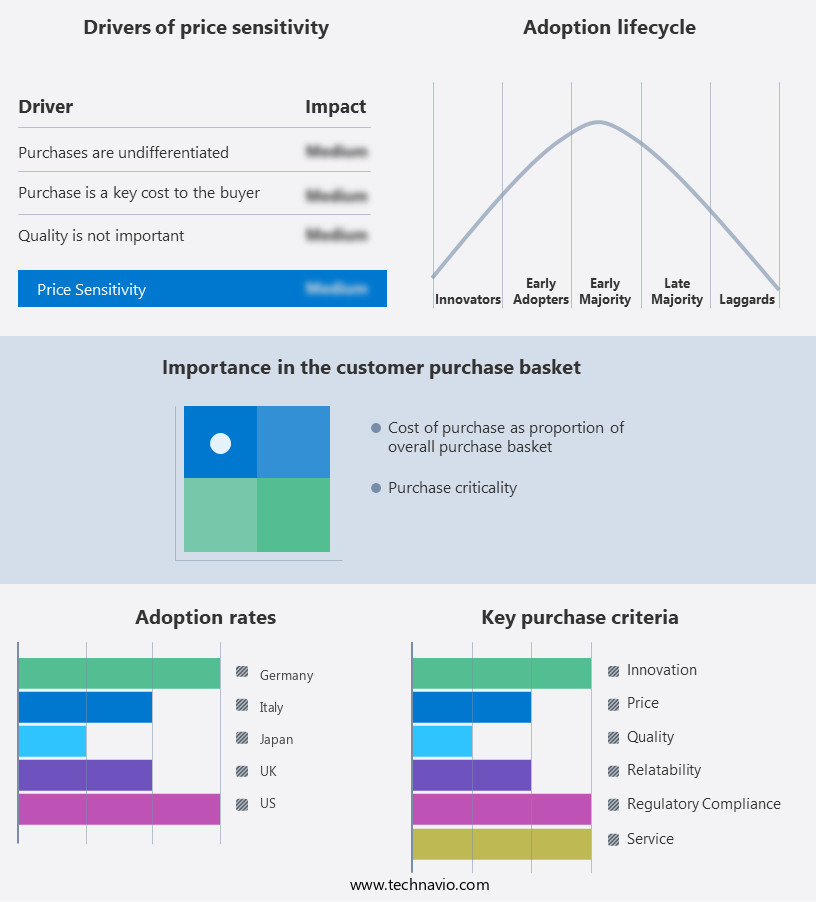
The total reflection X-ray fluorescence spectrometer market forecasting report includes the adoption lifecycle of the market, covering from the innovator's stage to the laggard's stage. It focuses on adoption rates in different regions based on penetration. Furthermore, the total reflection X-ray fluorescence spectrometer market report also includes key purchase criteria and drivers of price sensitivity to help companies evaluate and develop their market growth analysis strategies.
Customer Landscape
Key Companies & Market Insights
Companies are implementing various strategies, such as strategic alliances, total reflection x-ray fluorescence spectrometer market forecast, partnerships, mergers and acquisitions, geographical expansion, and product/service launches, to enhance their presence in the industry.
AMETEK Inc. - This company specializes in advanced X-ray fluorescence (XRF) spectrometers, including the SPECTRO XEPOS model, for precise thin film analysis, environmental testing, and pharmaceutical applications.
The industry research and growth report includes detailed analyses of the competitive landscape of the market and information about key companies, including:
- AMETEK Inc.
- Bourevestnik JSC
- Bruker Corp.
- Contech Instruments Ltd.
- EAG Laboratories
- GNR srl
- Hitachi Ltd.
- HORIBA Ltd.
- JEOL Ltd.
- LANScientific Co. Ltd.
- Olympus Corp.
- Rayspec Ltd.
- Rigaku Corp.
- SciAps Inc.
- Shimadzu Corp.
- Skyray Instruments USA Inc.
- Spectris Plc
- Thermo Fisher Scientific Inc.
- Wuxi Jinyibo Instrument Technology Co. Ltd.
- Zhengzhou Laboao Instrument Equipment Co. Ltd.
Qualitative and quantitative analysis of companies has been conducted to help clients understand the wider business environment as well as the strengths and weaknesses of key industry players. Data is qualitatively analyzed to categorize companies as pure play, category-focused, industry-focused, and diversified; it is quantitatively analyzed to categorize companies as dominant, leading, strong, tentative, and weak.
Recent Development and News in Total Reflection X-Ray Fluorescence Spectrometer Market
- In February 2023, Thermo Fisher Scientific, a leading life sciences solutions provider, announced the launch of its new Ametek Niton XL3t GOLDD+ Total Reflection X-Ray Fluorescence (TXRF) spectrometer. This advanced instrument offers enhanced detection limits and improved accuracy for elemental analysis in various industries, including semiconductor, environmental, and materials science (Thermo Fisher Scientific Press Release, 2023).
- In May 2022, Bruker Corporation, a prominent supplier of analytical and research solutions, entered into a strategic partnership with Elemental Scientific, a leading manufacturer of high-purity materials and isotopes. This collaboration aims to integrate Bruker's TXRF systems with Elemental Scientific's high-purity materials to provide comprehensive solutions for the semiconductor industry (Bruker Corporation Press Release, 2022).
- In January 2021, Malvern Panalytical, a global provider of analytical measurement solutions, received the CE marking for its Epsilon 5 X-Ray Fluorescence (XRF) spectrometer. This certification enables the company to sell its TXRF system in Europe, expanding its market reach and strengthening its position in the region (Malvern Panalytical Press Release, 2021).
- In October 2019, Hitachi High-Technologies Corporation, a Japanese technology company, showcased its new X-Ray Fluorescence Analyzer, model S-4800, at the Analytica China trade fair. This advanced TXRF system offers high-sensitivity analysis and a wide dynamic range, making it suitable for various applications in the electronics, environmental, and materials industries (Hitachi High-Technologies Corporation Press Release, 2019).
Research Analyst Overview
The total reflection X-ray fluorescence (TXRF) spectrometer market is characterized by its continuous evolution and dynamic nature, driven by advancements in technology and expanding applications across various sectors. TXRF spectrometry offers high-throughput screening capabilities and sensitivity enhancement, making it an essential tool for quantitative analysis in fields such as material science, pharmaceutical analysis, and semiconductor analysis. In the realm of regulatory compliance, TXRF spectrometry plays a crucial role in ensuring quality control in industries like food safety and environmental monitoring. The integration of machine learning algorithms and expert systems enhances data interpretation and analysis, enabling faster and more accurate results.
The market's unfolding patterns are further shaped by the development of portable spectrometers and on-site analysis capabilities, which expand the reach of TXRF spectrometry beyond traditional laboratory settings. Additionally, advancements in data management, calibration standards, and data processing enable more efficient and effective analytical services. The integration of advanced technologies such as synchrotron radiation, artificial intelligence, and data visualization tools continues to push the boundaries of TXRF spectrometry, enhancing its capabilities for time-resolved analysis, thin film analysis, and method development. As the market continues to evolve, it remains essential for industry professionals to stay informed of the latest trends and advancements to optimize their analytical methods and maintain instrument performance.
Dive into Technavio's strong research methodology, blending expert interviews, extensive data synthesis, and validated models for unparalleled Total Reflection X-Ray Fluorescence Spectrometer Market insights. See full methodology.
|
Market Scope |
|
|
Report Coverage |
Details |
|
Page number |
229 |
|
Base year |
2024 |
|
Historic period |
2019-2023 |
|
Forecast period |
2025-2029 |
|
Growth momentum & CAGR |
Accelerate at a CAGR of 8.4% |
|
Market growth 2025-2029 |
USD 1.49 billion |
|
Market structure |
Fragmented |
|
YoY growth 2024-2025(%) |
7.6 |
|
Key countries |
US, Germany, China, Canada, France, UK, Japan, Italy, India, and Spain |
|
Competitive landscape |
Leading Companies, Market Positioning of Companies, Competitive Strategies, and Industry Risks |
What are the Key Data Covered in this Total Reflection X-Ray Fluorescence Spectrometer Market Research and Growth Report?
- CAGR of the Total Reflection X-Ray Fluorescence Spectrometer industry during the forecast period
- Detailed information on factors that will drive the growth and forecasting between 2025 and 2029
- Precise estimation of the size of the market and its contribution of the industry in focus to the parent market
- Accurate predictions about upcoming growth and trends and changes in consumer behaviour
- Growth of the market across Europe, North America, APAC, Middle East and Africa, and South America
- Thorough analysis of the market's competitive landscape and detailed information about companies
- Comprehensive analysis of factors that will challenge the total reflection x-ray fluorescence spectrometer market growth of industry companies
We can help! Our analysts can customize this total reflection x-ray fluorescence spectrometer market research report to meet your requirements.
 RIA -
RIA - 
